


Marc Chandler
My articles My offerMy siteAbout meMy videosMy books
Follow on:LinkedINTwitterSeeking AlphaAmazon
The trajectory of monetary policy in the US and Europe has been fairly clear. There is practically no doubt that the Fed will hike rates on September 26. Despite softer than expected PPI and CPI figures, the market has become more confident of another move in December. The Federal Reserve’s balance sheet unwind reaches its maximum velocity of $50 bln a month in Q4.
EurozoneIt is also understood that ECB will reduce its asset purchases to 15 bln euro a month in Q4 and finish at the end of the year. Interest rates will not be raised for another year. The reinvestment of maturing proceeds appears to be the next operational issue that needs to be sorted. The capital key will continue to be lodestar, but many investors are interested in the strategy, and in particular, the maturities that will be considered. |
Economic Events: Eurozone, Week September 17 - Click to enlarge |
United KingdomThe Bank of England has been clear. Rates need to gradually increase. By gradually, the Federal Reserve has meant in practice anything between two and four hikes a year. By gradually, the Bank of England means once a year. Next week’s high-frequency data is expected to reinforce the understanding that there most likely will not be another increase in the base rate until after next March when the UK leaves the EU. All three measures of consumer prices (CPIH, CPI, and core CPI) are expected to ease slightly, while retail sales are likely to soften after the strong 0.9% rise in July, excluding petrol. The UK consumer is still shopping even though there will be some payback. Through July UK retail sales have risen by an average of 0.5% a month. The average for the same period last year was 0.1%. |
Economic Events: United Kingdom, Week September 17 - Click to enlarge |
JapanThe Bank of Japan has been more difficult for investors. It is buying fewer JGBs but it denies tapering. It comes to the market less frequently to buy government bonds, but it increased the amount of the operations. It is not exactly clear why it is still buying ETFs, though here too, it may be slowing its purchases. The BOJ meets this week it is not expected to announce any new innovations and reiterate its commitment to boost prices. The August CPI will be reported later in the week and the core rate, which the BOJ targets, is expected to tick up to 0.9%. It had risen steadily even if slowly over the past couple of years before softening this a few months earlier this year. Yet, the increase in energy goes a long way in explaining the improvement. Excluding energy from the core, and the rate was 0.3% and is expected to rise to 0.4% due to restaurants and apparel. |
Economic Events: Japan, Week September 17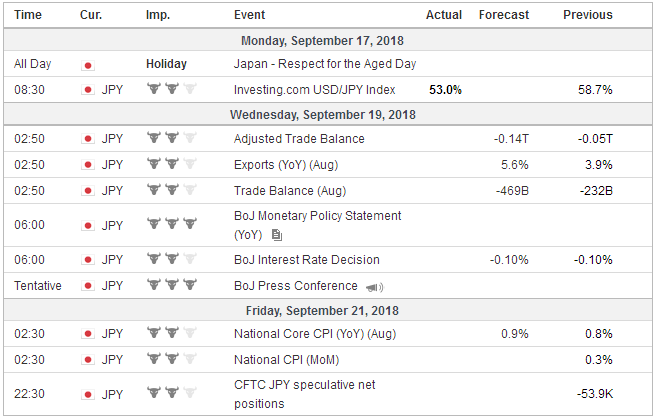 - Click to enlarge |
United StatesWhat has gone largely unremarked is that the premium the US offers on two-year money continues to steadily increase. Many participants argue that last year’s heavy dollar tone in the face of Fed tightening shows that interest rates differentials are not helping in anticipating changes in the foreign exchange market. This is a bit of a strawman. Interest rates are not the only determinants of exchange rates and can be overwhelmed by other factors. That is what we understand to have happened last year. After the UK referendum and Trump’s election, investors were afraid of the populist-nationalist wave sweeping across Europe in a series of elections. Many were under-weight European assets. When it became clear that this was not going to be the case, these investors moved back to Europe and sent the euro higher, triggering the echo of trend followers and momentum players. Interest rates are an important dimension in the price of money and the US premium over Germany on two-year money rose to 331 bp before the weekend. It is the most since at least 1990. It has risen 80 bp this year. It rose every month since last July before dipping less than a single basis point in August. The US premium over the UK widened to 196 bp before the weekend. It is also the most since at least 1990. It has risen about 55 bp this year. The US 2-year premium over Japan rose to 288 bp at the end of last week. That is the most in a dozen years. It is up a little more than 85 bp this year. The US premium over Australia also trended higher last week to reach 75 bp, which is the most in more than 20 years. At the end of last year, Australia was paying 8.5 bp more than the US. |
Economic Events: United States, Week September 17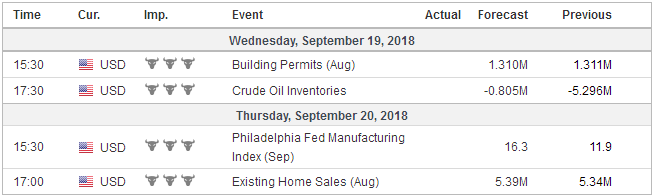 - Click to enlarge |
Switzerland |
Economic Events: Switzerland, Week September 17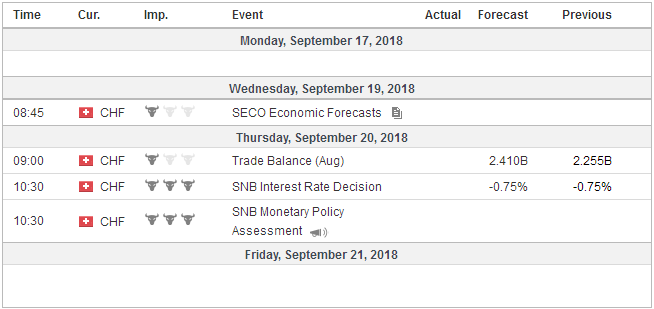 - Click to enlarge |
Canada stands out as an exception. The US premium of 64 bp is a little above the middle of the 45 bp to 75 bp six-month range. The US premium was near 100 bp in 2005-2006, and it was at 200 bp in early 1997. However, it is still in the upper end of what it has been since the financial crisis, and it has risen 17 bp in the past four weeks, even though the market expects the Bank of Canada to hike rates in October after the Fed hikes on September 26. We interpret this to reflect the judgment that the Bank of Canada will not be able to match the pace of Fed hikes going forward.
Norway’s central bank meets next week, and it is likely to hike rates. Unlike Sweden, which reported an unexpected decline in inflation last week that dragged the krona lower, Norway’s underlying inflation (which excludes energy and adjusts for tax changes) has risen dramatically from a 1.1% year-over-year pace in June to 1.9% in August. This is strongest it has been since January 2017. However, here too the US premium has steadily risen and the two-year swap rate (no liquid two-year government bond) rose to almost 140 bp last week, the most since 2006. It has risen about 46 bp since the end of 2017.
It seems revealing that the US 2-year yield rose last week despite the softer than expected PPI and CPI reports. The yield rose 6.5 bp to 3.0%. Consider that over the past three-months coming into last week the two-year yield was up a single basis point. It is at a ten-year high. Investors are looking past the near-term vagaries of high-frequency data and see near full employment and more fiscal stimulus in the pipeline.
Many are convinced inflation is rising and that the Fed tightening cycle will last longer than previously anticipated. Consider that the implied yield of the December 2019 fed funds futures contract has risen 17 bp since the August jobs report. Comments from Fed officials like Governor Brainard and several Fed presidents have fed such ideas by downplaying the significance of reaching the neutral rate (now estimated around 2.8%).
Yet we suspect that the rise in US yields is over-determined in the sense that there is not only one driver. It strikes us that inflation expectations have eased even as US rates have risen. Consider that the 5-year breakeven was 215 bp in mid-May and fell to about 195 bp by mid-August and now is near 200 bp. Consistent with this was the preliminary September University of Michigan’s survey of inflation expectations. The one-year outlook slipped to 2.8% from 3.0%, and the 5-10-year expectation eased to 2.4% from 2.6%.
This suggests that the increase in nominal rates reflects an increase in the real rate. This is reinforced by a review of the T-bill performance. Both the generic three-month and 12-month bill yields have risen by 70-75 bp this year. Besides the Fed’s moves, supply considerations may also be lifting rates. It is a hypothesis that investors will want to test going forward, especially as $1 trillion deficits loom.
The US reports the Q2 flow of funds and current account data. It will shed light on the magnitude of the repatriation under the tax reform. In the Q1, it appears that about $300 bln was brought back to the US, by which we mean a transfer of funds in purely accounting terms, which show up in the current account. To put this in perspective consider that in 2005, during the last tax holiday, corporations repatriated $312 bln for the entire year. By some conservative calculations, in 2005, the non-financial businesses repatriated about 40% of their offshore cash.
Reports estimate that the three largest cash piles overseas by US corporates account at about $515 bln and the next 13 have another $500 bln. Estimates of what is ultimately available range from a little more than $1 trillion to more than $2 trillion. Anticipating the favorable tax changes, some businesses may have boosted their offshore cash holdings late last year. Keeping to conservative estimates, there may be another $100-$200 bln that may be repatriated this year.
There has not been a surge in investment, which makes sense as, especially for large companies, access to capital is not a hindrance to investment decisions. Share buybacks have increased; dividends, not so much. There is some concern that the corporate treasurers may choose different cash management tools for onshore funds than they had when the funds were offshore.
Some recent disappointing data from the interest-rate sensitive US housing sector will ensure that this week’s housing starts, permits, and existing home sales attract attention. Housing starts have alternated between increases and decreases this year, and they rose in July. Economists are expecting a small increase in August, which would be the first back-to-back gain in nearly a year. While housing starts in July were a little lower (~1.4%) from a year ago, permits were 3.5% higher.
Existing home sales are expected to increase, but over the past several months the median forecast in the Bloomberg survey over-estimated sales. Existing home sales have fallen for four consecutive months through July, the longest decline in five years. The July pace of 5.34 mln (seasonally-adjusted annual pace) is the lowest since February 2016.
Lastly, we turn to trade, where reports suggest that despite the Treasury inviting China for talks, President Trump is still pressing to make good on his threat to impose tariffs on $200 bln of Chinese goods. The Wall Street Journal reported that the tariff could be 10% instead of 25% that was threatened. We have been skeptical that the talks would amount to much, as trade policy in this administration is not set at Treasury. If true, Trump’s comments give China even less of a reason to take the talks seriously. We have suggested that the next window of opportunity for a breakthrough may be the G20 meeting in late November, after the US elections, which both Trump and Xi could talk.
Japan’s trade figures will be a timely reminder of the complexities. Economists expect that Japan recorded its first back-to-back trade deficit in August. Japan’s trade surplus has fallen sharply this year. In the first seven months of 2017, the average monthly trade surplus was JPY202.4 bln. For the same period this year, the average surplus has fallen to JPY52.7 bln.
Exports in July were 3.9% higher year-over-year. In July 2017, they were up 13.4%. Imports in July were up 14.6% year-over-year compared with a 16.5% increase in July 2017. Energy likely accounts for a good part of the import strength as oil prices were up about 50% in July from a year ago.
Full story here Are you the author?Tags: #GBP,#USD,$AUD,$CAD,$EUR,$JPY,newsletter,Norwegian Krone


