Pater Tenebrarum
My articles My siteAbout meMy videosMy books
Follow on:TwitterSeeking AlphaFacebook
The GoldminbiIn recent weeks gold apparently decided it would be a good time to masquerade as an emerging market currency and it started mirroring the Chinese yuan of all things. Since the latter is non-convertible this almost feels like an insult of sorts. As an aside to this, bitcoin seems to be frantically searching for a new position somewhere between the South African rand the Turkish lira. The bears are busy dancing on their graves. The technical divergences we previously spotted have for the most part given up the ghost rather unceremoniously and quickly, although there are some remnants of technical hope in the form of diminishing momentum of the downtrend in gold and the lack of a new low in the HUI-gold ratio. We don’t want to make too much of the latter, since it wouldn’t take much to erase this divergence as well, and obviously the previous “breakout” in the ratio turned out to be misleading. A few other interesting developments have occurred though, which we discuss further below. |
 Generally speaking bears have little to celebrate these days, but in some sectors they still do. If you want dancing bears with music, they have those on Youtube. |
|
There have been no further improvements in the fundamental backdrop for gold, although it seemed for a while as though things were beginning to shift in favor of the metal, at least in terms of some of the relevant indicators. Rising real interest rates in the form of TIPS yields in particular continue to be a big negative though. The biggest positive factor is undoubtedly the growing US federal deficit, but the market is unlikely to become concerned about it as long as GDP growth remains strong. Other than that, the main potentially positive development consists of the fact that the trends in many macroeconomic drivers are so stretched that they are probably quite close to a reversal. Here is the current situation in gold: |
Gold vs Gold-HUI, 2017-2018(see more posts on gold price, )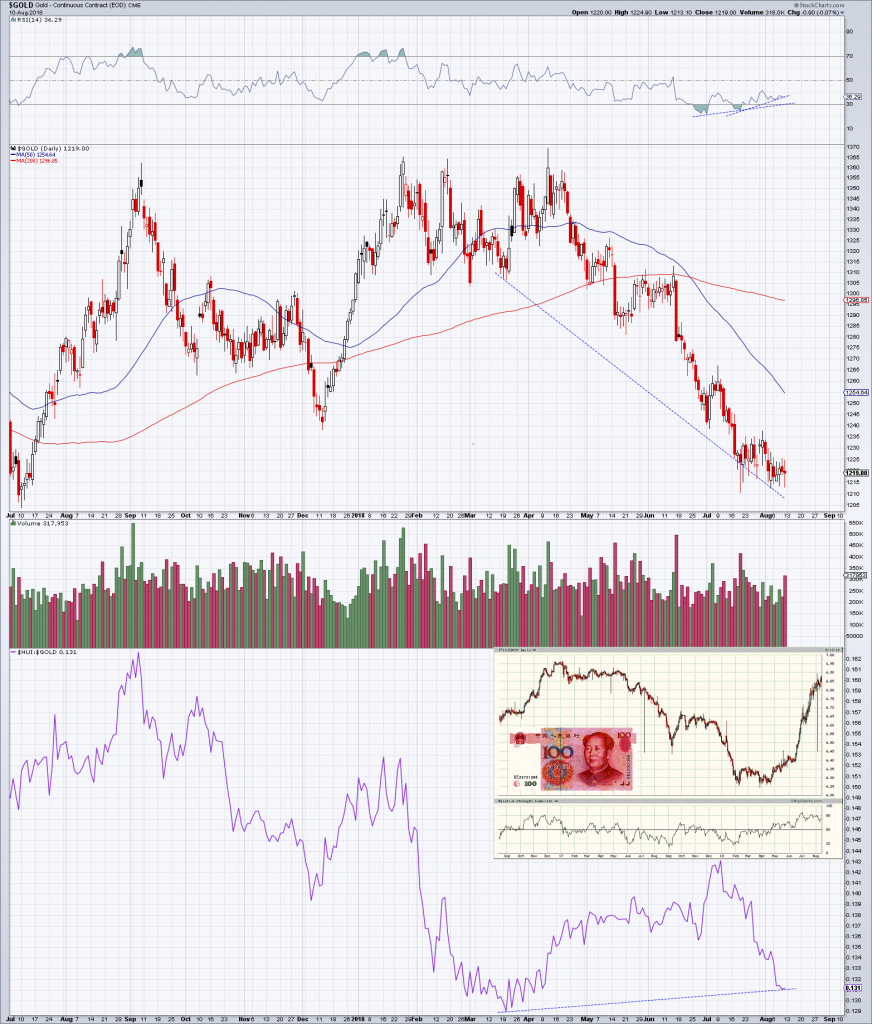 - Click to enlarge Gold – letting its inner Mao hang out (see insert of USD-CNY: recently the correlation between the yuan and gold has become extremely strong). The momentum of the downtrend in gold has slowed a bit, as reflected by the divergence between price and RSI and the HUI-gold ratio has not made a new low (yet) – not for lack of trying we might add. |
Bears GaloreWe previously thought market participants were looking beyond the gold-bearish macroeconomic backdrop to the inevitable eventual denouement of same, but it seems they were merely slow on the uptake. Now that they have noticed, they are expressing their new-found conviction with such gusto that one has to wonder if they are not way too late. Here is the positioning history of the “managed money” category as of last week’s commitments of traders report: Generally speculators are currently expressing great disdain for “safe havens” in the futures markets. Net speculative short positions in treasuries have reached new record highs as well. After all, why would anyone need a safe haven? In the stock market, FB and NFLX folded over after getting poked with the blunted momentum machete (according to rumors the same one the Earl of Shortsmoor used to decapitate the South Seas Company in 1722), but not even this two fifth compression of FAANG to AAG managed to seriously impress the party guests in Nasdaqville. Instead of going home, they called for refills. |
Managed Money category, 2014-2018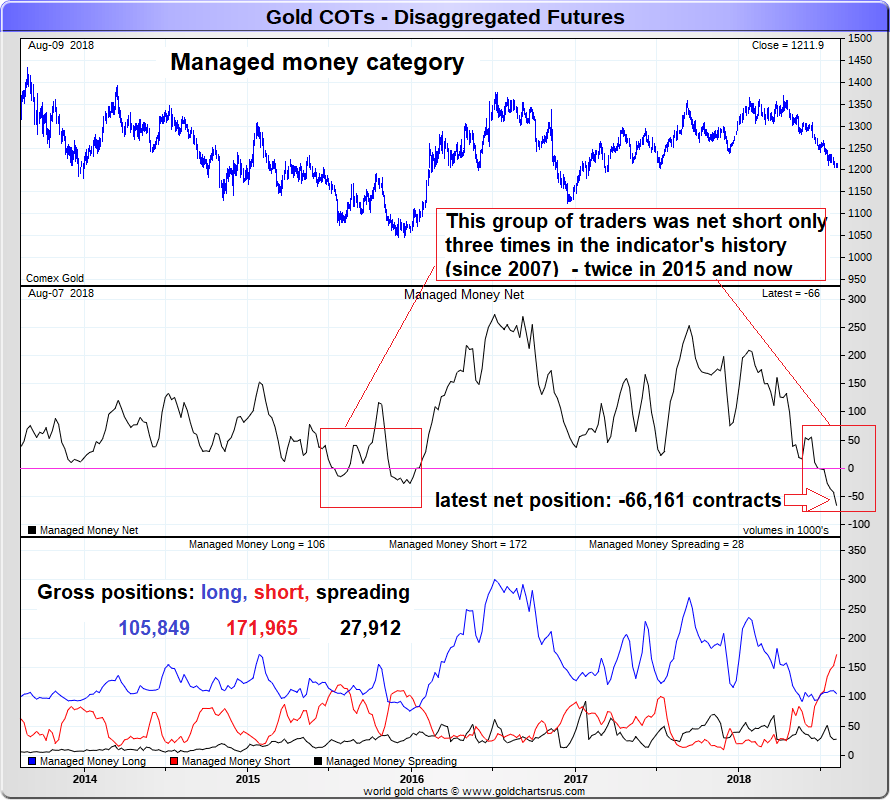 - Click to enlarge Managed money: the current net short position of more than 66,000 contracts is a record high for this group of traders. The second-highest net short position was recorded in December 2015, which was a bad time to increase shorts. It is noteworthy that the recent shift in the net position was mainly the result of new short-selling commitments. |
|
With respect to emerging markets, let us not forget that these are places no-one even finds on a map, so why worry? (As an aside, one of the reasons why North Korean governments were in the past often so nonchalant about violating various nuclear agreements with the US may have been that they expected their country not to be found). All that said, a large speculative net short position is not bullish per se as many people seem to assume. It only creates the potential for additional buying if and when the trend changes. Speculators are as a rule well-aligned with trends in the gold market, they only tend to be wrong at extremes. A durable rally can only develop if the trend in fundamentals becomes supportive as well. 5-year TIPS as a proxy for real interest rates illustrate this: Current speculative positioning and sentiment have probably become extreme enough to trigger at the very least a short term recovery. Of course, every long term trend change begins in this manner, namely with a short term recovery from oversold conditions. Often this starts before fundamental conditions visibly change, but there are also historical examples of lags. |
5-year TIPS yield, 2014-2018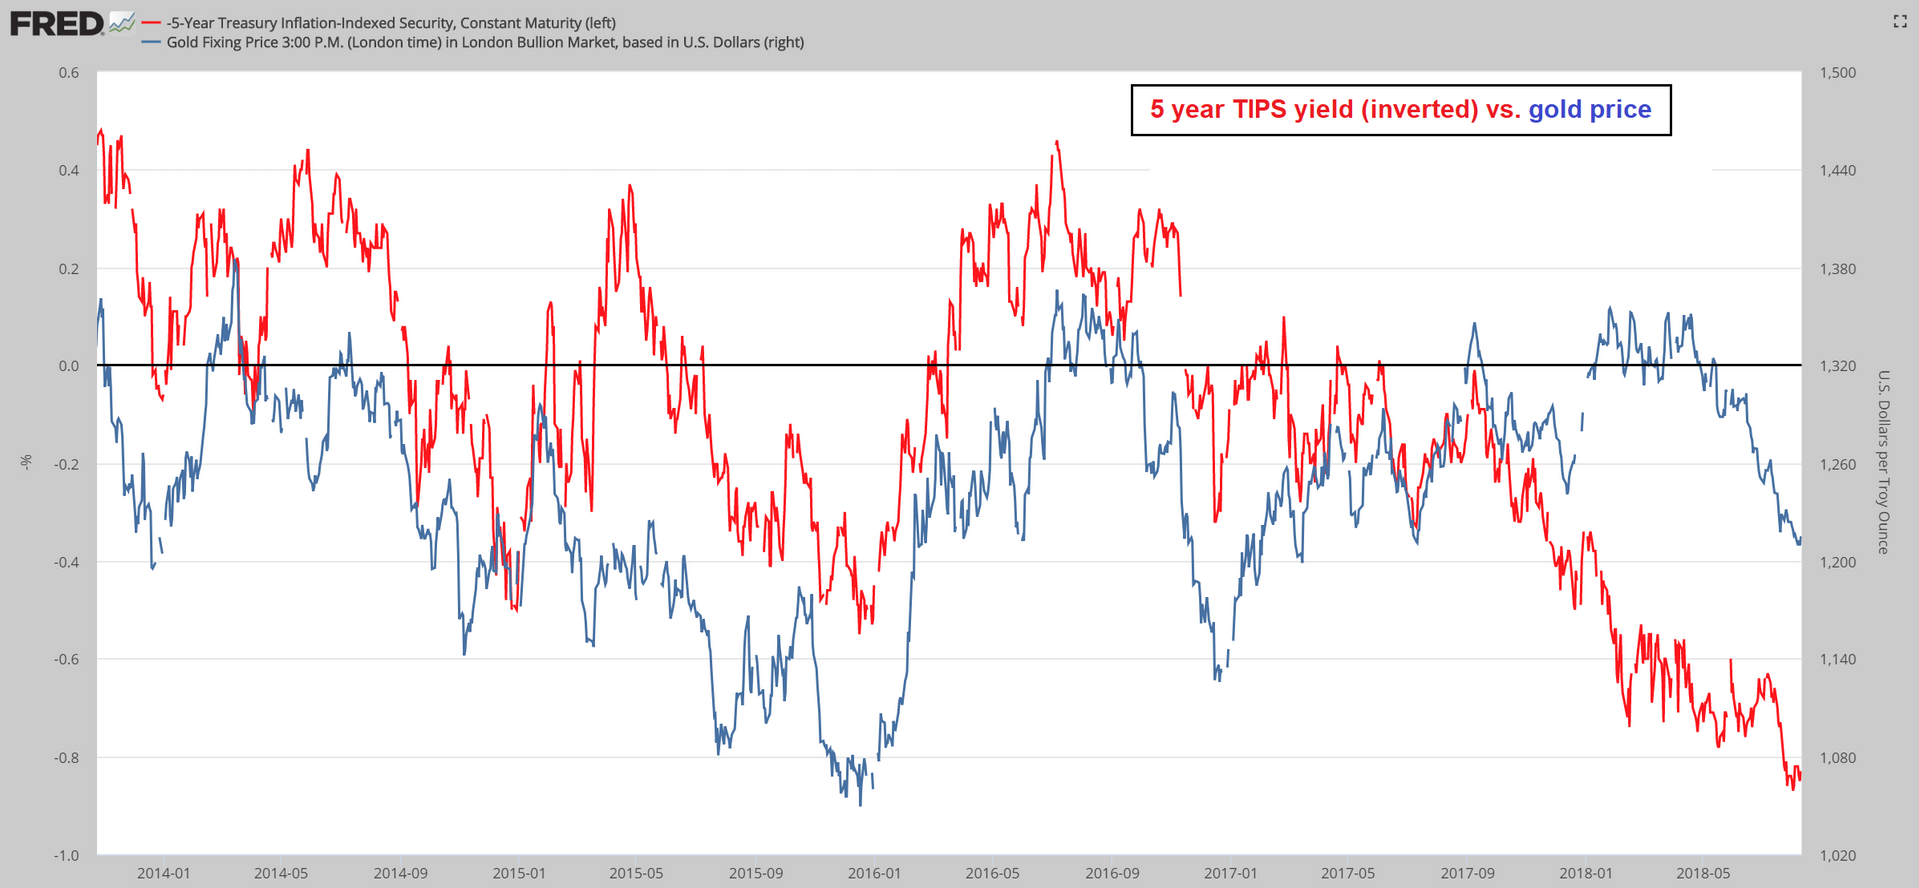 - Click to enlarge 5-year TIPS yield (inverted – note: the scale on the left hand side has to be multiplied by -1 to make sense) vs. the gold price. Most of the time TIPS yields are a coincidental indicator of the gold price, but occasionally there are small leads and lags. Up until recently gold was actually more likely to slightly lead. Note the late 2015 low in gold prices – as soon as the rally started, TIPS yields started to decline as well. |
Gloom Dispelling Signal with PotentialIs there a reason to expect fundamental conditions to become more favorable for gold (and other safe haven type instruments)? These fundamental drivers include various indicators of economic confidence and inflation expectations – to briefly recapitulate, the most important one are: Credit spreads, the steepness of the yield curve, the trend in commodity prices, the relative strength of bank stocks (faith in systemic solvency), the trend in “risk assets”, real interest rates, the trend in the USD, money supply growth (and related expectations), the demand for money (i.e., the desire to increase or decrease savings and cash balances), faith in the monetary authority and government in general, and growth of the federal deficit. At present some of these indicators already look supportive, but most don’t – at least not yet. Which of them the market decides to focus on in a given situation depends on contingent circumstances. For example, a strong dollar did not keep the gold price from rallying during the euro area debt crisis. It is clear though that economic confidence is currently very high, so the question is whether there are any hints that this could change. This is where our “obscure” indicator comes in. We have spoken about this phenomenon in the past, but we have now found a better way of charting it. Below is a daily chart of the JSE Gold Mining Index, i.e., an index that shows the performance of South African gold mining companies in local currency terms. |
Gold Mining Index, Feb-Aug 2018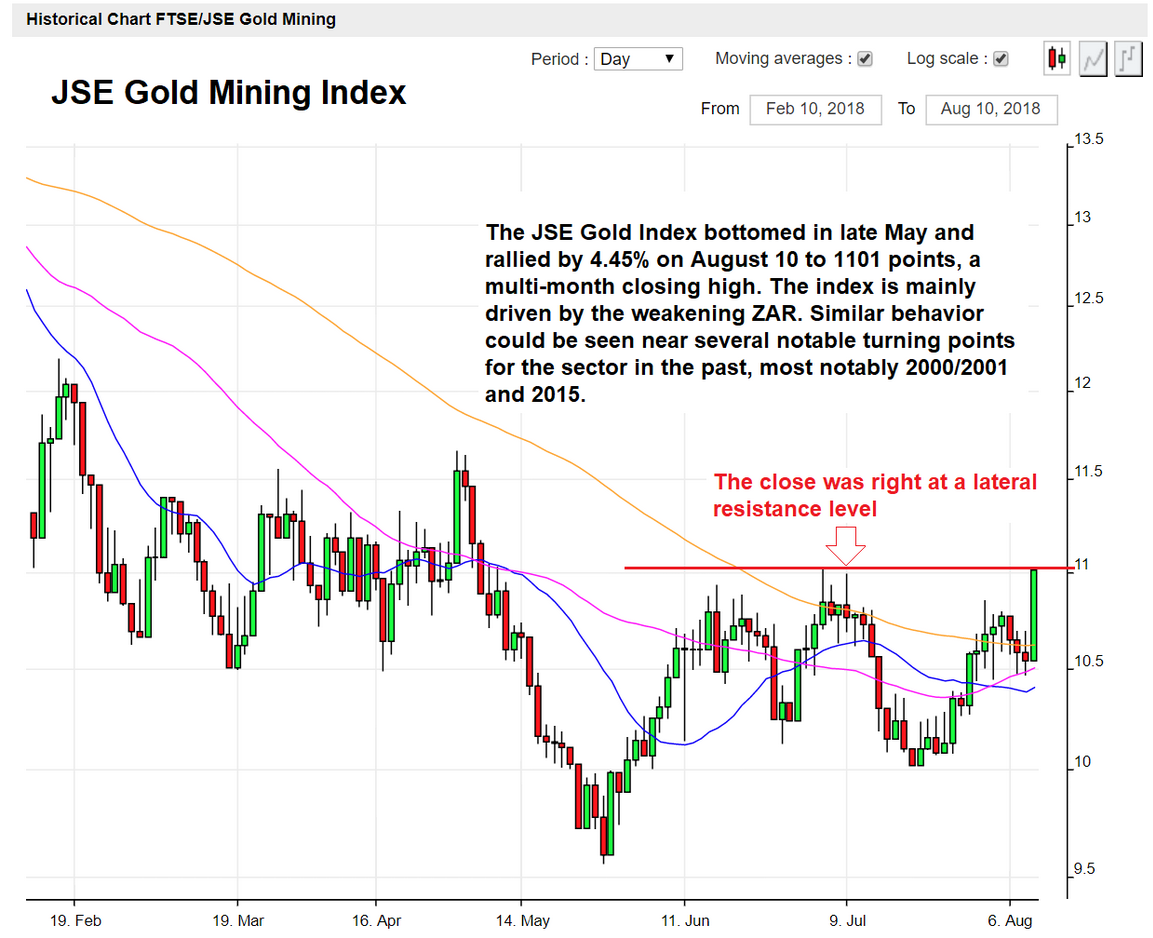 - Click to enlarge Gold mining firms are considered “rand hedge stocks” in South Africa. When the rand weakens, companies which obtain their entire revenue in US dollars (while their costs are denominated in rand) will enjoy at least a short term boost to their margins, and their main assets become more valuable in local currency terms. While gold sector indexes such as the XAU and HUI in the US have continued to weaken in recent months and weeks, the JSE gold index bottomed in late May already and has since then rallied to a new multi-month high. It may well lose some ground in the near term since it has just bumped into lateral resistance, but last Friday it delivered a very strong 4.45% rally solely driven by the weakening rand. |
|
The spreading rout in emerging market currencies and asset markets is mirrored by the action in the JSE gold mining index. Note that the index has bottomed quite some time ago and has strengthened rather noticeably in the meantime – it is up around 15.3% from its May 29 closing low. Up until recently there was much talk about a “globally synchronized upswing”, which has evidently become a lot less synchronized. Since the US and the EU have very large internal markets, they will usually demonstrate resilience to turmoil in emerging markets – especially in its early stages and as long as it is held to be “contained”. In fact, a reversal of capital flows from emerging markets to developed markets will initially not only strengthen developed currencies (especially the USD), but also support developed financial markets. Assuming that the trouble in emerging markets is a symptom of a global boom that is beginning to fray, this support will not be sustainable. The weakest links in the chain are simply the first to break and the rot is likely to eventually spread inward from there.
|
MSCI emerging market currency index, daily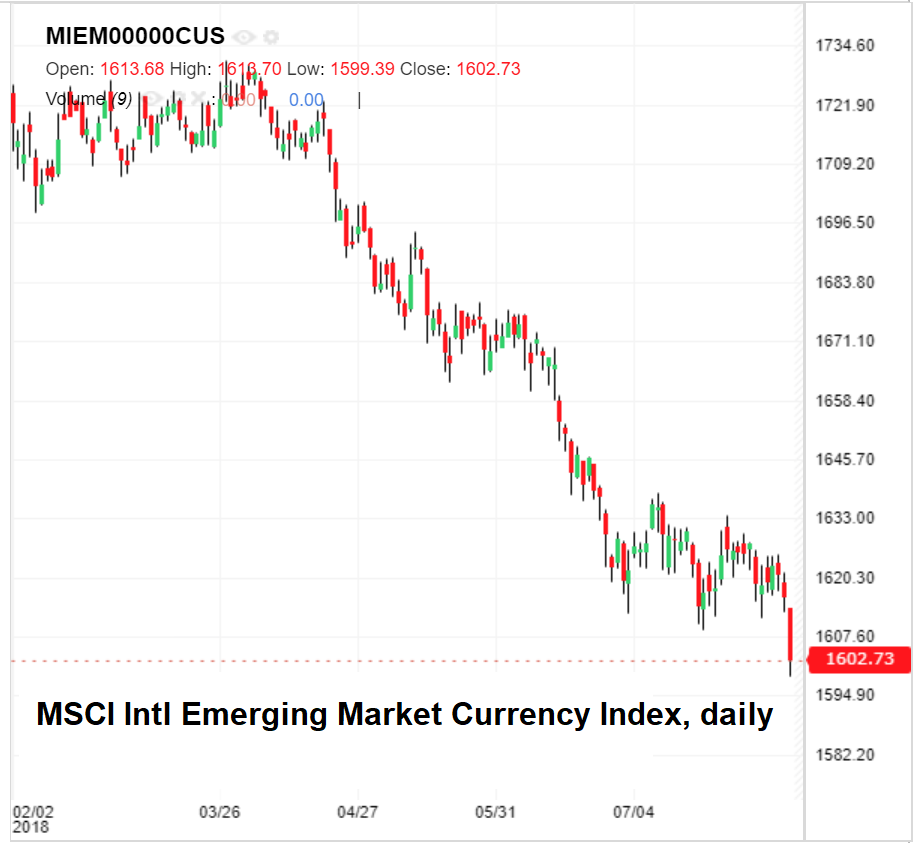 - Click to enlarge MSCI emerging market currency index: the Turkish lira is definitely not the only EM currency under pressure. |
|
Historically we have observed similar situations several times. Memorable examples occurred in 2000/2001, when the rand cratered in the months before the gold sector began to enter a long term bull market, and more recently in late 2015, when the rand started to slide and South African gold stocks once again bottomed months before US and Canadian gold stock indexes did. Note that the rand is particularly interesting in this context for two reasons: 1. South Africa remains a major gold producing country, so there is a fairly sizable gold sector one can watch, and 2. the rand is quite popular as a hedge for emerging market currency exposure in general, as it is quite liquid and the South African Reserve Bank steadfastly refrains from intervening in foreign exchange markets. |
South African Rand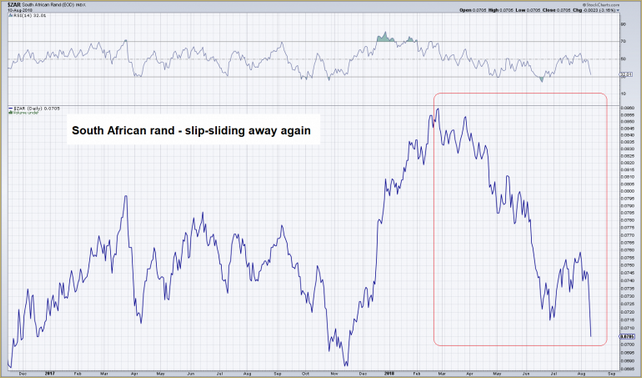 South African Rand – slip-sliding away. - Click to enlarge |
Conclusion
It is of course never certain that things will play out similar to the way they have played out historically – but in broad strokes they often do. The growing divergence between “rand hedge” gold stocks and USD denominated gold stocks could well be a heads-up that a medium to long term trend change for the sector is in the cards and not just a short covering bounce (medium term = several months such as in H1 2016, long term = several years).
We plan to keep a close eye on this indicator and the fundamental drivers listed above and will continue to provide updates whenever noteworthy developments on these fronts occur.
Charts by: StockCharts, BigCharts, ShareLynx, St. Louis Fed, 4-traders.com, investing.com
Full story here Are you the author?
Tags: Chart Update,gold price,newsletter,Precious Metals