Pater Tenebrarum
My articles My siteAbout meMy videosMy books
Follow on:TwitterSeeking AlphaFacebook
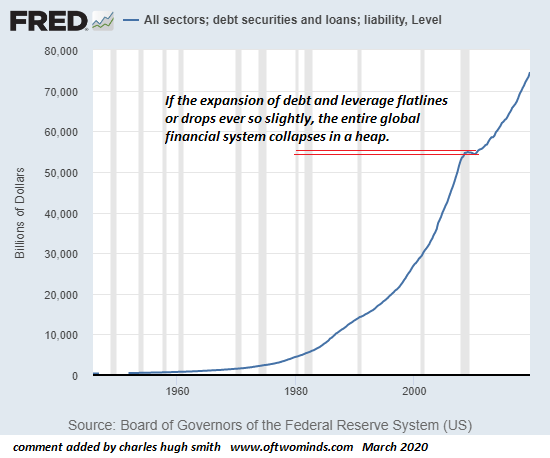
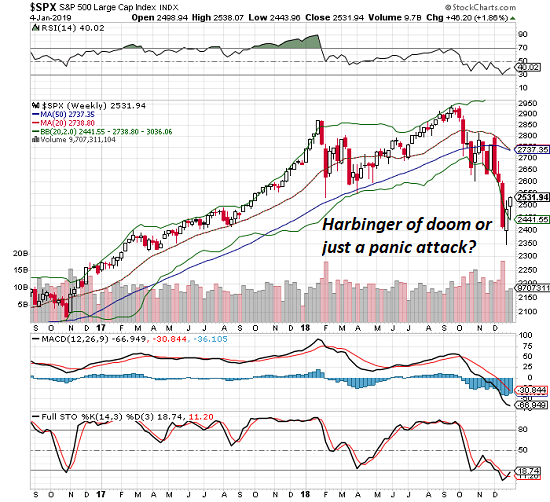
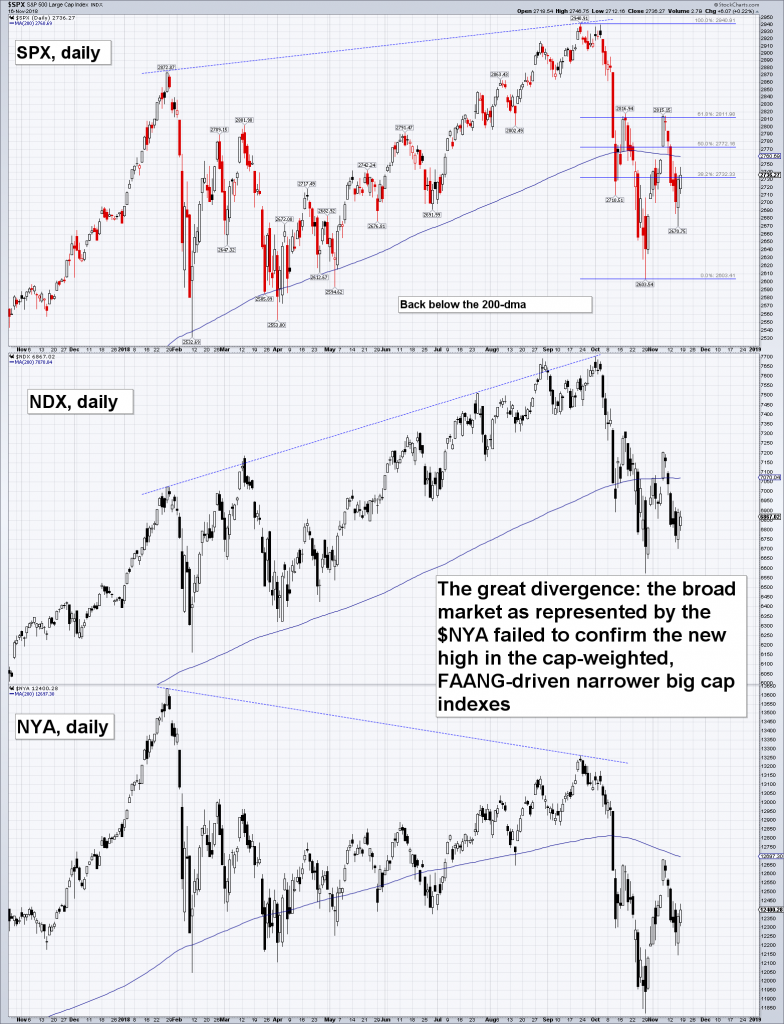
Divergences Continue to Send Warning SignalsThe chart formation built in the course of the early February sell-off and subsequent rebound continues to look ominous, so we are closely watching the proceedings. There are now numerous new divergences in place that clearly represent a major warning signal for the stock market. For example, here is a chart comparing the SPX to the NDX (Nasdaq 100 Index) and the broad-based NYA (NYSE Composite Index).
|
US S&P 500 Large Cap Index, NDX Daily and NYA Daily, Mar 2017 - 2018(see more posts on S&P 500 Large Cap Index, )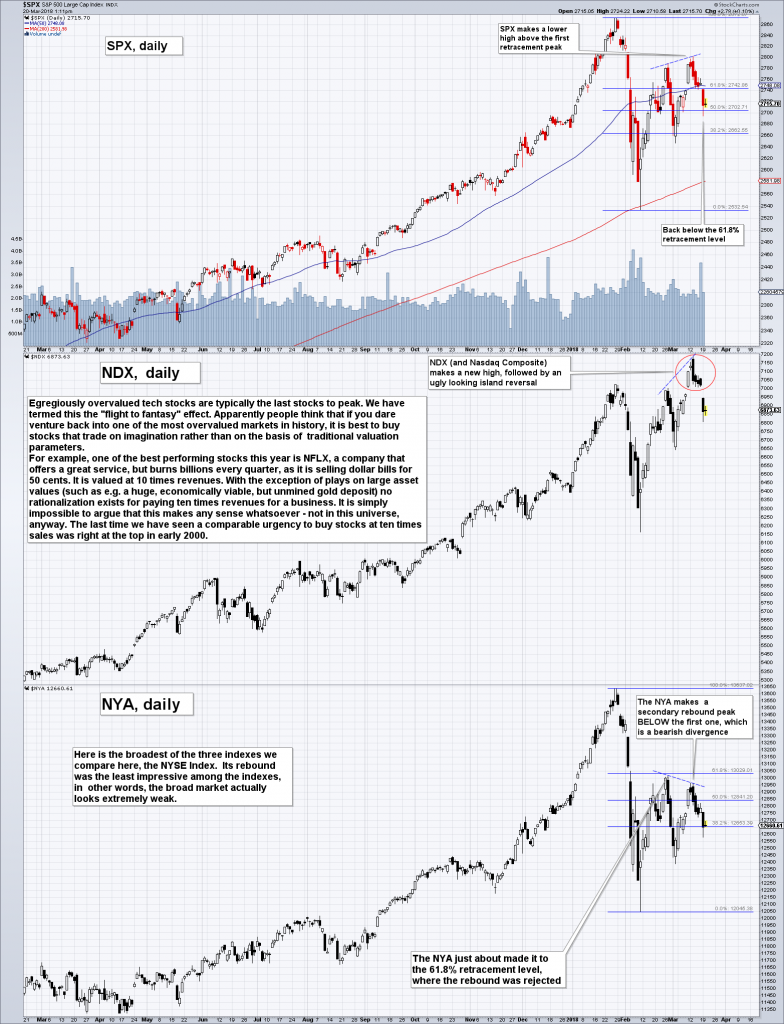 The tech sector is always the last one to get the memo – we have dubbed this the “flight to fantasy” – and it is always seen near major market peaks. - Click to enlarge Incidentally, the Nasdaq was the last index to peak in 1987 as well (the DJIA topped out in late August of that year, the Nasdaq on October 5). So this is a well-worn tradition. The divergences that have been established between these indexes in the recent rebound from the early February are a big red flag in our opinion. |
The Urge to Burn MoneyAs mentioned in the annotations on the chart above, investors are now paying 10 times revenues for more stocks than at any time since early 2000. We discovered the following gem via Jesse Felder’s latest report (well worth reading in its entirety). A few years after the peak of the tech mania, former Sun Microsystems CEO Scott McNealy was interviewed by Bloomberg. He said the following about Sun’s peak valuation in 2000 (it was one of the stocks trading at more than ten times sales at the time):
(emphasis added) The answer is of course that nobody did much thinking at the time – and the same is evident recently as well. Also via Mr. Felder, here is a chart that shows the number of S&P 500 companies trading at 10 times revenues over time – currently there are 28 such stocks; at the peak of the mania in 2000 there were 36 (for a very brief moment). It is quite ironic that companies trading at such lofty multiples are often characterized by the ability to burn cash at astonishing rates. For example, the above mentioned NFLX – which is a great company with great subscriber growth rates – reported free cash flows of a negative $2 billion last year and plans to burn through $3 to $4 billion in the current year. However, to paraphrase Mr. McNealy, what are people who pay ten times revenues for the stock thinking? That there will be some luxury miracle? Hint: there won’t be; investors are going to see their money burn as well, even under the most generous assumptions about the undoubtedly glorious future. |
Number of S&P 500 Stocks Trading Over 10x Revenues, Jan 2000 - 2018(see more posts on S&P 500 Index, )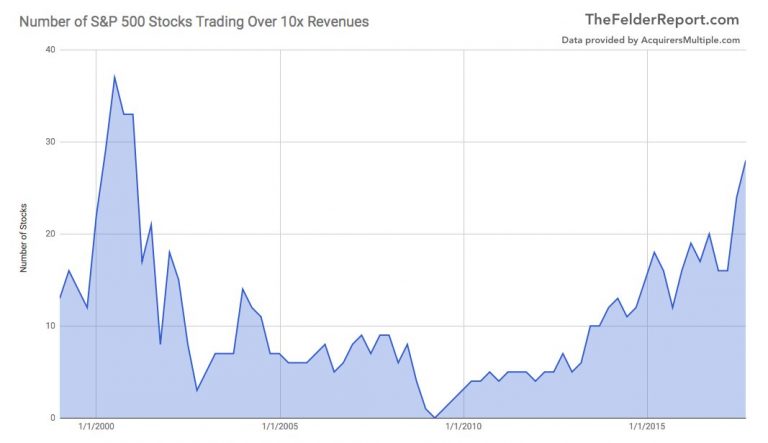 The number of S&P 500 stocks trading at ten times revenues: “investors” are going crazy again. - Click to enlarge |
Investors Tripping Over Each Other to Get InRemember when bitcoin exchanges could no longer keep up with all the new customers trying to open accounts? That happened in the two months before BTC peaked – it has since then declined by 55% (and was down by 70% at one point). Guess what happened in terms of equity fund inflows over the past several months. |
Stock Funds Focused on Technology and Epic Tech Inflows, 1995 - 2018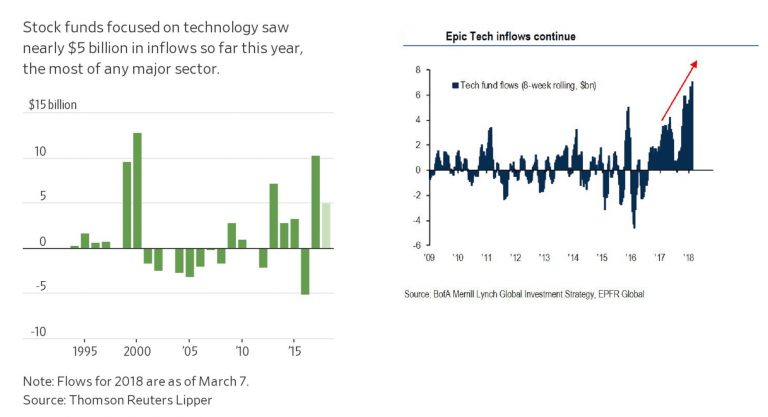 Inflows into technology equity funds – left hand side, annual flows (in 2018 until March 07 they reached $5 billion, which as far as know is a record for such a short time); right hand side, 8-week rolling flows into tech funds, which shows the recent massive acceleration in inflows in greater detail. - Click to enlarge They sure love them when they’re expensive. Tech company CEOs are probably happy, since they are selling hand over fist (admittedly, they almost always do – it rarely happens that insiders at these firms do anything else, sincea lot of their compensation comes in the form of stock options). |
| For some reason investors tend to fall in love with tech stocks as soon as they are outrageously expensive. They don’t want to have anything to do with them when they are on sale (which happens rarely enough). The main point is though that whenever investors are getting this impatient to buy something that has gone up in price for many years, it is high time to get out of Dodge, because a financial accident is usually just around the corner. Plot twist: it’s not going to be different this time.
It is also noteworthy that the market rally has become ever more concentrated in a handful of names. There are two reasons for this: 1. diminishing liquidity – it is no longer possible for the tide to lift all boats (this is also the message sent by the divergences in the first chart and by the market’s weak internals) and 2. the popularity of passive investing tends to boost the market caps of stocks that already sport the largest market caps, as new inflows into ETFs are invested according to the weightings of stocks in the underlying indexes. Obviously, this investment technique involves no analysis of the merits of buying these stocks at current levels. The following chart shows the proportion of the Nasdaq represented by the market cap of just five stocks (the FAANG stocks, i.e., Facebook, Amazon, Apple, Netflix and Google): |
Combined Market Cap of Facebook, Amazon, Netflix, Alphabet and Apple as Proportion of Nasdaq, 2015 - 2018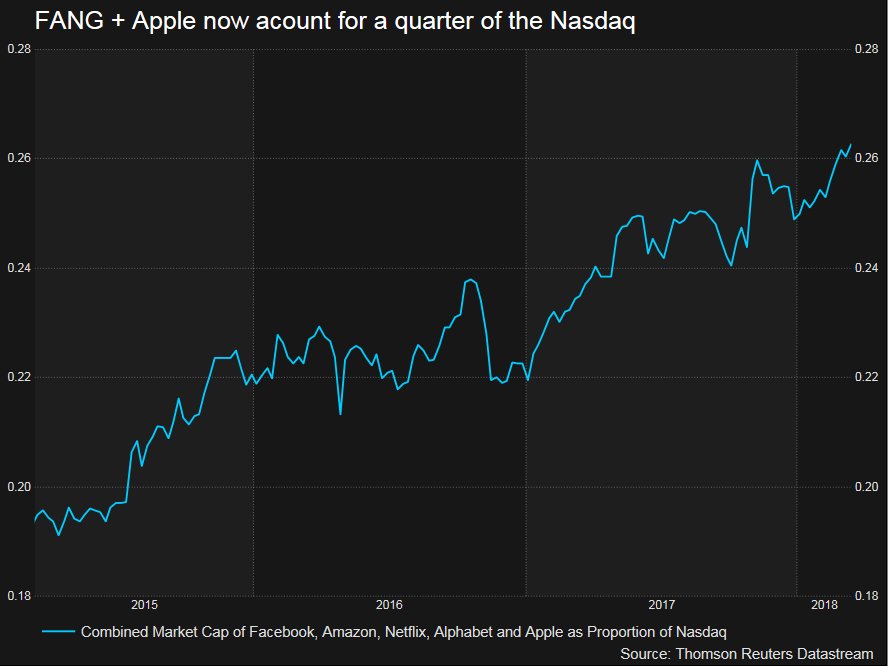 The combined market cap of the FAANG stocks represents 26% of the total Nasdaq by now. This is traditionally also a major warning sign. - Click to enlarge |
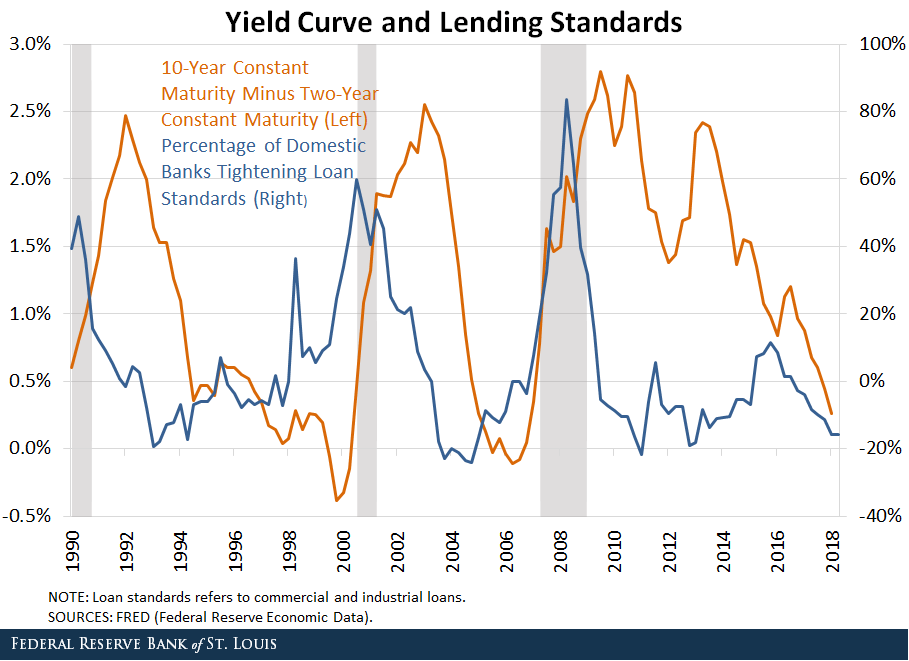
Conclusion:The stock market remains in dangerous waters just as the next rate hike approaches. At such junctures one should keep in mind that it is actually irrelevant whether the economy is doing well, or “forward” earnings estimates are strong, or confidence is high, and so forth. These data points always look great near market tops and conversely look awful near major lows. The decisive factors for the stock market are liquidity (i.e., money supply growth rates, which have collapsed), valuations (extremely high valuations will eventually be corrected, often violently) and market internals & technical divergences (which are a reflection of liquidity and risk appetites). With respect to the latter, here is an updated chart of the comparison of US and European stocks we frequently show in these pages. The bearish long term divergence between these markets has now been rounded out with a series of bearish short-term divergences: |
S&P 500 Large Cap Index and Euro-Stoxx 600 Daily, Apr 2016 - 2018(see more posts on S&P 500 Large Cap Index, )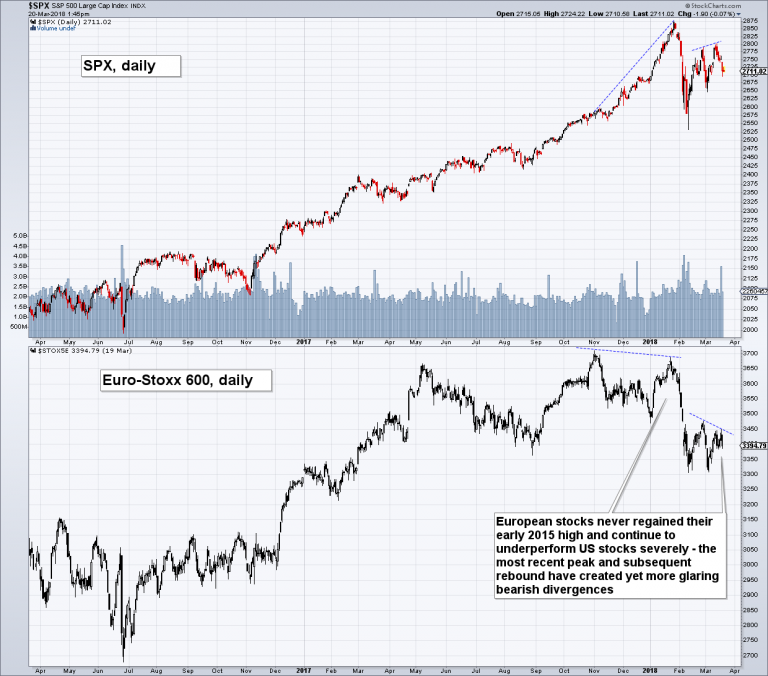 Since the Euro-Stoxx index has never regained its 2015 peak, there are now both long term and short term bearish divergences in place vs. the US stock market. - Click to enlarge |
Full story here Are you the author?
Tags: newslettersent,S&P 500 Index,S&P 500 Large Cap Index,The Stock Market