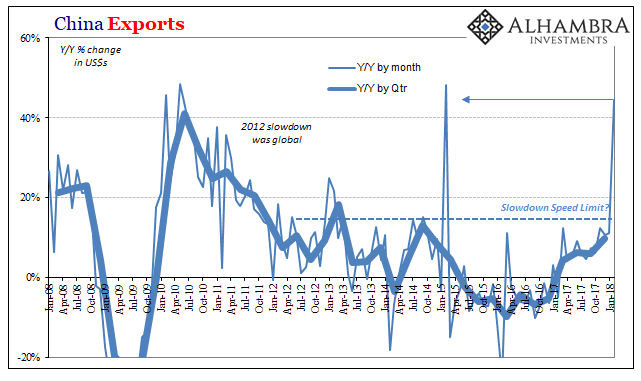
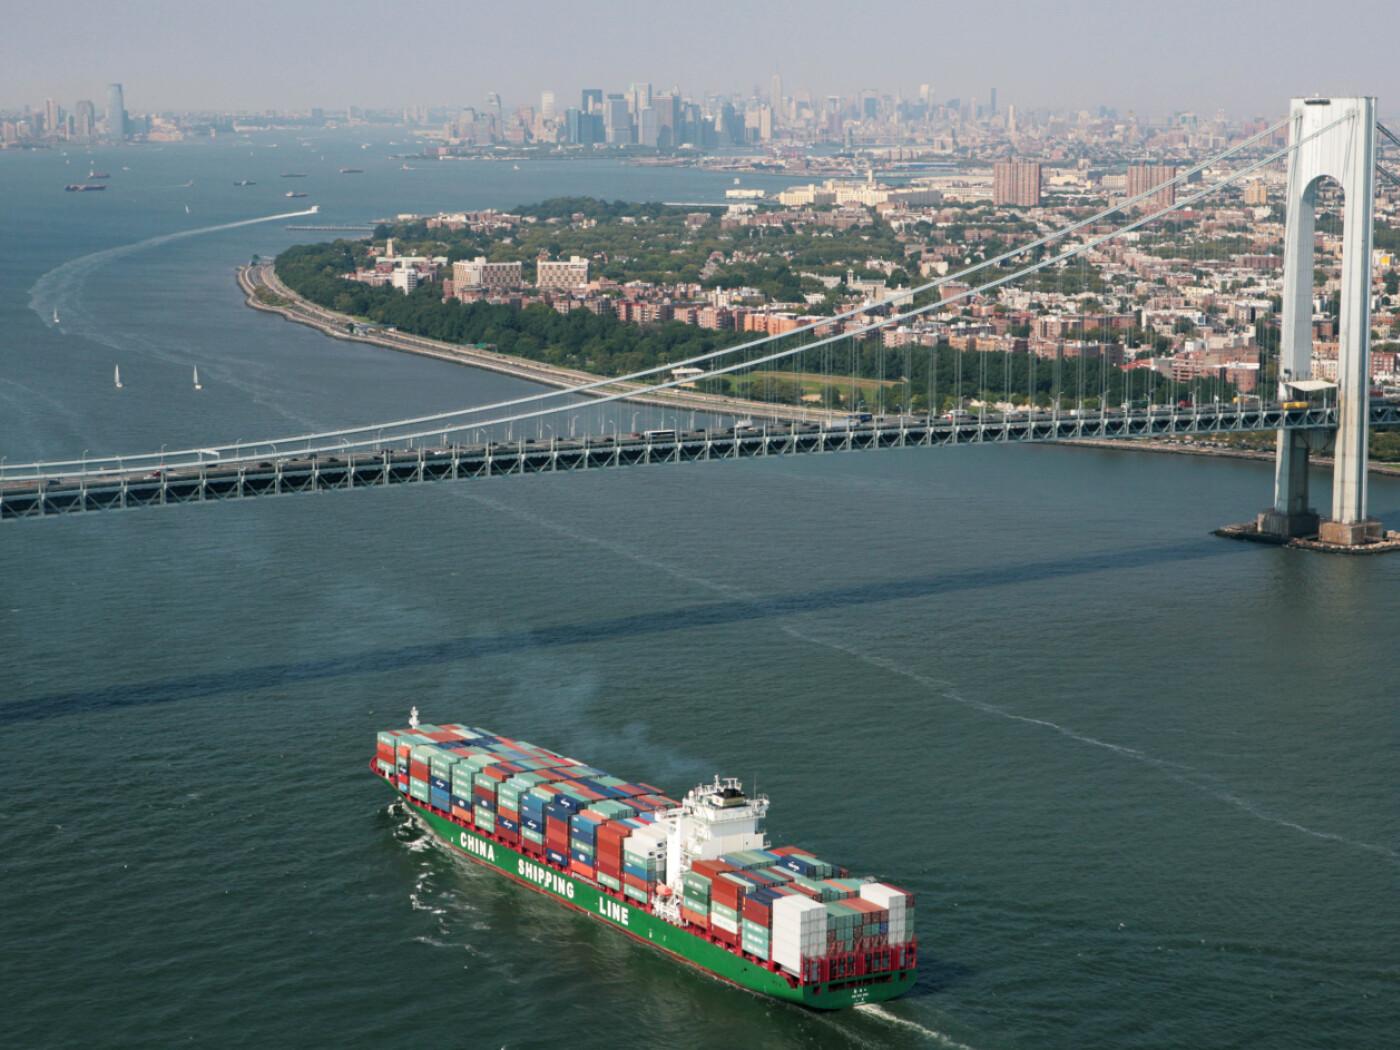
China’s General Administration of Customs reported that Chinese exports to all other countries were in February 2018 an incredible 44.5% more than they were in February 2017. Such a massive growth rate coming now has served to intensify the economic boom narrative.
A strengthening U.S. recovery is helping underpin China’s outlook as Asia’s biggest economy seeks to cut excess capacity and transition to reliance on domestic consumption rather than debt-fueled infrastructure spending.
The article quoted here, however, was referring instead to the 48.3% gain in exports China Customs recorded for February 2015. That clearly out of whack increase, like this latest one, was a pure outlier. It wasn’t treated that way, of course. Depending upon it for interpreting the direction of the Chinese and global economy was a mistake; the US headed further into a downturn that China hasn’t yet recovered from.
What happened in February 2018?
| At this point, it’s impossible to determine. The easy answer would be to attribute it to President Trump’s trade and tariff threats. The administration has been talking about them seriously since the end of last year. It would be naïve to assume Chinese exporters haven’t been in a rush to push product overseas to get ahead of any possible interference.
The Custom’s data, however, show a pretty broad spread over the various major export destinations for Chinese goods. Exports to just the United States did spike by 46% and therefore do suggest this is a valid if perhaps partial explanation. We might expect exports to jump if at lesser rates to other locations for the same reason. It is still possible that Chinese firms are calculating for European and other countermoves against not just US tariffs, concerns about protectionism in general as trade becomes a global target this year for the first time. |
China Exports, Jan 2008 - Jan 2018(see more posts on China Exports, ) |
|
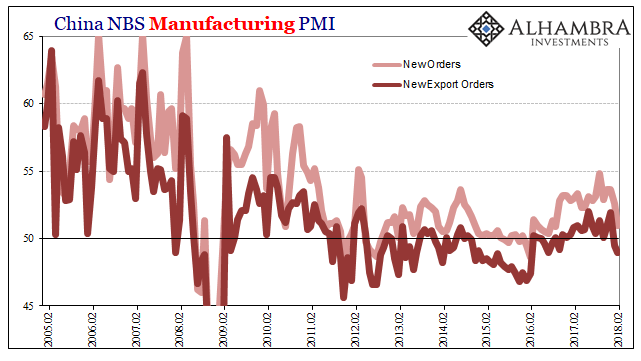
That may be why the subcomponent for new export orders attached to the official manufacturing PMI was rising to the end of last year, and then dropped below 50 for both January and February. It would seem, by these figures, anyway, Chinese factories were a little busier than they had been for the export business, but with orders now falling they may not be going forward. |
China Manufacturing PMI New Orders,. Feb 2005 - Feb 2018(see more posts on China Manufacturing PMI, ) |
| In addition, this time of year with China’s Golden Week (and its late arrival in 2018), data and even real activity can be heavily distorted. It’s common for export firms to push as much product out of the country ahead of the holiday, and then do significantly less afterward. Since 2017’s New Year fell at the end of January, February 2017 was on the downside of the trend – compared this year to February 2018 that was for the first half of the month in the heaviest upswing part.
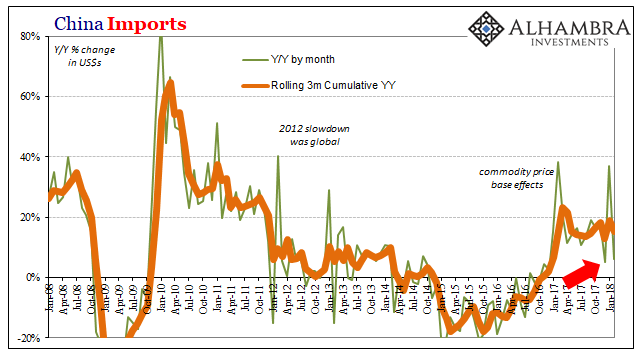
Holiday distortions on the import side might be instructive in this regard. For January 2018 alone, the Customs Bureau estimated a surge of inbound Chinese trade (which was equally celebrated, if not more so). Imports rose nearly 37% year-over-year. In December, imports had been up only 5%. Now in February 2018, they gained just 6.3%. On a rolling 3-month basis, despite the big leap in January there really isn’t much change at all in China’s import tendencies, or economic demand. That was clearly a one-month distortion that in accounting for it that way shows China’s economy stuck in the same 2017 low levels. No acceleration is projected; worse, the tendency is instead toward lower rather than higher import activity. |
China Imports Rolling, Jan 2008 - Jan 2018(see more posts on China Imports, ) |
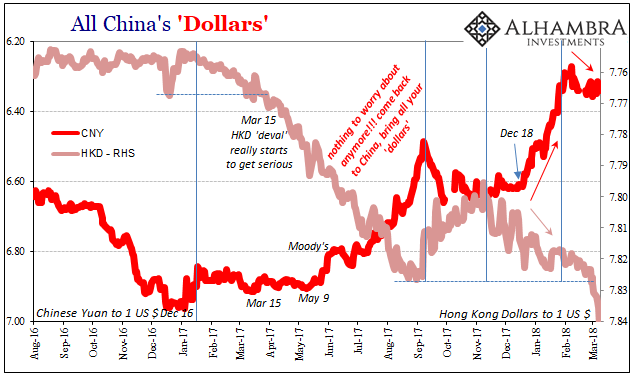
| There is one other factor to consider for the export side outlier: the dollar. CNY is up against it in exchange value, meaning that in dollar terms Chinese exports are more valuable on that basis. When compared to February 2017 before CNY had yet to make its big move(s), it adds to the plus side in 2018. In RMB terms, though, Chinese exports were 36.2%.
But the dollar end of China trade also proposes the possibility of not just distortion but outright fraud. It had by later 2014 become an almost regular occurrence to where China would “export” fake goods into Hong Kong using fake invoices so as to import instead US rather than Hong Kong dollars. I wrote about it in October 2014:
CNY was at that moment rising, too. It had initially fallen until the middle of that year, and then reversed course in some correlation with Hong Kong invoicing empty mainland exports. Whether or not that is occurring now is difficult to determine; largely because despite spending two days looking I haven’t been able to find estimates for February 2018 Hong Kong exports in any of the usual places; nor have they been reported by any media outlets. Hong Kong is China’s second largest export market after the US, often as the first stop on route to other places further outside the mainland. |
USD/CNY, Aug 2016 - Mar 2018(see more posts on USD/CNY, ) |
With HKD on the move lower, starting toward the end of January, there’s every indication of heavy “dollar” movement out of the city and into China, likely via a variety of methods.
If there was ever a questionable 40+% increase in any nation’s exports, let alone China’s, this is (another) one.
Full story here Are you the author? Previous post See more for Next postTags: $CNY,China,China Exports,China Imports,China Manufacturing PMI,currencies,dollar,economy,EuroDollar,exports,Federal Reserve/Monetary Policy,global trade,hkd,Hong Kong,imports,Markets,newslettersent,tariffs,USD-CNY


