There’s something happening here
What it is ain’t exactly clear
There’s a man with a gun over there
Telling me I got to bewareI think it’s time we stop, children, what’s that sound
Everybody look what’s going downThere’s battle lines being drawn
Nobody’s right if everybody’s wrong
Young people speaking their minds
Getting so much resistance from behindIt’s time we stop, hey, what’s that sound
Everybody look what’s going down
For What It’s Worth, Stephen Stills and Buffalo Springfield
I’ve thought a lot about that song recently. A friend of mine also used it in a blog post recently so I guess I’m not alone. It isn’t just the economic and market situation that has me humming this song though. There’s been a lot of attention on the young people from down here in Parkland, some of it good, some of it bad (although frankly I’m not sure I understand adults criticizing these kids).
Forget the content for a moment; they are traumatized and deserve their time of mourning however they choose to do it. And yes some of them probably like the attention a little too much. And yes, some politicians are happy to exploit them for their own purposes. But these young people, who have managed to organize and bring attention to an issue on which they have a unique perspective, deserve our respect. They have been more articulate than the vast majority of what passes recently for political debate in this country. They have produced thoughtful proposals that enjoy pretty wide public support and would probably pass Constitutional muster. One can’t help but compare them to the political mud wrestling that passes for debate among our elected representatives. I just hope they don’t lose interest and faith in the unique system that is our country when things don’t work out the way the want or as fast as they hope. And more than anything I hope that when this song is 100 years old that it doesn’t sound as current, as topical, as it does today at 50.
Enough of the political commentary and on to what has me scratching my head in the economic arena. Over the last two weeks we got some pretty decent economic data. Not uniformly good but certainly enough that it was noticeable. Industrial production and durable goods orders in particular stand out. But existing home sales also improved and sentiment is ebullient across the board. Job openings surged, up nearly 16% year over year and the inflation readings moderated.
There were some worrisome reports as well, retail sales most prominently but the new home market also put up some weak numbers. Even in the case of the strong reports there may have been some mitigating circumstances. In durable goods for instance, we see a large increase in primary metals which could certainly be companies trying to get ahead of the tariffs we all feared were coming. So maybe that artificially inflated the numbers last month. But overall, the economy looks about as sound as it has in this admittedly lackluster expansion. So, why then didn’t the bond markets react to this “strong” data? As discussed below, bonds are still in the same range they’ve been in since mid-2013. The top end of the range yes but in the range nonetheless. And credit spreads widened during that time, not something we associate with positive economic developments.
So, as the song says, there’s something happening here but what it is isn’t exactly clear. Is the economy peaking? Are sentiment readings so high they have nowhere to go but down? Is the uptrend in durable goods orders since mid-2016 sustainable? Are we breaking out of the doldrums or is this another false dawn? The data leans a bit toward the former while the market leans a little more to the latter. I think you know which we think is more likely to be right.
Economic Reports
Economic Growth & Investment
The latest industrial production report was much better than expected and positive on multiple levels. Overall production was up 1.1% while the manufacturing component was up 1.2%. Probably more importantly, the improvement in manufacturing was centered on business equipment. One thing I’ve been hoping to see is less reliance on the oil sector and we see some signs of that in this report. Yes, mining (oil extraction) was up 4.3% but that was offset by a 4.7% drop in utility output. What’s left is a pretty clear positive for manufacturing and hope for business investment. These numbers do tend to be volatile though and it should be noted that last month’s numbers were revised down significantly.
Existing home sales also showed some life, up 3% on the month and now a positive 1.1% year over year. We’re even starting to see total inventory rise some, up 4.6% on the month although on a sales basis supply was unchanged at 3.4 months. Inventory has been a problem for a lot of this cycle but higher prices may finally be pulling in some sellers.
The leading economic indicators reflect this improving data coming in at 0.6% on the although last month was revised lower from 1.0 to 0.8%. Overall though I think this points to an economy that has improved but only somewhat. These reports are solid and certainly moving in the right direction but nothing here points to a large acceleration in growth. That is confirmed by our market indicators, reviewed below.
Production
Only two reports in this section over the last two weeks. The Empire State and Philly Fed reports were both quite positive with new orders and backlog both up significantly. Also of note, both reports showed rising cost pressures. Remember these are basically sentiment reports and have little forward looking value; they are snapshot of how companies think things are right now.
Consumption & Distribution
It is great to see manufacturing picking up per the industrial production report noted above, but at some point, you have to sell the stuff you manufacture. Retail sales shows that, at least so far, that isn’t happening. Or I guess not happening to the degree we’d all like to see. Retail sales ex-autos and gas were up but less than expected. Overall, retail sales are still tracking at less than a 4% year over year growth rate which sounds okay but compared to history is really not. In past expansions, 4% was the low end of growth while in this expansion it has mostly been the high end. Within the report, department stores and motor vehicles were the losers, both down 0.9%. The winners were non-store retailers (internet) and building materials.
Inventories
Reflecting that weak retail sales environment, business inventories rose 0.6% in January with rises at both the wholesale and retail levels. Unfortunately, total sales were down 0.2% and the inventory/sales ratio rose a tick to 1.34. I can’t call it a trend yet but that may be turning higher again.
Orders
The industrial rebound seems to be confirmed by the durable goods orders, reported at up 3.1% in February, a major improvement over January. Ex-Transportation orders were also positive, up 1.2%. Even better were core capital goods orders up 1.8%. One note of caution though is that primary metals were a big part of the upside surprise. That may have been companies stocking up before the Trump administration imposed tariffs on aluminum and steel. If so, this strength may wane quickly.
Inflation
Prices at the consumer and producer levels cooled in February. While headline CPI is running slightly over 2%, the core rate is still at just 1.8%. Producer prices are running a little hotter at 2.8% and 2.5% year over year for headline and core respectively. Import and export prices were hotter still at +3.5% and +3.3% respectively. Those figures are no doubt more heavily influenced by the weaker dollar than CPI and PPI.
As I said last month though, if you want to see inflation, you need look no further than house prices. The FHFA house price index accelerated in January, up 0.8% for the month and 7.3% year over year. I suppose that makes some sense with existing home sales finally perking up and especially with lean inventories. Is the Fed behind the curve? Is the Pope Argentinian?
Employment
Job openings surged in January, up nearly 700,000 over the December level that was revised lower. And that is noteworthy by the way, as these numbers are extremely – and I mean extremely – volatile. If this holds up to revisions it might mean something but right now it just looks like an outlier. Especially when we look at Quits and Hires which were down slightly and up very slightly on the month. The quits number in particular is interesting as we would expect to see quits rising with so many alleged job openings. For now, I’m putting this in the “yeah, right” category but I’d be happy to report next month that the surge was real.
Construction
The real estate picture is a bit more mixed on the new home side. Housing starts were down sharply for the month and are now down over 4% year over year. Single family starts were up 2.9% but that was overwhelmed by a 26.1% drop in multi-family starts. The drop in MF starts is potentially explained by another number in the report – multi-family completions were up 19.4%. It might make sense to see a lull after so much new supply has come to the market over the last few years. Permits were also down on the month but are still up year over year by a bit over 8%. Both SF and MF permits were lower.
New home sales were down a tad too at 618K. That’s up less than 1% year over year although you couldn’t tell that by prices which were up 9.7% year over year. Builders are still optimistic though as the Housing Market Index came in at a slightly less than expected 70. Future sales an traffic were both down modestly.
Sentiment
Consumer and small business sentiment is ebullient. The University of Michigan consumer sentiment survey hit a 14 year high at 102 while the NFIB Small Business Optimism index hit 107.6, the highest since 1983.
Market Indicators
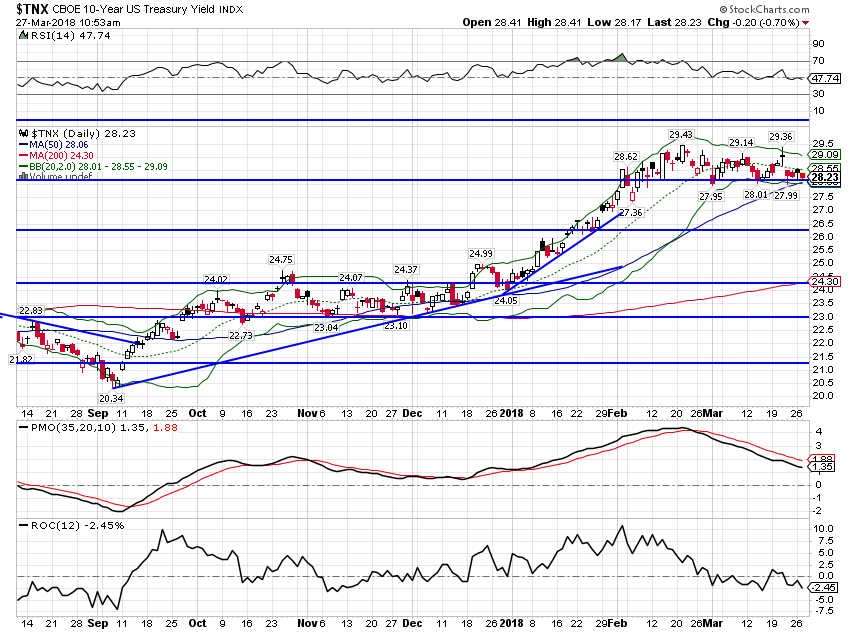
10 Year Treasury Note YieldThe 10 year Treasury yield continued to drift lower over the last fortnight, down about 3 basis points. While the inflation data did moderate somewhat – excluding import and export prices – the lack of response from bonds to the improvement in Industrial Production, Durable Goods orders and Job Openings is somewhat puzzling. How strong does the data need to be to push rates through the 3% barrier? |
US 10 Year Treasury Note Yield, Sep 2017 - Mar 2018 |
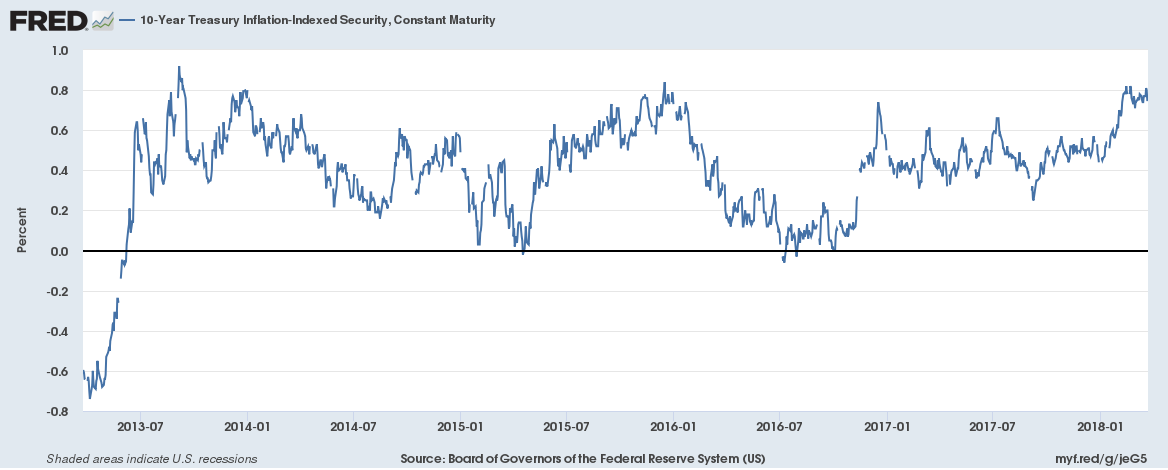
10 Year TIPS YieldTIPS did not respond to the stronger economic data either, still stuck at the high end of the range since mid-2013. Real growth expectations have stalled. |
US 10 Year Treasury Inflation - Indexed Security, Jul 2013 - Mar 2018 |
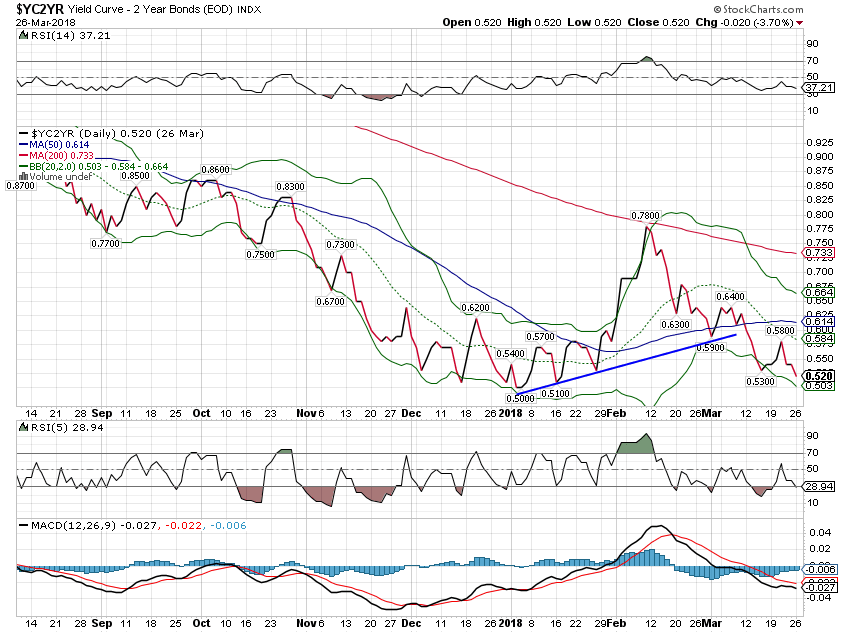
10/2 Yield CurveThe yield curve continued to flatten since the last update as 2 year rates rose and 10 year rates fell. While this points to slower growth at some point in the future, it isn’t warning of imminent recession. |
2 Year Bonds Yield Curve, Sep 2017 - Mar 2018 |
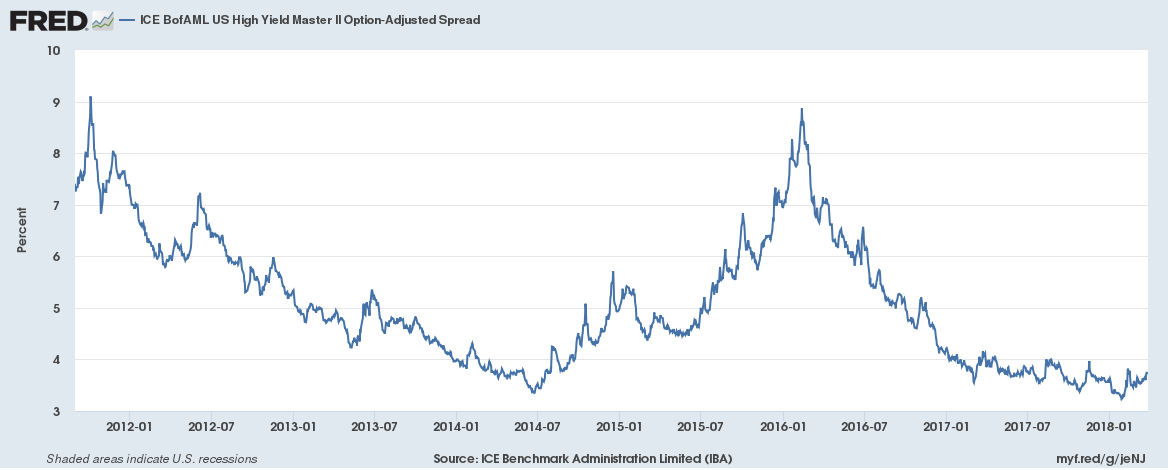
Credit SpreadsCredit spreads moved wider by 20 basis points since the last update. This is another puzzling development as I would have expected spreads to narrow as stocks recovered. Since the stock market peak on 1/26, spreads have widened by 50 basis points, a change of 15%. Assuming that holds to the end of the month a move of that size is sufficient to consider an asset allocation change. |
ICE BofAML US High Yield Master Option Adjusted Spread, Jan 2012 - 2018 |
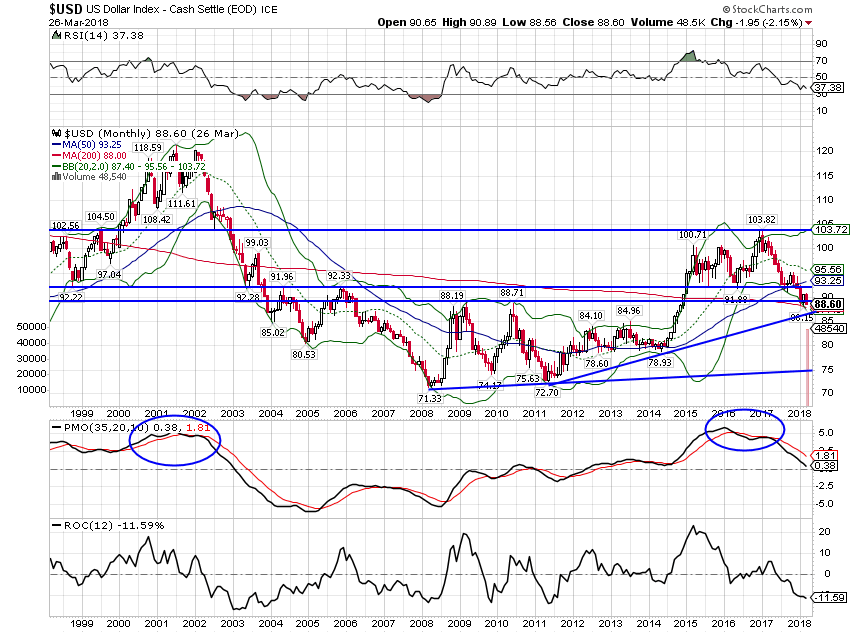
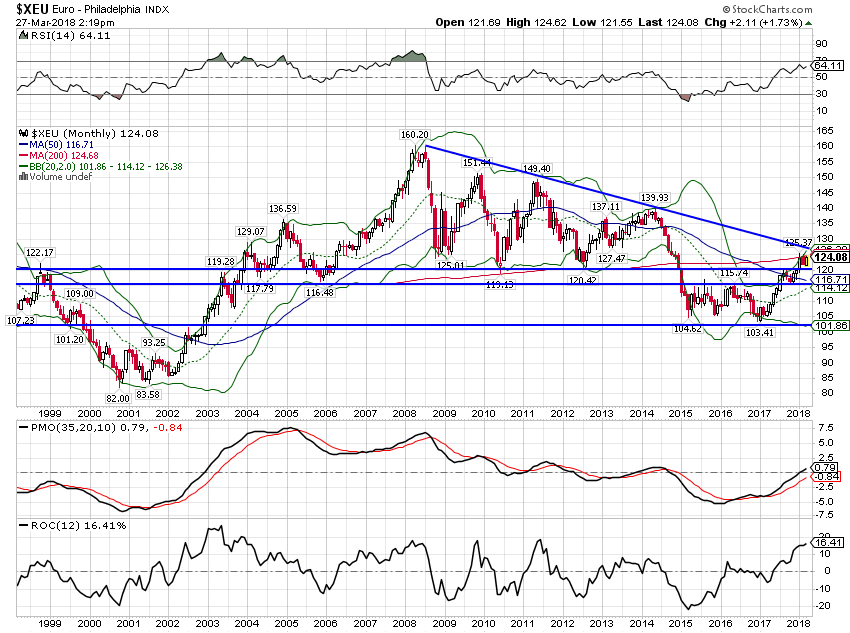
US DollarThe dollar downtrend is intact but I suspect this is in for a pause soon. We are approaching the uptrend line from 2011 low and the Euro is at a similar well established downtrend line. I do not think we are about to change the trend but a pause is overdue and the technicals say it should happen soon. |
US Dollar Index, 1999 - 2018 |
| But the trend is still down for now and the administration seems entirely comfortable with that. As long as that is the case, dollar rallies are not to be trusted. |
Euro - Philadelphia Index, 1999 - 2018 |
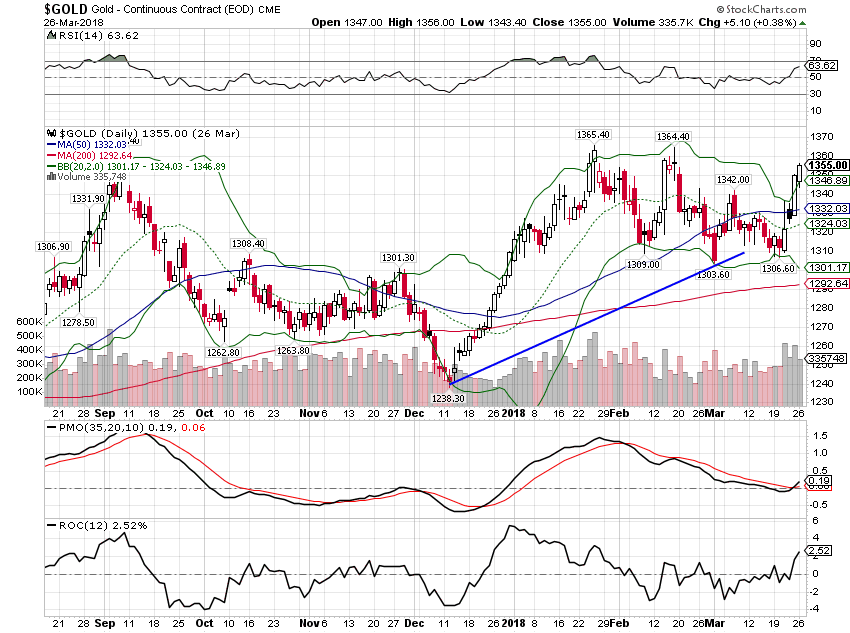
CommoditiesGold is up about $30 since the last update, another indication that the rosy economic outlook may be starting wilt a bit. |
Gold Daily, Sep 2017 - Mar 2018 |
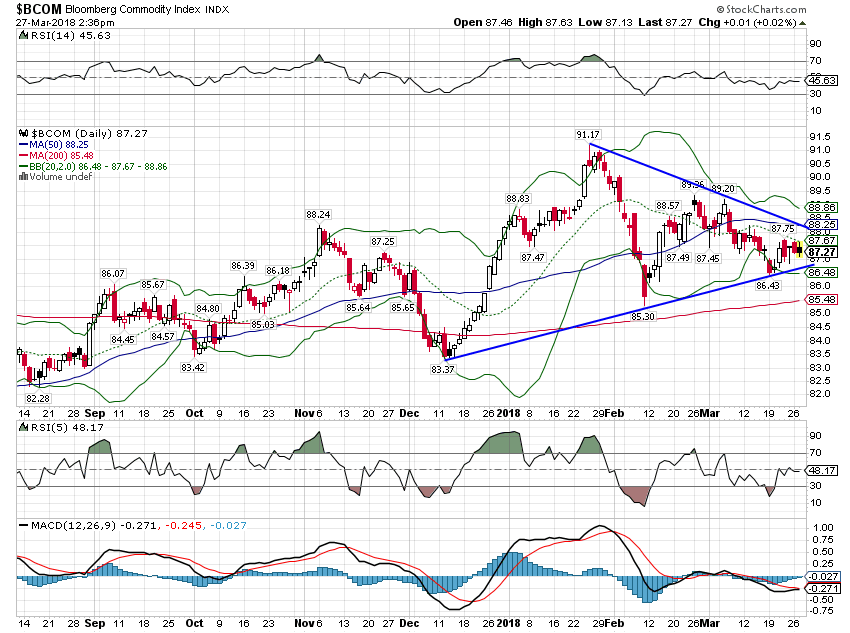
| Gold also outperformed commodities more generally, an indication that fear is outstripping greed. |
Bloomberg Commodity Index, Sep 2017 - Mar 2018 |
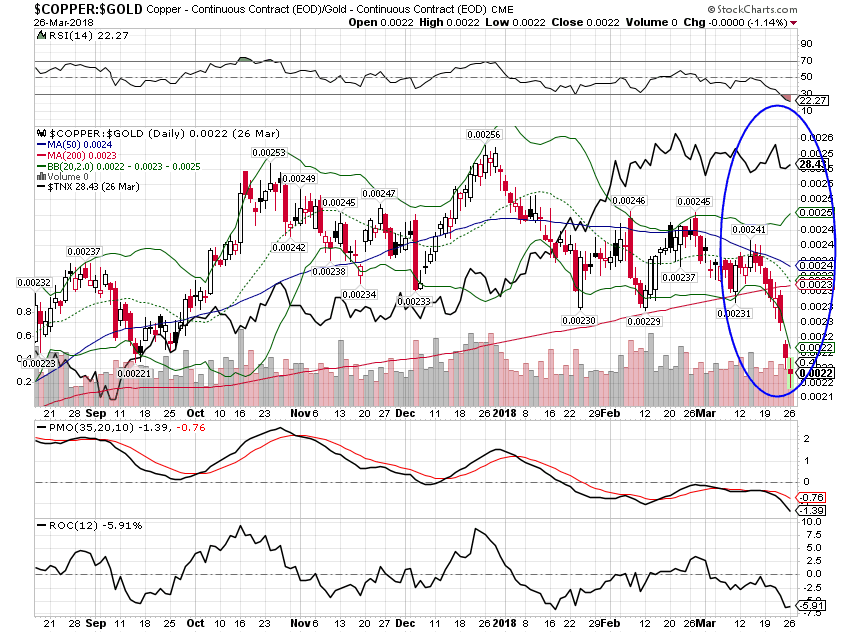
| More specifically, the copper/gold ratio has collapsed with copper falling and gold rising. The 10 year Treasury yield generally follows this ratio and so a bond rally would not be a surprise. |
Copper:Gold, Sep 2017 - Mar 2018 |
Most markets seem to be pointing toward some kind of slowdown whether the Fed recognizes it or not. In fact, the bond market rally the copper/gold ratio has been predicting started today with the the 10 year yield closing below 2.8% for the first time since early February. I don’t put a lot of faith in technical analysis when it comes to yields but there doesn’t appear to be very much in the way of support between here and 2.5%.
I would hasten to add though that we don’t have any sign of recession yet. The yield curve is flattening (although that was interrupted a bit today) but is not flat or inverted. More importantly, we aren’t seeing the typical rapid steepening we see just prior to recession. Credit spreads are moving wider but aren’t at worrisome levels yet. If the current widening persists through the end of the month though I’ll probably take some action to reduce risk in our portfolios. We have a process that dictates a reduction in risk if spreads move wider by 10% in a month. That criteria has been met but we generally only act at month end so we’ll wait to see the numbers. Again, though, a widening does not necessarily mean recession even if it does mean stock market correction.
So, to quote another protest song, what’s going on? I think what we have here, more than anything, is genuine uncertainty. The economic result of the recently enacted tariffs isn’t something that can’t be calculated, a risk with known odds. We can’t know for sure how other countries will retaliate if at all. We don’t even know yet what products the Chinese tariffs will apply to. President Trump is the very embodiment of uncertainty, no one, even himself I think, sure what he will post on Twitter at any moment. That makes for a difficult investing environment and a lot of people will just choose not to participate. But genuine, actual uncertainty – as opposed to risks for which the odds are known or at least knowable – is also where true profit opportunities exist. Yes, your search for those opportunities will turn up some losers but the beauty of true uncertainty is that the payoffs when you are right are usually pretty large. So I say embrace the uncertainty and happy hunting.
Tags: Alhambra Research,Bi-Weekly Economic Review,Bonds,commodities,copper/gold ratio,credit spreads,currencies,durable goods orders,economic growth,Gold,industrial production,Interest rates,jolts,Market Sentiment,Markets,newslettersent,Retail sales,stocks,TIPS,US dollar,Yield Curve


