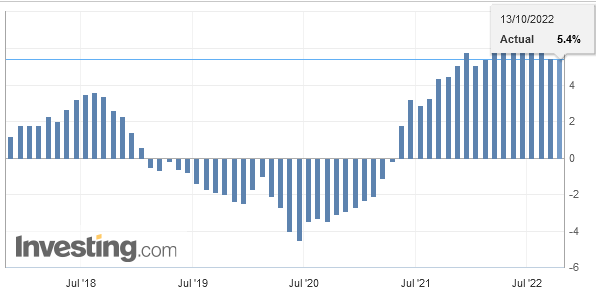
We do not like Purchasing Power or Real Effective Exchange Rate (REER) as measurement for currencies. For us, the trade balance decides if a currency is overvalued. Only the trade balance can express productivity gains, while the REER assumes constant productivity in comparison to trade partners.
Who has read Michael Pettis, knows that a rising trade surplus may also be caused by a higher savings rate while the trade partners decided to spend more. This is partially true.
Recently Europeans started to increase their savings rate, while Americans reduced it. This has led to a rising trade and current surplus for the Europeans.
But also to a massive Swiss trade surplus with the United States, that lifted Switzerland on the U.S. currency manipulation watch list.
To control the trade balance against this “savings effect”, economists may look at imports. When imports are rising at the same pace as GDP or consumption, then there is no such “savings effect”.
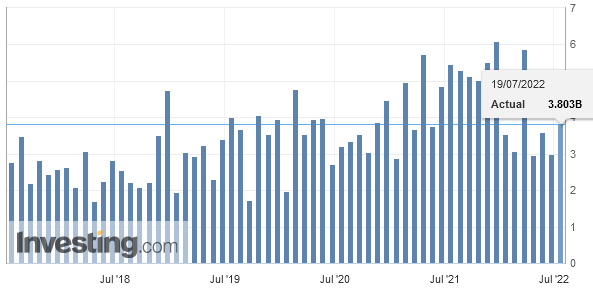
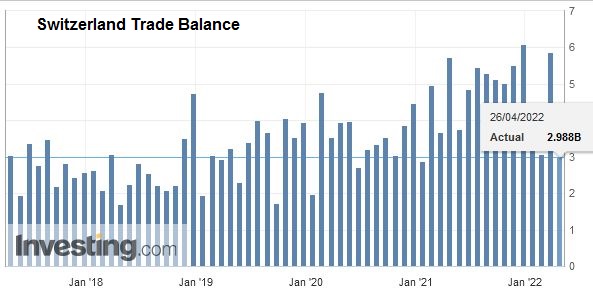
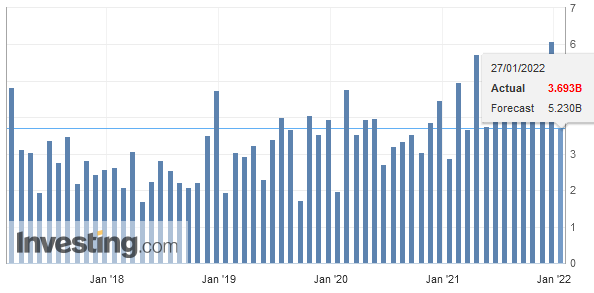
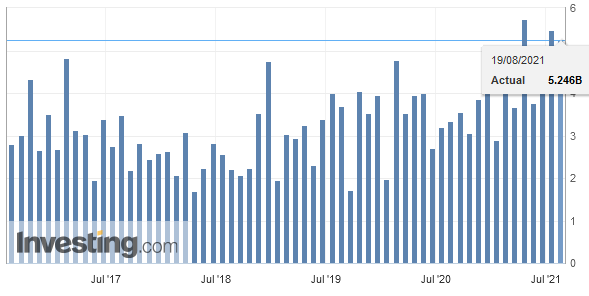
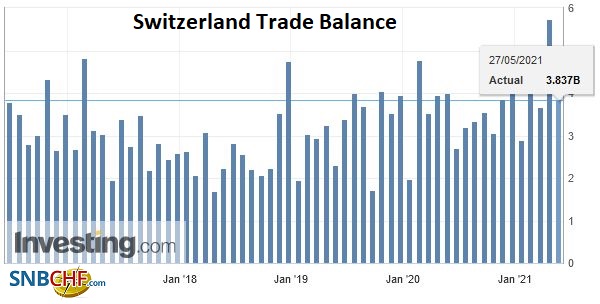
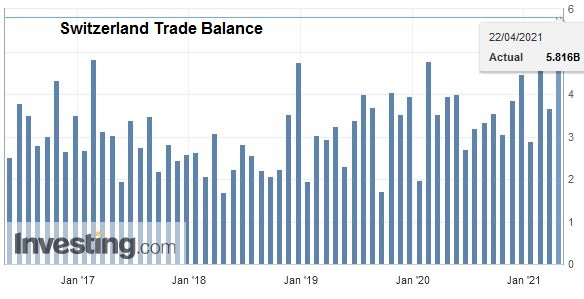
After the record trade surpluses, the Swiss economy may have turned around: consumption and imports are finally rising more than in 2015 and early 2016. In March the trade surplus got bigger again, still shy of the records in 2016.
Swiss National Bank wants to keep non-profitable sectors alive
Swiss exports are moving more and more toward higher value sectors: away from watches, jewelry and manufacturing towards chemicals and pharmaceuticals. With currency interventions, the SNB is trying to keep sectors alive, that would not survive without interventions.
At the same time, importers keep the currency gains of imported goods and return little to the consumer. This tendency is accentuated by the SNB, that makes the franc weaker.
Texts and Charts from the Swiss customs data release (translated from French).
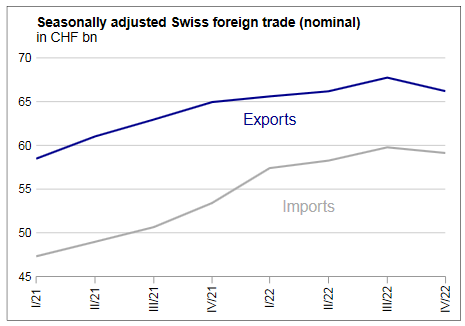
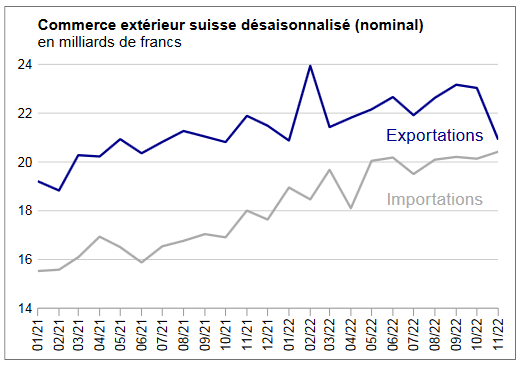
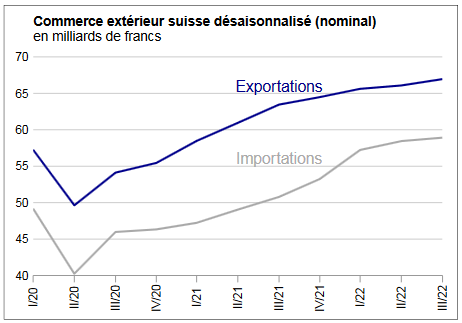
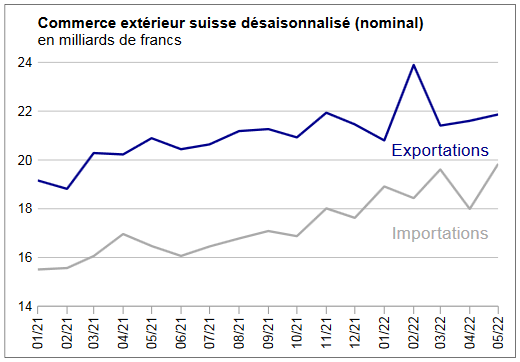
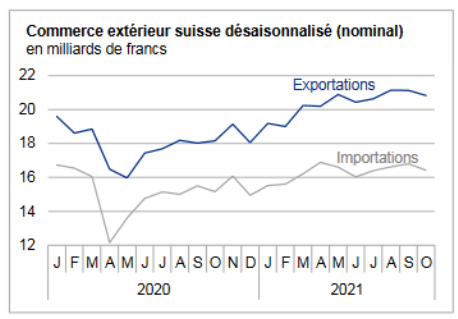
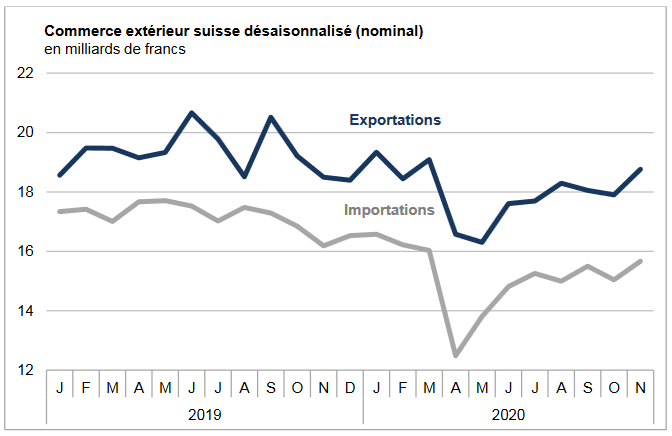
Exports and Imports YoY DevelopmentLast year, Swiss foreign trade accelerated yet again relative to 2016: exports rose by 4.7% to reach a new record high. Imports grew by 6.9%, posting their strongest growth rate since 2010. Aside from the improved economic situation worldwide, the weakening of the Swiss franc and price trends played a decisive role in both directions of trade. With a surplus of CHF 34.8 billion, the balance of trade closed the year 6% (or CHF 2.1bn) lower than the previous year. |
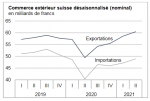
Swiss exports and imports, seasonally adjusted (in bn CHF), 2017(see more posts on Switzerland Exports, Switzerland Imports, ) Source: Swiss Customs - Click to enlarge |
Overall TrendExports rose by 4.7% (real: +1.7%) to CHF 220 billion in 2017. They thus reached a new high and exceeded the previous year’s existing record by CHF 10 billion. Imports grew by 6.9% (real: +3.8%) to CHF 186 billion, their second highest figure in history. The trend gained momentum in both directions of trade from quarter to quarter. The final quarter then saw a new quarterly high of CHF 58 billion and CHF 50 billion (adjusted for working days), respectively.
|
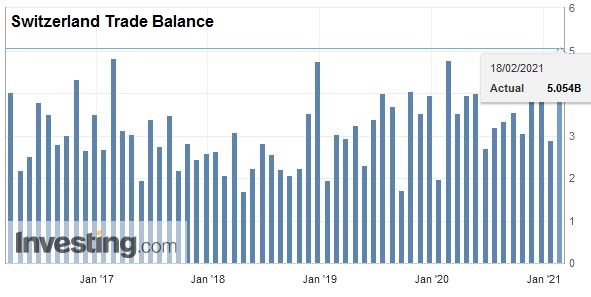
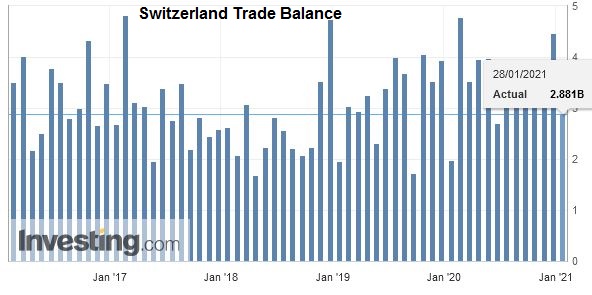
Switzerland Trade Balance, Dec 2017(see more posts on Switzerland Trade Balance, )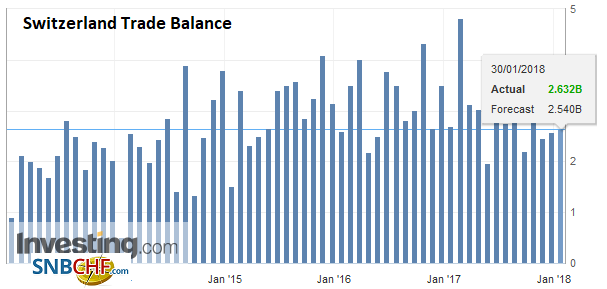 Source: Investing.com - Click to enlarge |
ExportsChina replaced the United Kingdom as fifth largest market Ten of the eleven main groups posted an increase in 2017. Only the sales of paper and graphic products fell short of the previous year’s result, continuing their longstanding negative trend. The largest branch, chemical and pharmaceutical products (+4.2 bn), accounted for 40% of total growth. The substantial rise in textiles, clothing and shoes remained due to the phenomenon of returns. Exports of metals rose by 13% and reached their highest level since 2008. In the area of chemical and pharmaceutical products, deliveries grew in all branches except agrochemical products. In particular, exports of immunological products were up by 7%. Exports of machines and electronics expanded by 3% and are thus likely to have emerged from their trough. Nonetheless, international sales in 2017 were still CHF 12 billion below the record level of 2008. Following declining sales the previous two years, exports of watches rose again in 2017 (+3%). |
Swiss Exports per Sector 2017 vs 2016(see more posts on Switzerland Exports, Switzerland Exports by Sector, )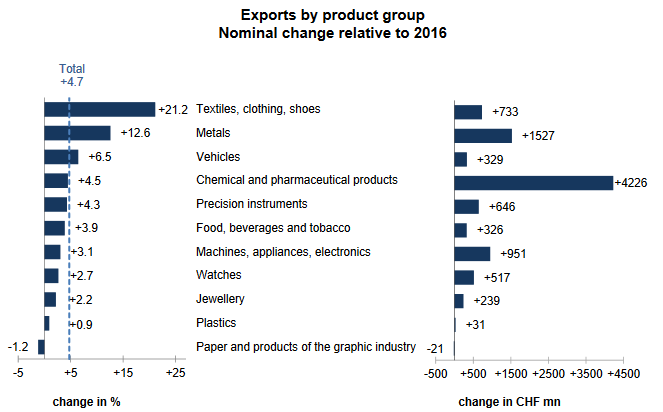 Exports by commodity group: Nominal changes adjusted for working days compared with 2016 Source: Swiss Customs - Click to enlarge |
| Switzerland’s export sector sold more goods in value terms on all continents. The increase was between 4% (Europe) and 7% (North America) in the three main markets. The rise in North America stemmed from the 7% increase in shipments to the United States, whereby exports climbed to a new record level of CHF 34 billion. In Asia (+6% to CHF 48.1 bn), Singapore (+25%; chemical and pharmaceutical products), China (+16%, or CHF 1.5 bn) and Hong Kong (+10%) stood out. Exports to China have thus doubled since 2008. In contrast, deliveries to the Middle East fell by 9%, especially those to Saudi Arabia. In Europe, exports to Belgium (+12%), Austria (+11%) and Italy (+8%) grew at an above-average rate. While exports to Germany rose by 4% (+1.6 bn), exports to France (jewellery) fell by 3% and those to the United Kingdom were down by 1%. |
Swiss Exports by Country, 2017 vs 2016(see more posts on Switzerland Exports, )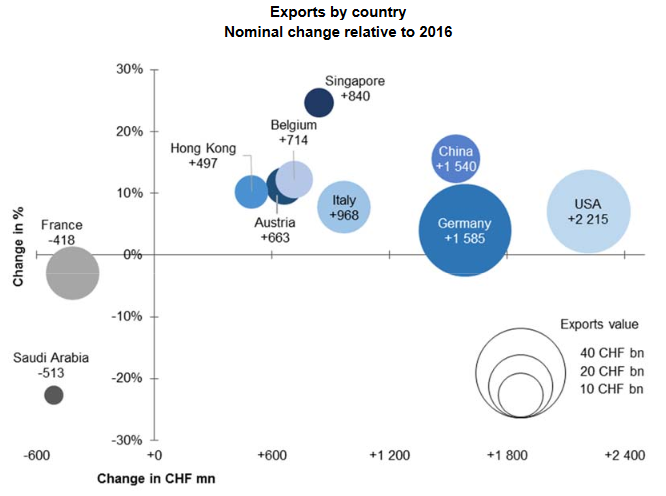 Exports by Country: Nominal changes adjusted for working days compared with 2016 Source: Swiss Customs - Click to enlarge |
ImportsPrice increases dominated the trend of imports Imports grew in seven of the ten largest branches. Half of the product groups recorded additional imports of between CHF 1.0 billion and CHF 3.1 billion. Jewellery rose the most (+24%), but chemical and pharmaceutical products (+3.1 bn, or +7%) made the largest contribution to the overall increase. The increase of a fifth in imports of energy sources was price driven (real: +0%). Price increases shaped the trend in the metals segment too (real: +4%). In the chemical and pharmaceutical products branch , imports of medicines grew by CHF 2.7 billion and those of immunological products were up by CHF 1. 3 billion. Meanwhile, imports of pharmaceutical active principles fell by the same amount. In the machines and electronics sector (+6%), the 23% increase in imports of non-electric engines (e.g. turbines) was striking. The picture was mixed in the vehicles sector (-1%), with the rise in imports of passenger cars (+2%) and commercial road vehicles (+8%) being offset by a plunge in aircraft imports (-23%). |
Swiss Imports per Sector 2017 vs. 2016(see more posts on Switzerland Imports, Switzerland Imports by Sector, )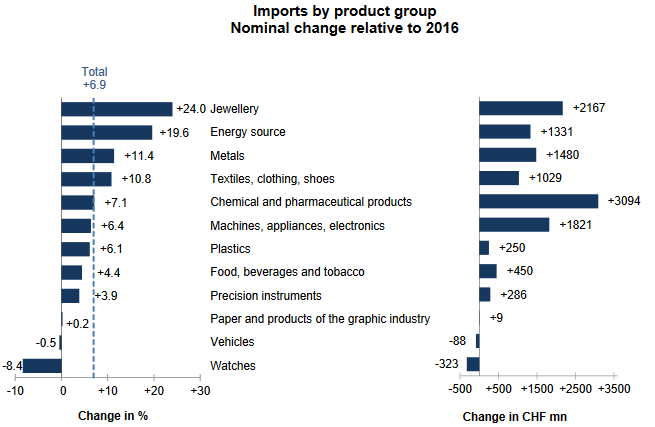 Imports by commodity group: Nominal changes adjusted for working days compared with 2016 Source: Swiss Customs - Click to enlarge |
| Switzerland imported more goods from all continents – except North America – in 2017. Imports from Asia, the second largest market for deliveries, grew by a total of 15%, or CHF 4.2 billion. Imports from the Arab Emirates (jewellery; returns) alone contributed CHF 2.1 billion. Meanwhile, imports from Japan rose by 11% and those from China by 6%. In Europe, imports from Italy, Germany and France increased by between 7% and 10%, and imports from Belgium rose by 15%. In contrast, imports from the United Kingdom fell by 5% (-333 mn). In Latin America (+12%), imports from Mexico rose by a third, or CHF 233 million. In North America (-6%), the doubling of imports from Canada was unable to compensate for the decline from the United States. The trend of aircraft imports was the cause in both cases.
In December 2017, Swiss foreign trade continued to surge: adjusted for the number of working days, exports grew by 10.8% (real: +4.6%) and imports by 13.5% (real: +11.1%). While the momentum was also reflected in the seasonally adjusted export figures, imports were unable to match the previous month’s results. The year ended with a trade surplus of CHF 2.5 billion. |
Swiss Imports by Country 2017 vs. 2016(see more posts on Switzerland Imports, )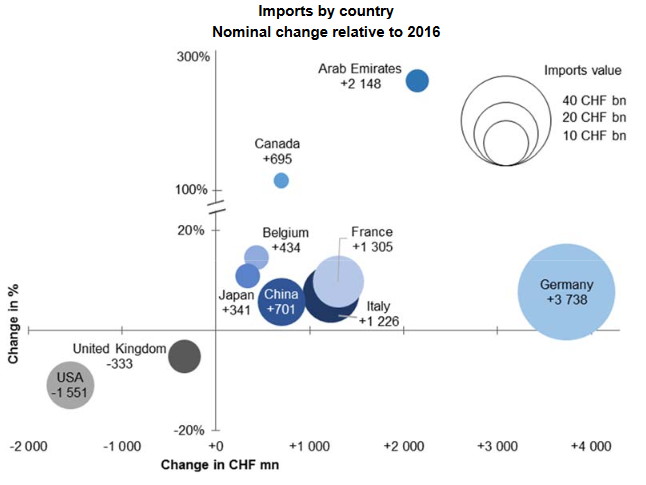 Imports by Country: Nominal changes adjusted for working days compared with 2016 Source: Swiss Customs - Click to enlarge |
Tags: newslettersent,Switzerland Exports,Switzerland Exports by Sector,Switzerland Imports,Switzerland Imports by Sector,Switzerland Trade Balance


