| 98,750,067,000,000 Reasons to Buy Gold in 2018 – World equity index market capitalization touching distance of $100 trillion dollars at beginning of December – Key indicators across global financial markets are looking decidedly bubble-like – Little indication that we are through the worst of the financial crisis that started in 2007 – Apparent lack of concern regarding the over-heated and overpriced markets – Since financial crisis gold has climbed nearly 124% in EUR, 190% in GBP and 98% in USD – Goldcore’s latest podcast covers gold’s role in 2018 in the land of bubbles |
 - Click to enlarge |
| Earlier this week Yahoo! published ‘2017: The year the financial crisis officially ended‘. In it the author points to record-high stocks and cryptocurrency surges as some of the key indicators that the latest financial crisis is tightly wrapped up and now destined for the history books.
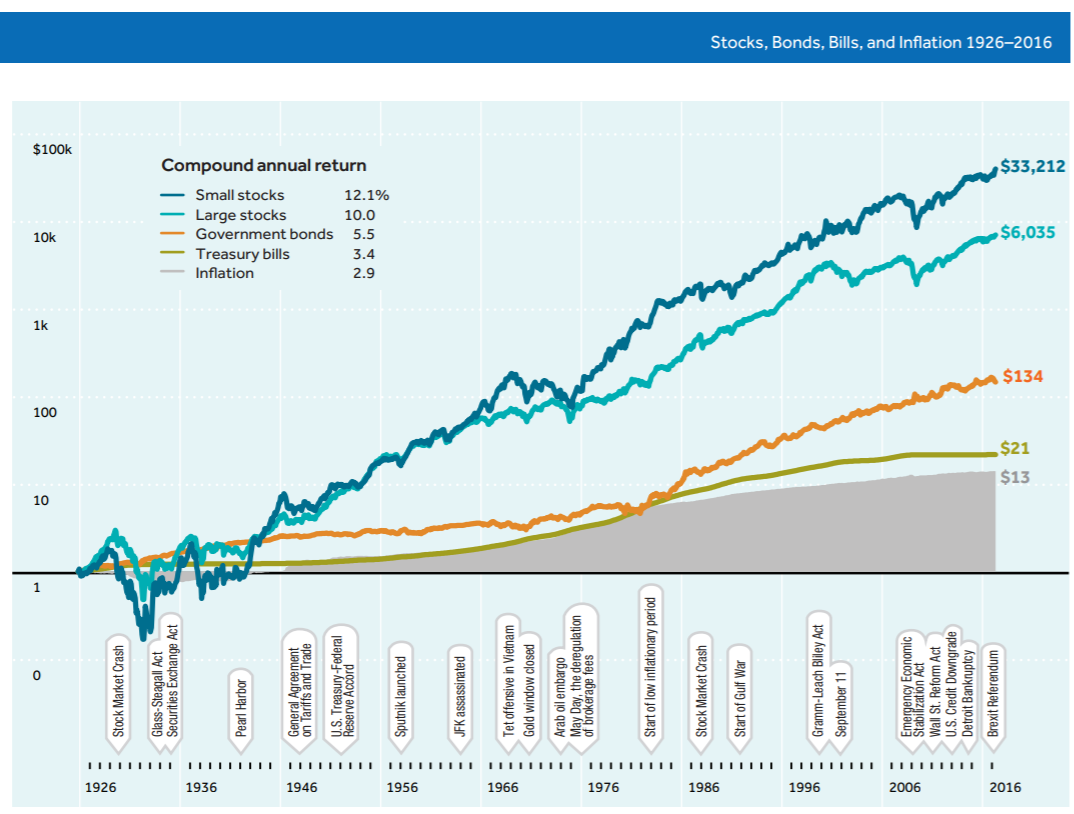
Sadly we don’t agree. Neither does Bloomberg. At the start of the month two Bloomberg journalists explained why they were ‘worried about 2018’. In simple terms – there are so many bubbles on the horizon its not worth stopping to count them. For both Bloomberg and Goldcore the existence of stock market highs and surging assets that are as yet unproven and untrusted are key signs that we are in bubble territory. These bubbles exist alongside ‘irrational complacency’ (see the Yahoo! article for an example of this), especially in the case of central banks. These money printers rarely like to acknowledge the asset bubbles they create. However it is without doubt that the last decade of unconventional monetary policy has amounted to a $20 trillion monetary stimulus that has pumped up these bubbles. These bubbles now threaten financial stability. As the Bloomberg article (reproduced below) explains, there are suspiciously few mentions of ‘bubble’ in the financial media at present suggesting that we’re not as prepared for them as we should be. This is not something that can be ignored and it is arguably hard to ignore. One could perhaps argue they are blind to bubbles as they are not seeing any indication of inflation in wages. This is true, but financial asset price inflation is clearly there. We are exposed to the risk of several market crashes – in equities, bonds, and credit markets. Sadly financial tipping points rarely come from the obvious culprits. Often the catalyst is a seemingly innocuous event, one which in scenario planning is barely considered. This is why investors and savers must prepare their portfolios for both the unknown and inevitable. This is where gold comes in. The safe haven has stood strong and held its own in the face of pumped up asset classes, low interest rates and increased risk. This is largely thanks to its sovereignty in the marketplace. As we have repeatedly stated gold carries little counterparty risk and serves as a form of financial insurance whilst the walls of both the political and financial system grow increasingly weak. It is a myth that 2017 is the last we will see of the financial crisis. The trigger to the collapse may well be different to that which took place a decade ago but the signs pointing us there are very similar. Gold’s long-term rise and strong performance will not be over for as long as we continue to ignore the hot air we keep pumping into the marketplace. Even if you believe the claims that the financial crisis is truly over rather than warming up for its next explosion you cannot ignore gold’s stellar performance since the crisis first began. Currently it is up nearly 124% in EUR, 190% in GBP and 98% in USD. It has good form both when the chips are down and when everyone thinks they’re doing well. It seems to make sense, therefore, to prepare your portfolio for all eventualities. As we can see from history both long and short-term, allocated, segregated bullion performs well in times of both crisis and positivity. It’s a safe haven worth holding onto. To learn more about gold’s role in 2018 and beyond be sure to check out our latest Goldnomics Podcast ‘Gold, Stocks, Bonds, Bitcoin in 2018. Everything Bubble Bursts?’ Below we bring you Bloomberg’s reasons as to why they’re worried about 2018. As 2017 enters its final month, here are 12 charts to illustrate what a year it’s been in markets. Far be it from us to be party-poopers; but let’s just say what we see makes us slightly nervous about 2018. The total value of companies listed on the world’s stock markets as of Friday’s close was $98,750,067,000,000 — within touching distance of $100 trillion for the first time. A (Very Big) Round Number
World equity index market capitalization is a whisker away from $100 trillion
|
World Equity Index Market Cap, Sep 2003 - Nov 2017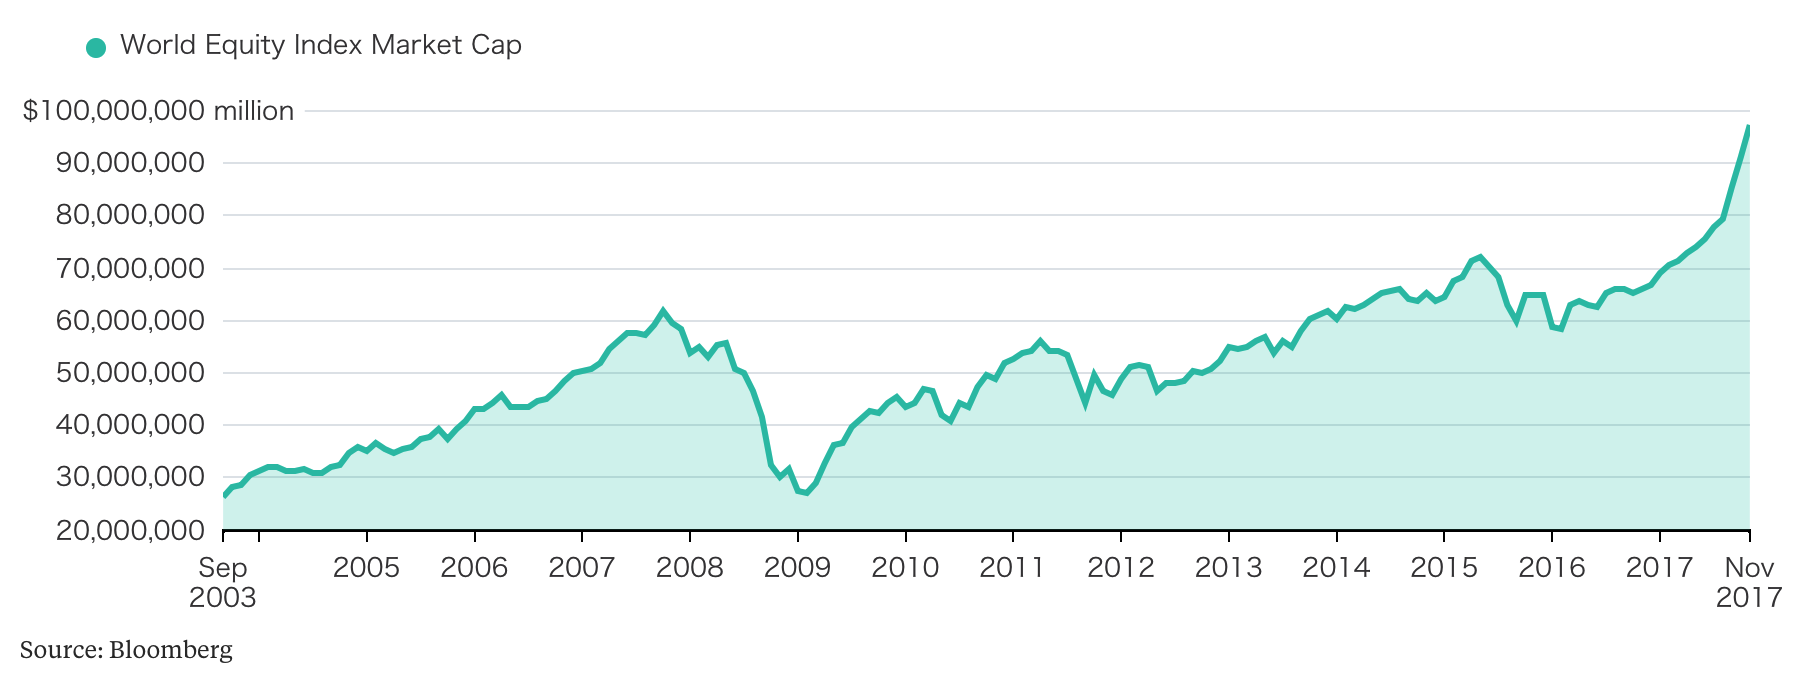 - Click to enlarge |
| That surge in equity values has been accompanied by a drop in price swings. As our Bloomberg News colleague Wes Goodman pointed out last week, equity market volatility has dropped below that of bonds for the first time ever this year.
Comfortably Numb
60-day volatility for stocks dropped below that of bonds for the first time this year
|
Bloomberg Barclays Global Bond Index and MSCI Global Stocks Index, March 1999 - Nov 2017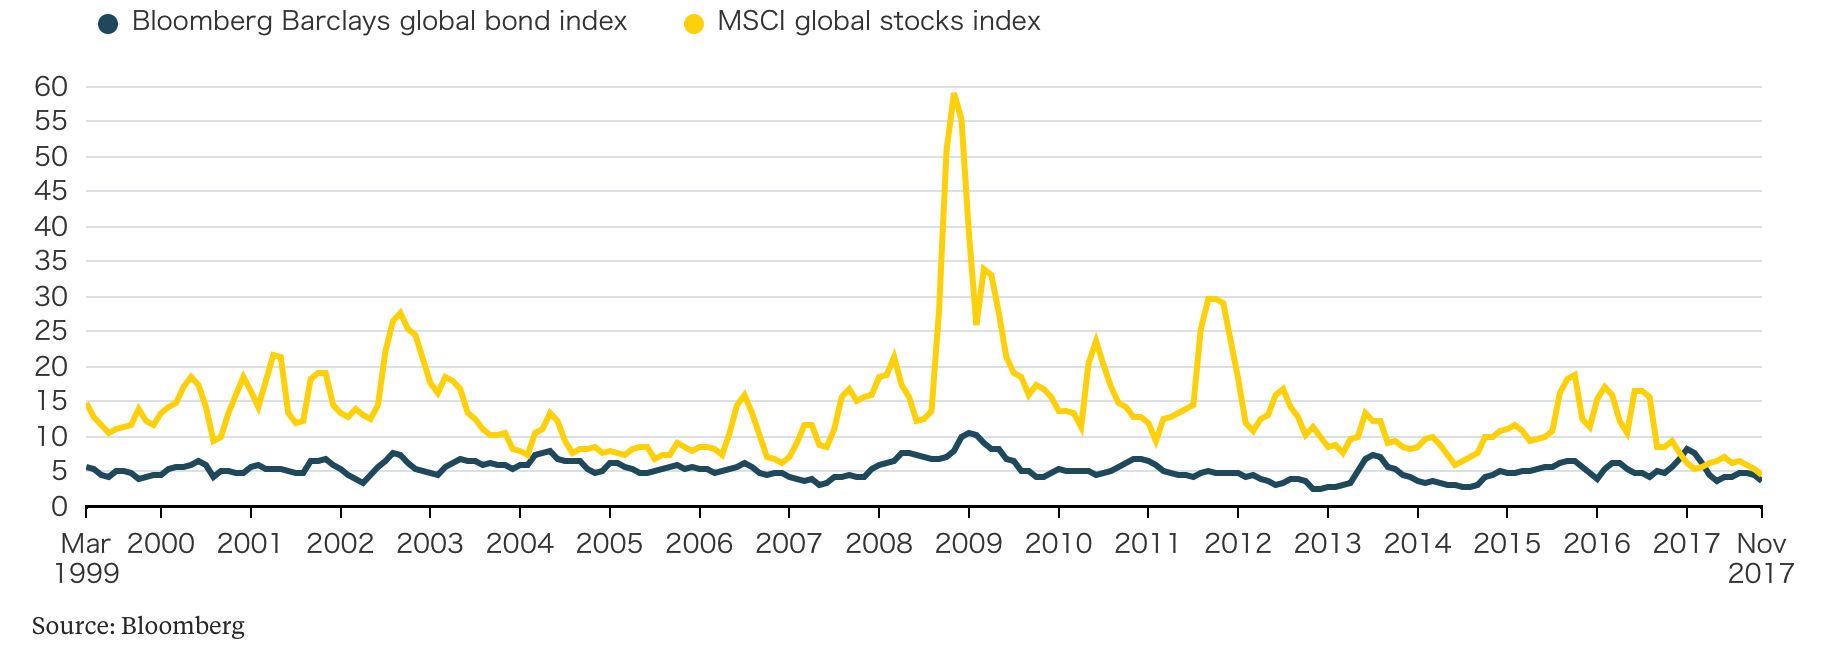 - Click to enlarge |
| Pockets of the bond market also look troublesomely bubble-like. Two-year euro zone government bonds have raced below zero this year: most governments can borrow at an even lower cost than the European Central Bank’s deposit rate.
Below Zero
Most European government bonds yield less than the -0.40% ECB deposit rate
|
Two Year Yields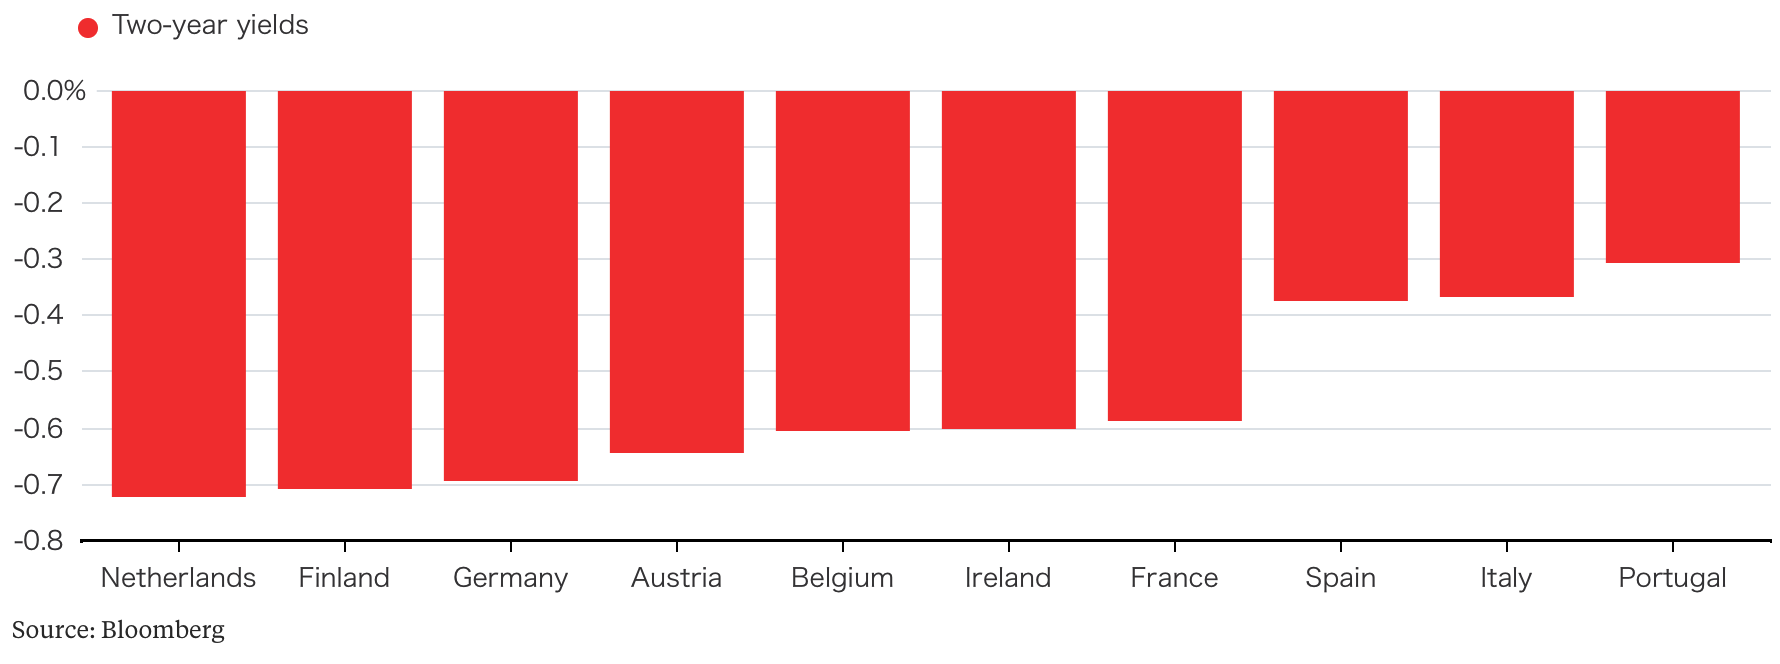 - Click to enlarge |
| Yields are being driven lower as the ECB continues to expand its balance sheet by buying bonds.
ECB Takes The Lead
Central banks all ramped up their balance sheets after the crisis, but the ECB is carrying on
|
FED, ECB and BOJ, Dec 2007 - Nov 2017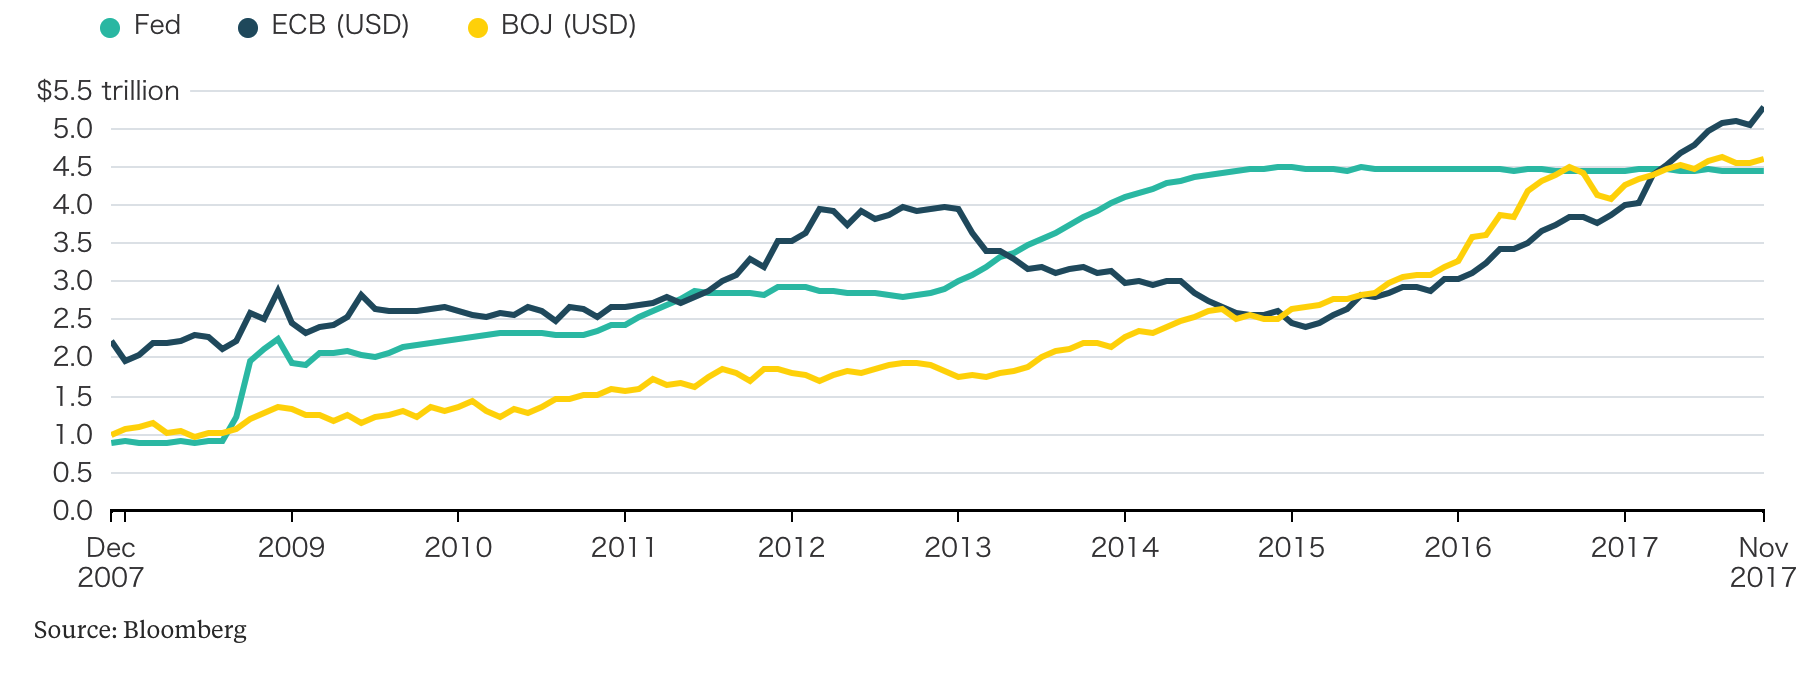 - Click to enlarge |
| In the U.S. Treasury market, the flattening of the yield curve is worrying some bond investors, including billionaire fund manager Bill Gross.
Flatter and Flatter
The U.S. yield curve has flattened steadily over 2017
|
US Treasury Yield Spread, Jan - Dec 2017 - Click to enlarge |
| With government paper offering such meager returns, money has been flowing into corporate bonds. European investment-grade bond funds have taken in cash for 45 consecutive weeks, according to analysts at Bank of America Merrill Lynch. Inflows are poised to set a record for the year. |
Cumulative Weekly Percent of AUM Flows, Jan - Nov 2017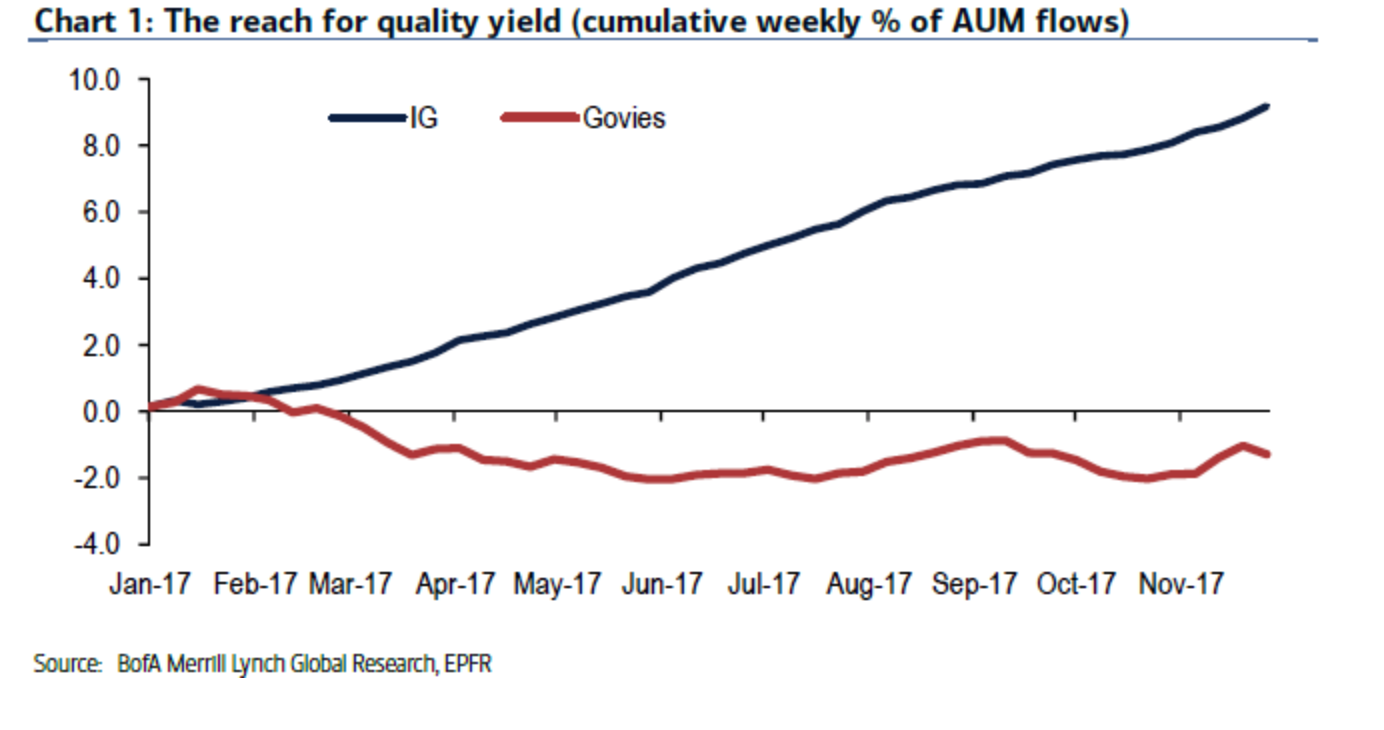 - Click to enlarge |
| Sales of new corporate debt denominated in euros are also setting records this year.
Corporate Bonanza
With one month to go, 2017 sales are already 10 percent above the total for 2016
|
Euro-denominated Corporate Debt, 2014 - 2017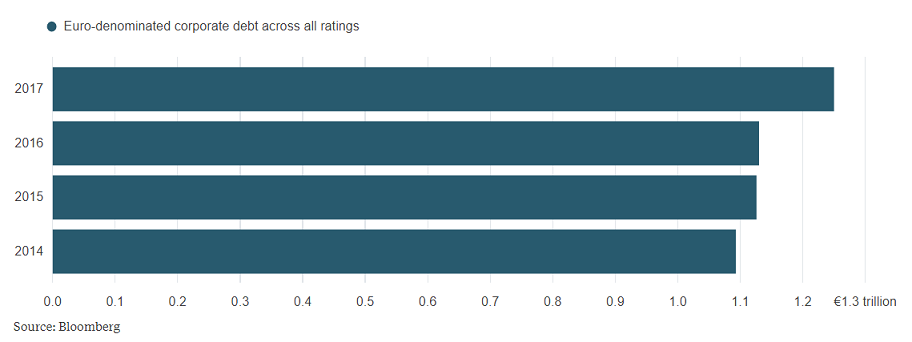 - Click to enlarge |
| Spreads on non-investment grade European debt briefly dipped below U.S. 10-year Treasury yields in August. As investors clamor to buy the bonds, their yields are making the moniker “high yield” increasingly unsuitable.
Not Such a High-Yielding Market
Non-investment grade European corporate yields fell below 3 percent for the first time in 2017
|
Non-Investment Grade European Debt, Dec 2012 - 2017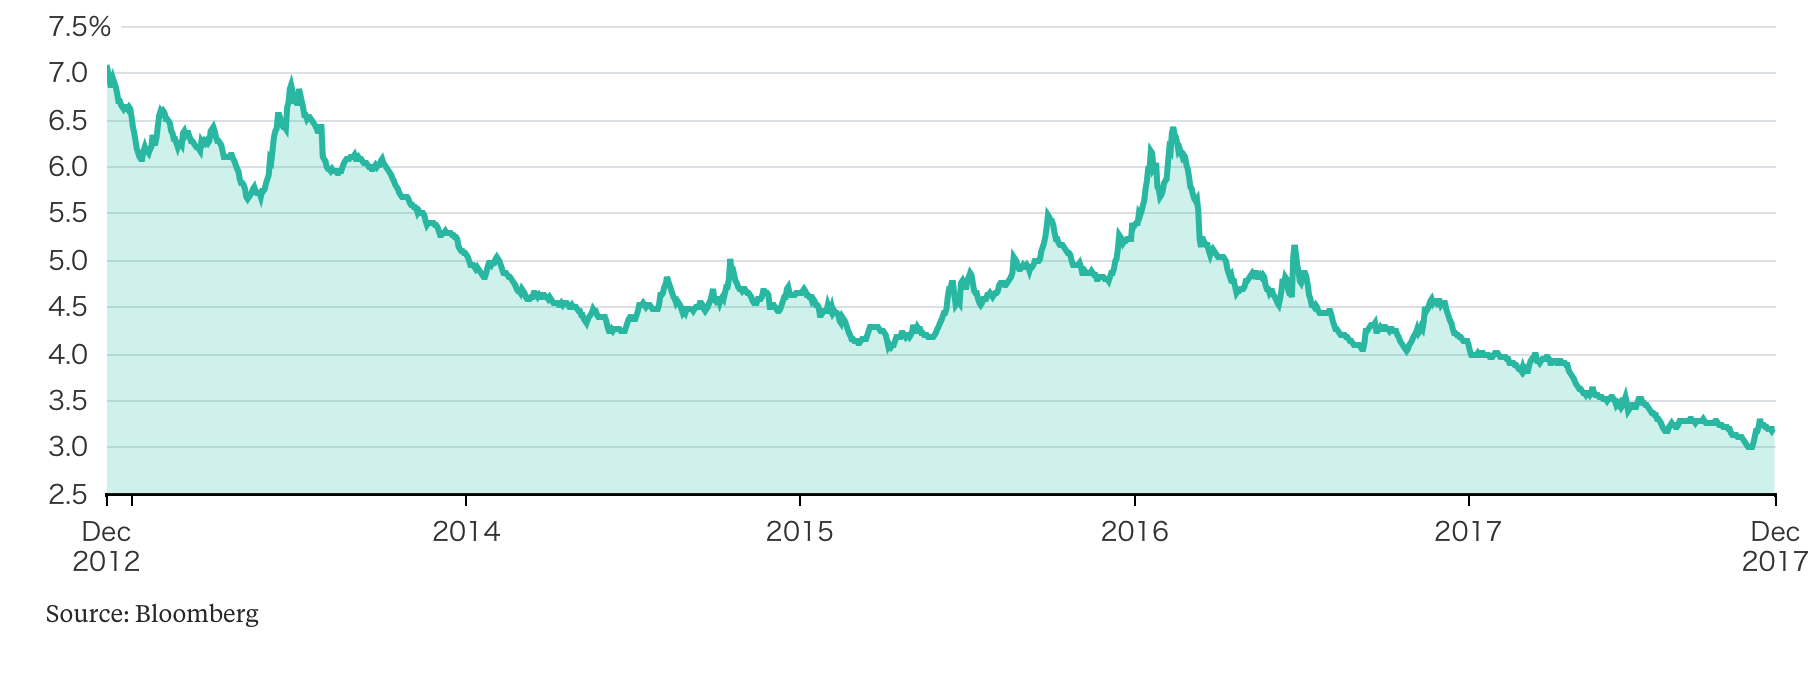 - Click to enlarge |
| Last month saw the record for the highest price paid for a work of art obliterated by an unidentified buyer who bid $450.3 million for Leonardo da Vinci’s “Salvator Mundi” at a Christie’s auction — compared with its pre-sale estimate of $100 million.
Art for Art’s Sake?
The unidentified buyer of the da Vinci artwork broke the record [Goldcore note, the buyer is reported to have been Prince Badr bin Abdullah bin Mohammed Al Farhan on behalf of the Abu Dhabi Department of Culture & Tourism]
|
Top Prices for Art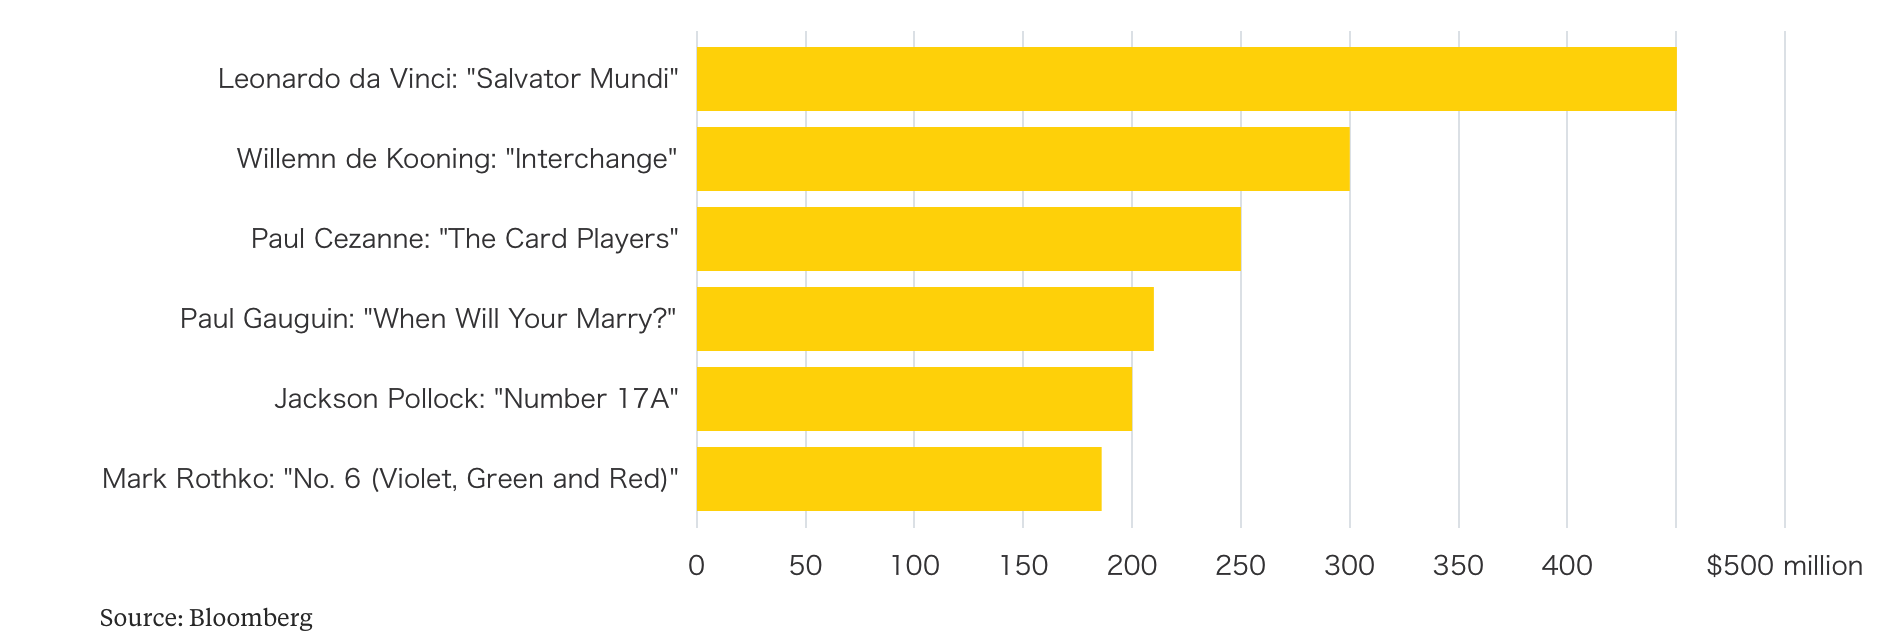 - Click to enlarge |
| This year’s more than 55 percent rise in Amazon.com Inc.’s share price has been particularly good for its founder and CEO Jeff Bezos. He’s only the second executive ever to top the magic $100 billion mark, according to Robert LaFranco, who runs the Bloomberg Billionaires team; Microsoft Corp. founder Bill Gates reached that milestone in 1999.
It’s Good to be Jeff Bezos
The net worth of the Amazon founder surpassed $100 billion last month
|
Amazon.com Inc's Share Price, Apr 2012 - Nov 2017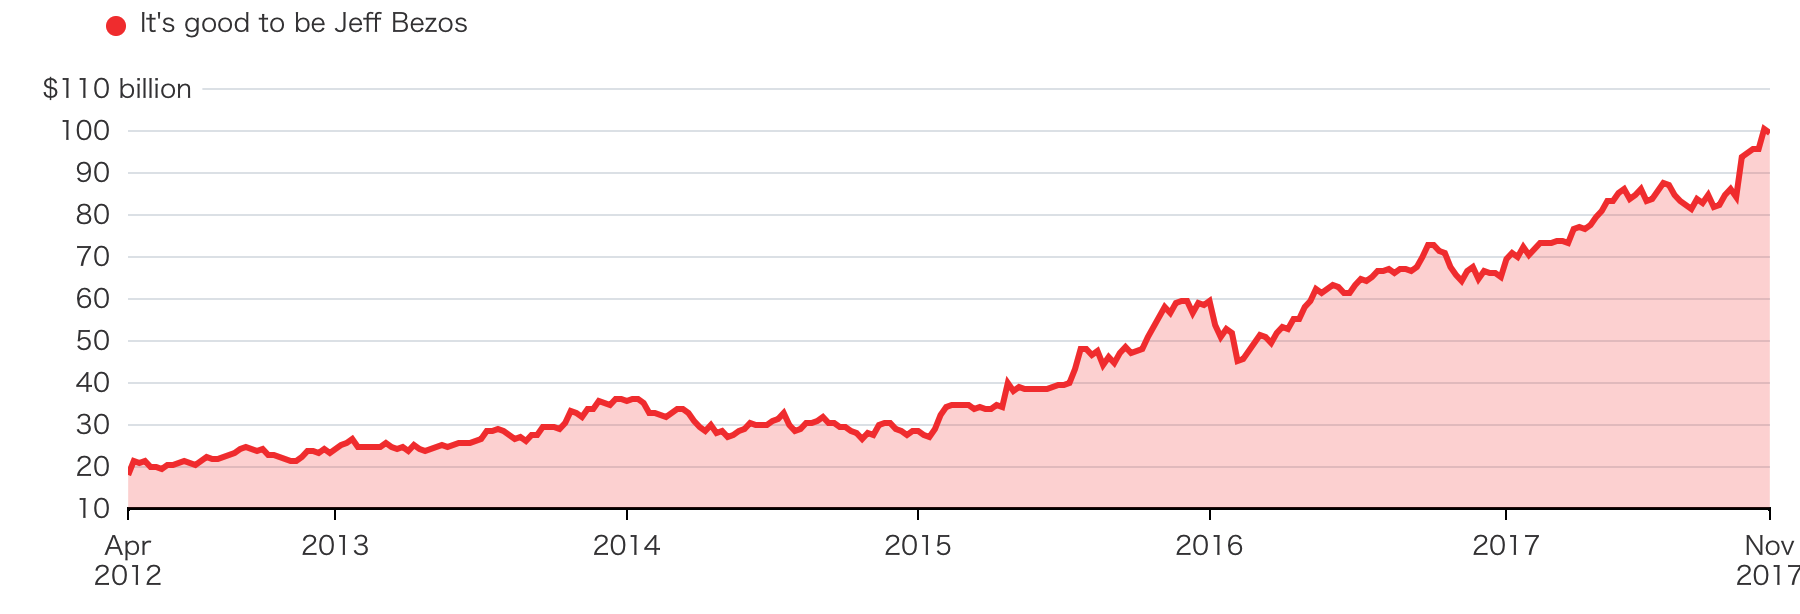 - Click to enlarge |
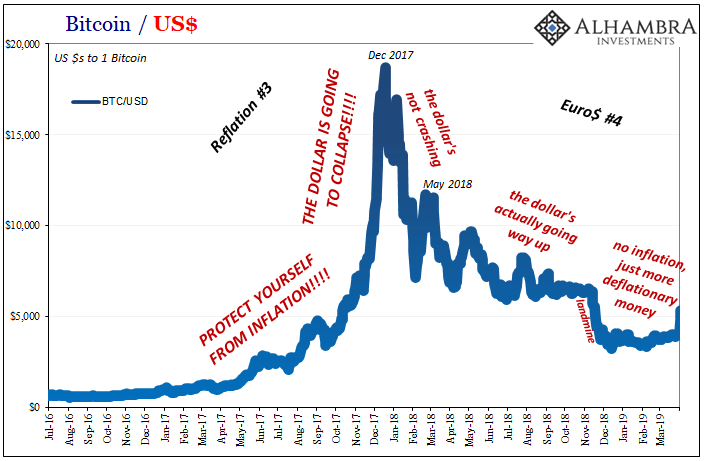
| And then there’s the bubbliest market of them all: Bitcoin. The price of the virtual currency recently crossed $10,000 for the first time.
A Tenfold Increase This Year
Bitcoin’s seemingly inexorable rise
|
Bitcoin Price, Dec 2016 - 2017(see more posts on Bitcoin, )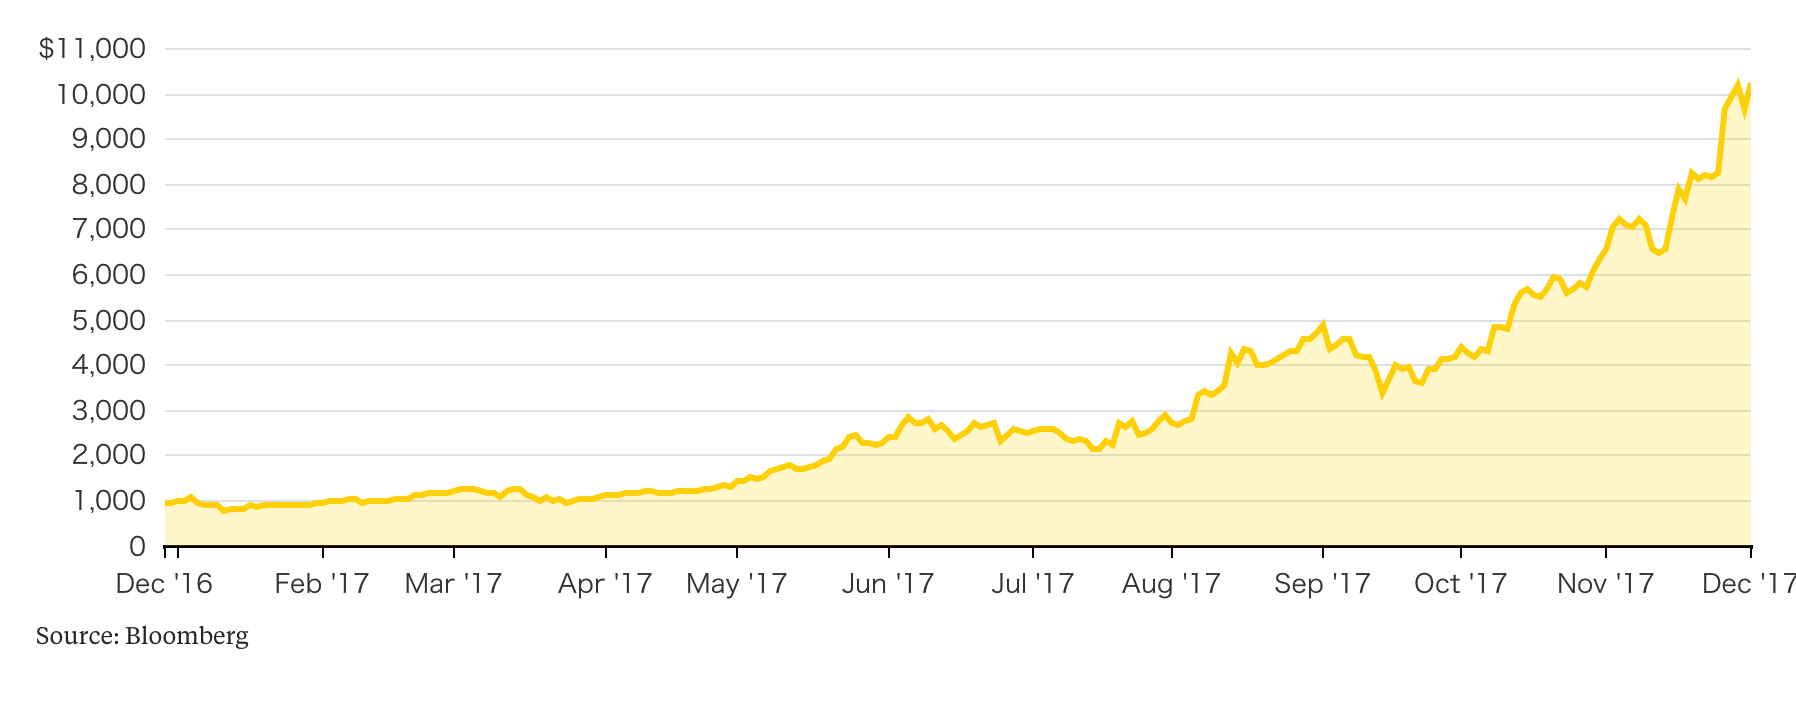 - Click to enlarge |
| Despite that move, the number of times the term “bubble” has appeared in news articles is still below previous peaks. Still feeling comfortable about 2018? |
Bitcoin in News Article, Nov 2007 - 2017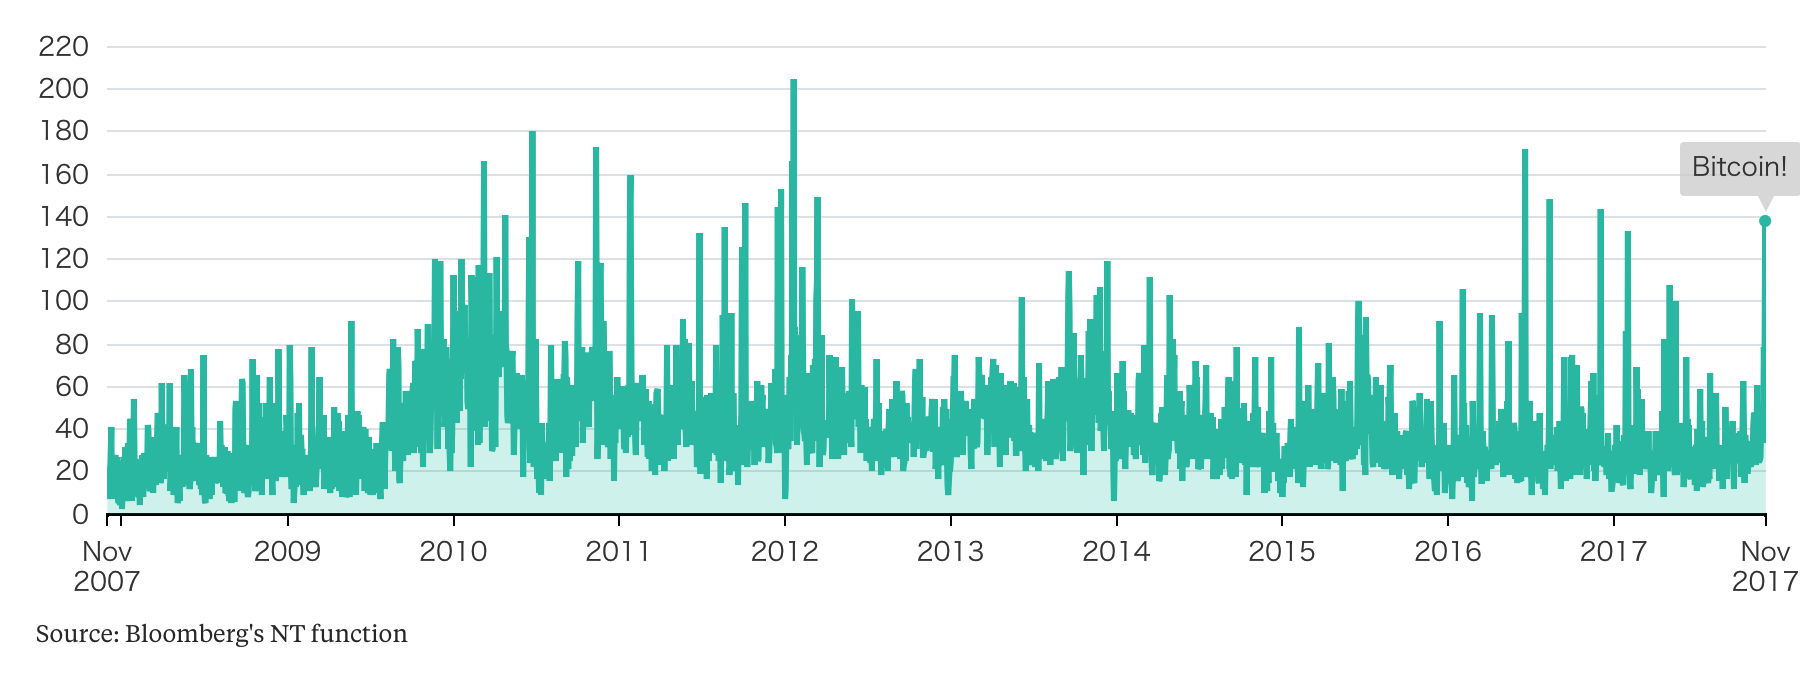 - Click to enlarge |
|
A Bubble in Bubbles
Use of the word “bubble” in stories on the Bloomberg terminal
|
Bloomberg Dollar Spot Index and US Treasury Yield, Jan - Dec 2017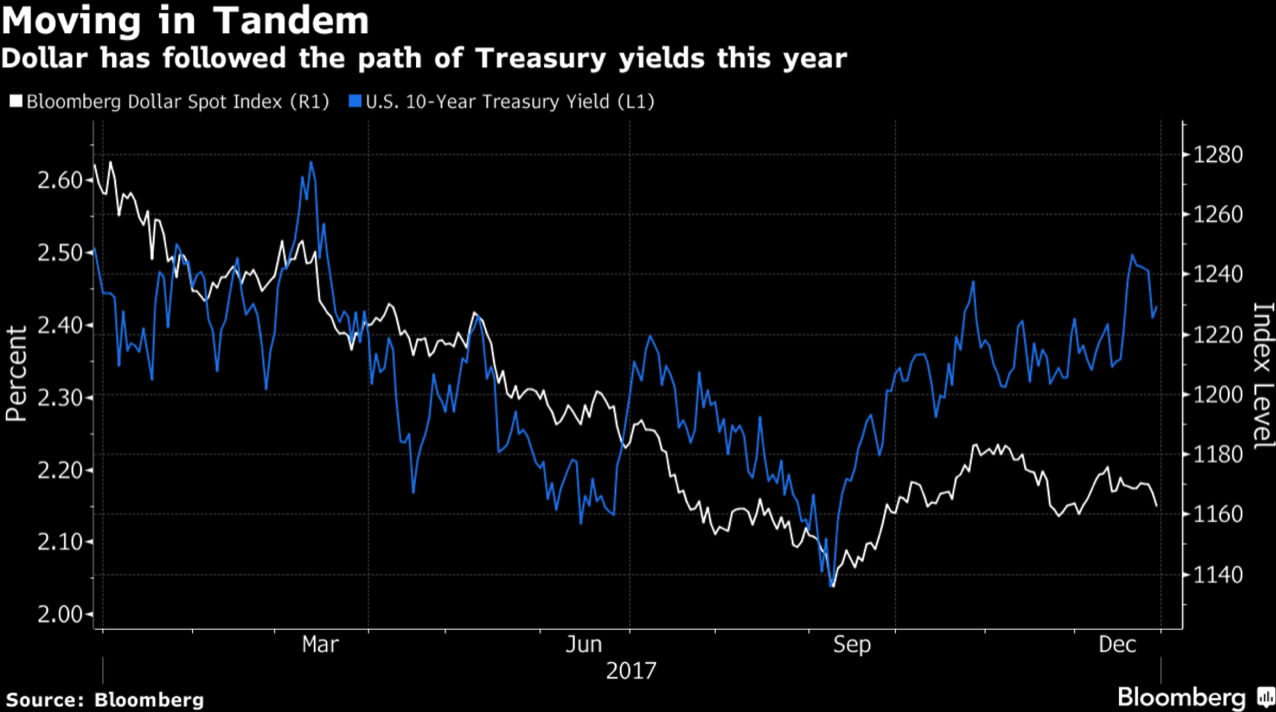 Source: Bloomberg - Click to enlarge |
Tags: Bitcoin,Daily Market Update,newslettersent