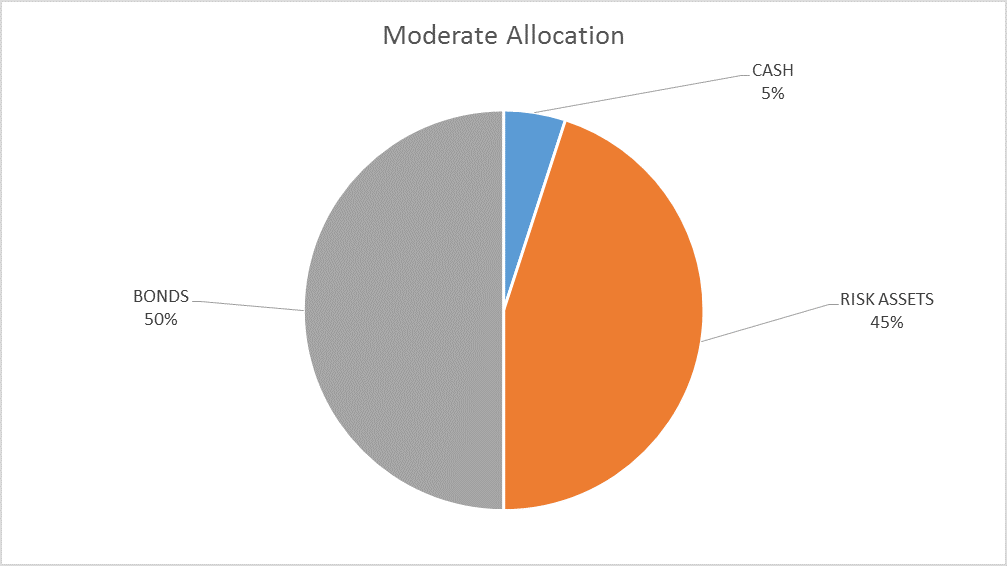
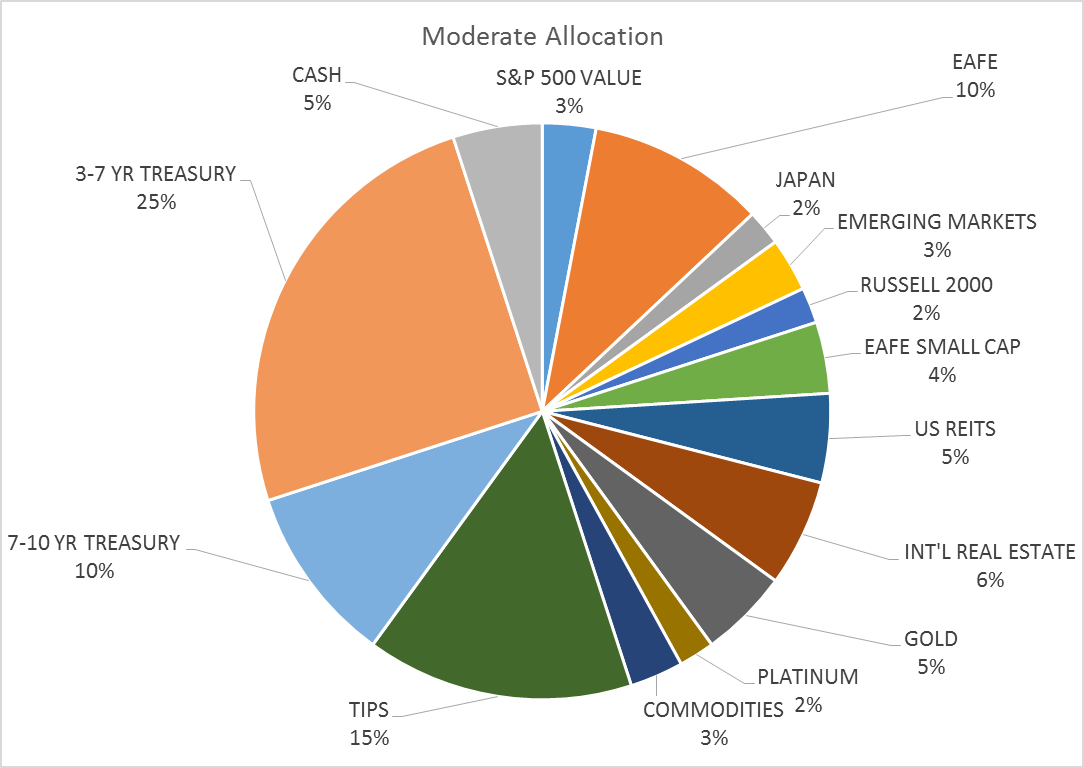
| The risk budget this month shifts slightly as we add cash to the portfolio. For the moderate risk investor the allocation to bonds is unchanged at 50%, risk assets are reduced to 45% and cash is raised to 5%. The changes this month are modest and may prove temporary but I felt a move to reduce risk was prudent given signs of exuberance – rational, irrational or otherwise. |
Moderate Allocation |
No one is investing in a co-working company worth $20 billion. That doesn’t exist,” Neumann says. “Our valuation and size today are much more based on our energy and spirituality than it is on a multiple of revenue.
That quote above is the CEO of WeWork, a “technology” company that leases office space. They aren’t leasing office space they own like a REIT but rather space they have leased at bulk rates. All they really are is a property management company with a hipster sheen. They do appear to be a successful property management company but a property management company nonetheless. The industry is not exactly new and the competition will surely respond. In the meantime, WeWork has convinced investors to pay 20 times sales to invest in their “energy and spirituality”.
What is WeWork really worth? I have no idea but I’m pretty sure the property management company should not be worth more than the properties it manages. WeWork has not cornered the market on cool build outs, month to month leases, bundled services (internet, reception, etc.) and Friday beer busts in a dorm-like atmosphere. But none of that matters in the current environment and that is why I felt a need to make a move this month.
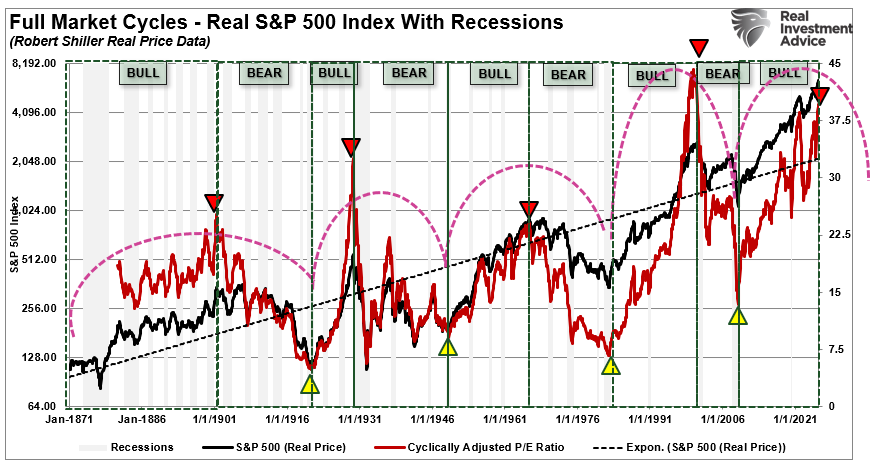
Stocks have been expensive for a long time. And as everyone seems eager to point out these days – as if it inoculates them from acting imprudently – valuation is not a good market timing tool. As a client recently pointed out, Alhambra has been saying that stocks are expensive since late 2013 so I’ve obviously proven that statement. I haven’t changed my mind by the way; stocks were expensive at the end of 2013 and they are expensive today. In fact, they are significantly more expensive today than they were then because earnings haven’t change appreciably during that entire time for the S&P 500 as a whole.
Private market valuations, such as for WeWork, Uber, etc., were frothy in 2013/14 as well so that hasn’t really changed. What does seem to have changed though is the attitude of the people investing in and running these “unicorns”. WeWork just announced the purchase of the NYC headquarters of Lord & Taylor for $850 million, a sum that is only about 30% above the value at which it was appraised just last year. It isn’t clear who exactly is buying the building, WeWork or their venture capital backers or both, but it will become WeWork’s headquarters now. I suppose they will surely make better use of it than Hudson Bay, the parent of Lord & Taylor, but one does wonder how and why a money losing company needs to spend $1300/sq. ft. for a Manhattan headquarters. Surely they could have found suitable space in any of the other 50 cities in which they operate at a much cheaper price. But then, that wouldn’t make a splash and keep people paying for their “energy and spirituality”.
WeWork isn’t the only silliness going on in markets. Bitcoin, the intrinsic value of which is objectively zero, is trading over $5700 as I write this although that could easily be $6000 or $7000 or $2000 by the time you read this. And Bitcoin is easily the most legitimate of the cryptocurrencies which are multiplying by the day via ICOs which may or may not entitle you to anything at all. The mania for all things crypto is most easily captured by Overstock.com, which, as the name implies, is a vendor of things no one, or at least not enough someones, wanted. They also have a cryptocurrency trading unit because, well, just because I guess. Well, actually, the best reason to have a cryptocurrency trading unit, even an unprofitable one like Overstock’s, is the impact on the stock price, not the bottom line. Overstock’s most successful product appears to be their own stock which is up 175% – since August.
More signs of craziness? How about Amazon spending $4.5 billion on streaming content? Or Netflix spending $6 billion? Or Apple spending $1 billion and still managing to screw up something as simple as Car Pool Karaoke? The Hollywood spending and the real estate splurges – Apple’s new headquarters is another example – is all reminiscent of the top of Japan’s bubble in the 1980s. If you are too young to remember that you really ought to Google Sony/Columbia Pictures or Mitsubishi Estate/Rockefeller Plaza. Bubbles always create excess and yes I think we are in a bubble, the third one of my career.
Sentiment measures all show a plethora of bulls and a paucity of bears. Investor’s Intelligence bull/bear ratio just hit its highest level since 1987. I’m not saying we are in for a crash like that but the parallels are a bit eerie from computerized trading to an administration trying to talk down the dollar. Most people don’t remember or never knew but the ’87 crash was really driven by the intersection of interest rates and exchange rate policy. It isn’t coincidence that the US Treasury Secretary threatened to devalue the dollar versus the German mark the weekend before Black Monday. Yes, portfolio insurance – as the algorithmic trading of the day was called – certainly exacerbated the decline but it was kicked off by irresponsible comments about the US dollar. If that doesn’t give you deja vu, nothing will.
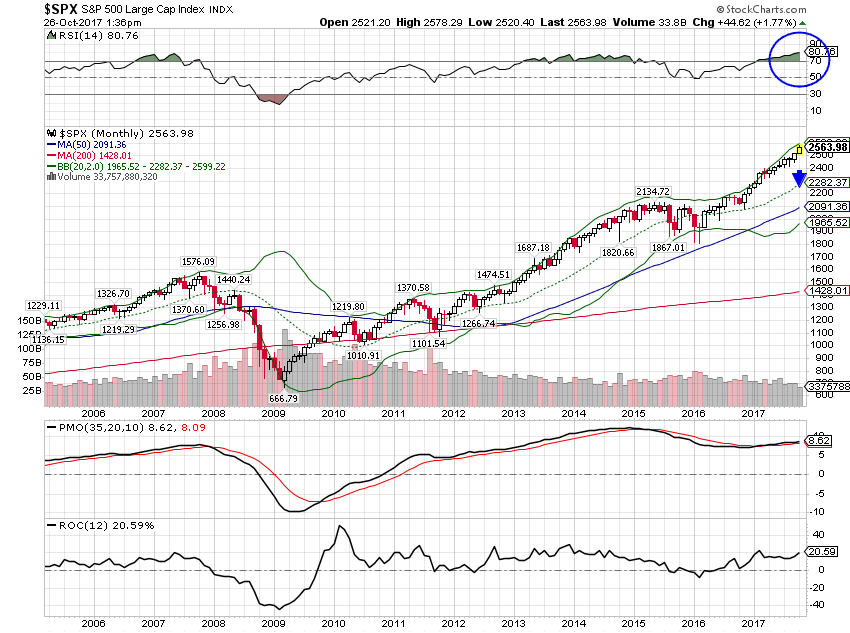
There is no major change in our indicators that prompts this month’s minor allocation change. The yield curve hasn’t done anything alarming. Credit spreads have widened only slightly from the recent cycle lows. Stock were expensive last month and they are only slightly more so now. None of the major trends we are tracking changed significantly. The only justification within our investment process that allows a change is momentum. Momentum isn’t just about buying what is performing the best recently. It is also about identifying markets that have moved to extremes of momentum. In this case, US stocks have marched higher so consistently that we are getting overbought readings that just don’t happen very often. Monthly RSI on the S&P 500 recently touched 80, a level not seen since the late 90s dot com run. A high RSI isn’t necessarily a negative and often after a pullback that resolves the overbought condition, markets go on to make more new highs. But it is a warning that recent performance is extreme.
At current valuations, US stocks are discounting a future that I just don’t see in our other market indicators. It may be that stocks have this right, that the US economy is about to boom and because of that possibility, I am not willing to make a big change in our allocation just yet. I don’t know how the tax reform debate will come out or what the impact on the economy will be. I have my opinions about both but that’s all. If tax reform is going to pass and have a big impact on growth it will surely show up in the bond and currency markets. So far, that hasn’t happened.
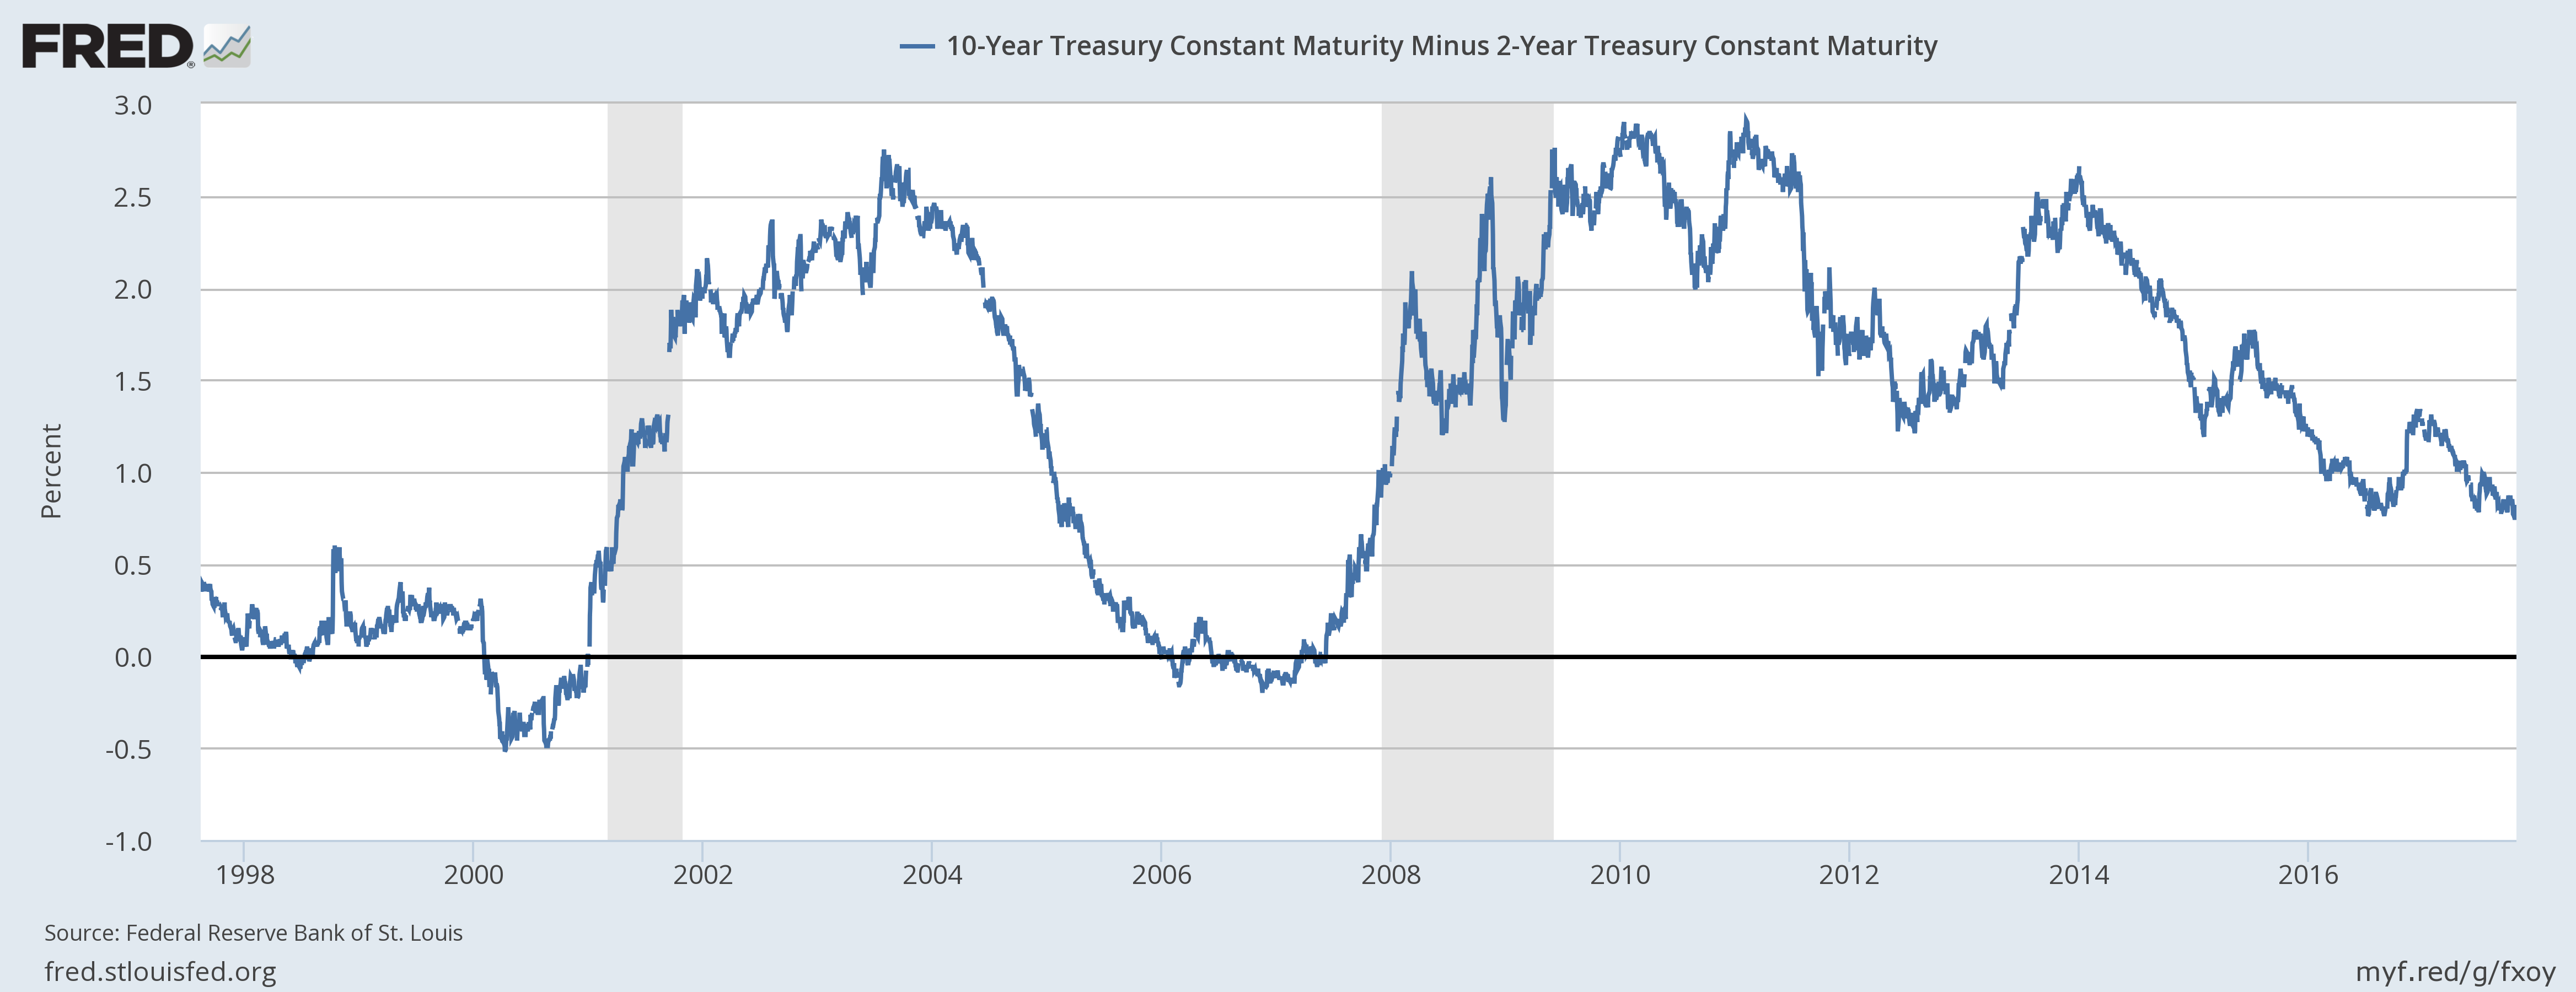
Yield CurveThe yield curve continues to flatten, 2 basis points since last month’s update. The 10/2 curve is now at its flattest level since the summer of 2016, the low so far for this cycle. At 82 basis points though it is far from flat or inverted so there is certainly room for more. As I’ve said many times though, we don’t know if it will get to flat before the next recession and what we are really looking for is a bull steepener where short rates fall faster than long rates. That would be a sign the market is anticipating or getting a reversal in Fed policy and that recession is imminent. So far, that hasn’t happened. There is nothing here indicating an acceleration in growth. |
US 10 Year Treasury Constant Maturity, 1998 - 2016 |
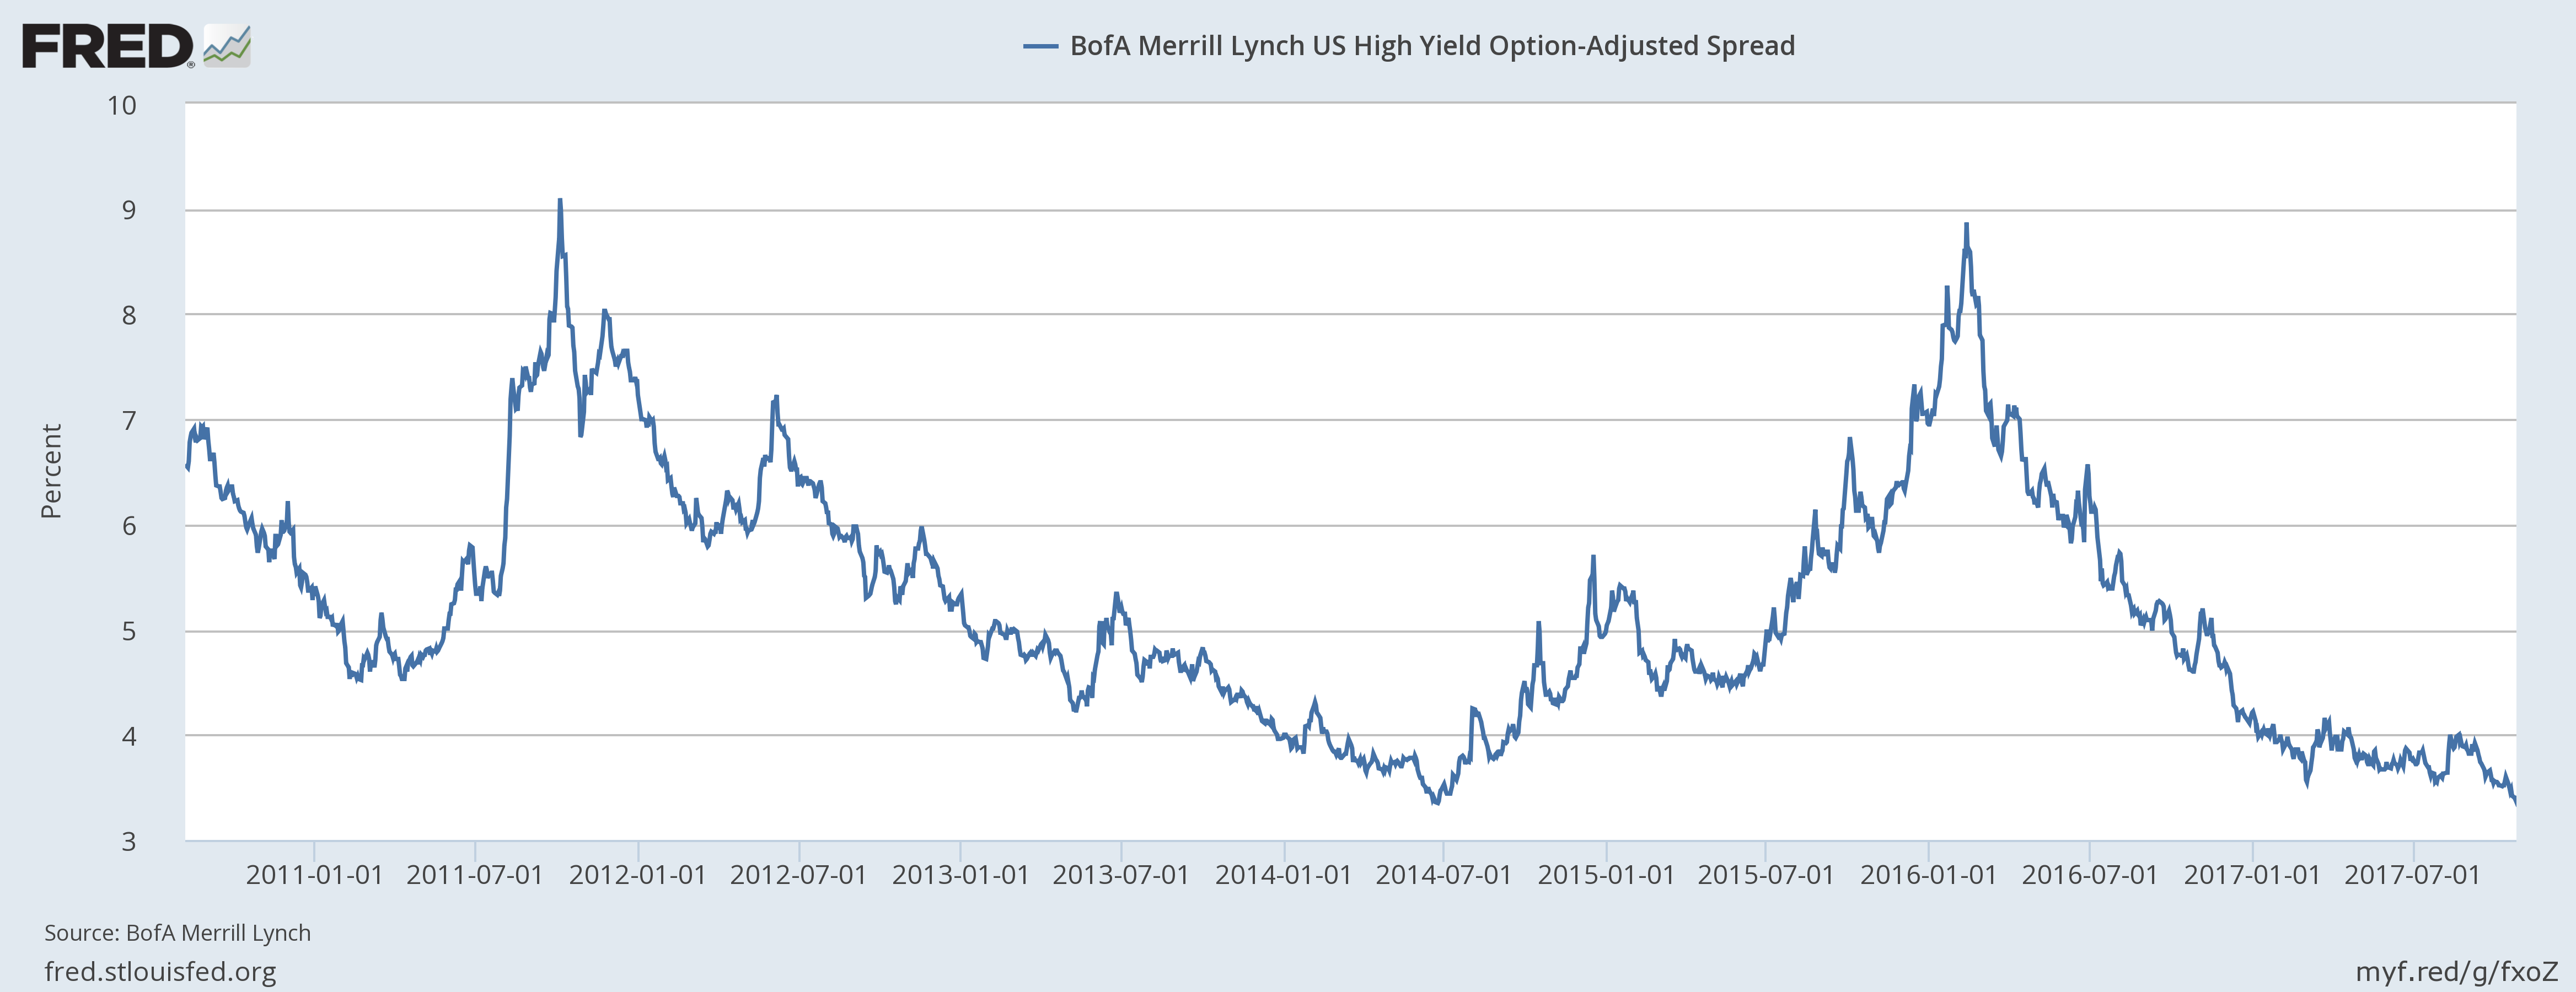
Credit SpreadsAnother indication that sentiment is getting frothy is credit spreads which narrowed by 24 basis points since the last update and are within a few basis points of the lows for this cycle in June of 2014. While there is still room for further tightening based on the previous two cycles lows, I would just point out that stocks were essentially flat from June 2014 to February 2016 as spreads widened to their recent peak. Stocks hit bottom when spreads hit their widest. Again, I’m not saying that will happen again and I have no indication that spreads are about to widen. There is nothing in this indicator that warns of a correction yet. All I’m saying is that investors are not exactly shy about taking on credit risk right now. |
US BofA Merrill Lynch High Yield Option, Jan 2011 - Jul 2017 |
ValuationsI really don’t know what else I can say about valuations. There is no argument that US stocks are cheap. There is little argument that they are even fairly priced – unless earnings and dividends are about to start growing at a rate that is entirely outside the experience of the last half decade. International markets are still fairly reasonable but that assumes the dollar remains well behaved. A rapidly rising dollar, as happened from 2014 to 2016 would put a crimp in global growth. But I don’t see any reason to expect that right now despite the rally we’re seeing after the ECB meeting this week. There may be some upside left but the trend for the dollar is still down. And that is relatively positive for foreign markets and economies. MomentumAs I said above, US stocks are quite overbought and due for a pullback at least. We don’t need a recession to get a correction of 5-20% but there probably does need to be some kind of catalyst. What that might be is anyone’s guess. |
S&P 500 Large Cap Index, 2006 - 2017(see more posts on S&P 500 Large Cap Index, ) |
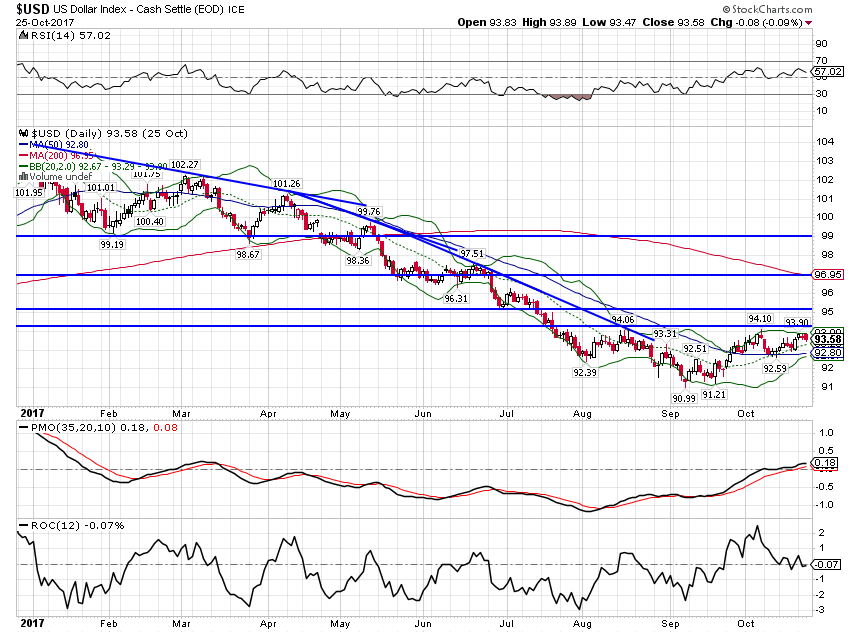
| The dollar downtrend, as I said last month, was due for a pause and that’s what we’ve gotten. The index is trading just over 94 as I write this (this chart won’t be updated until after the close) and a move to 95 isn’t out of the question. |
US Dollar Index, Feb - Oct 2017(see more posts on U.S. Dollar Index, ) |
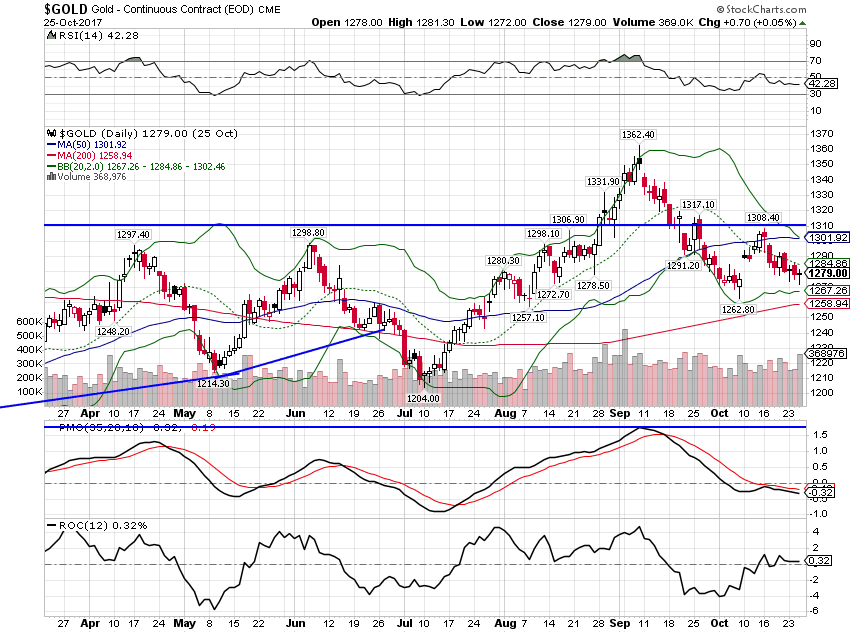
| Gold, as one would expect with some dollar strength, has pulled back some: |
Gold Daily, Apr - Oct 2017(see more posts on Gold, ) |
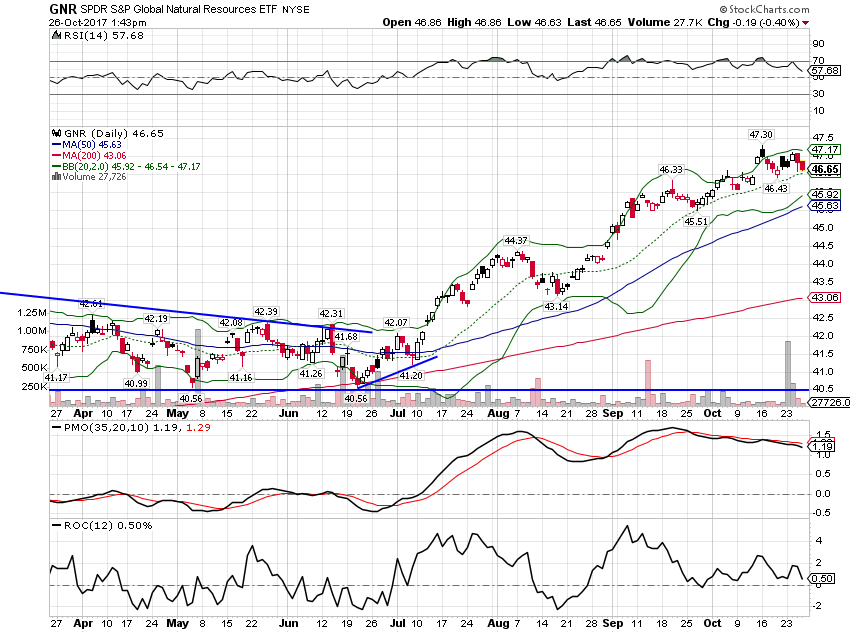
| Natural resource stocks are also losing momentum as the dollar corrects higher. |
S&P Global Natural Resources, Apr - Oct 2017(see more posts on S&P 500, ) |
| Despite the stronger dollar EAFE stocks are keeping up with the S&P 500. |
EFA:SPY Daily, Apr - Oct 2017 |
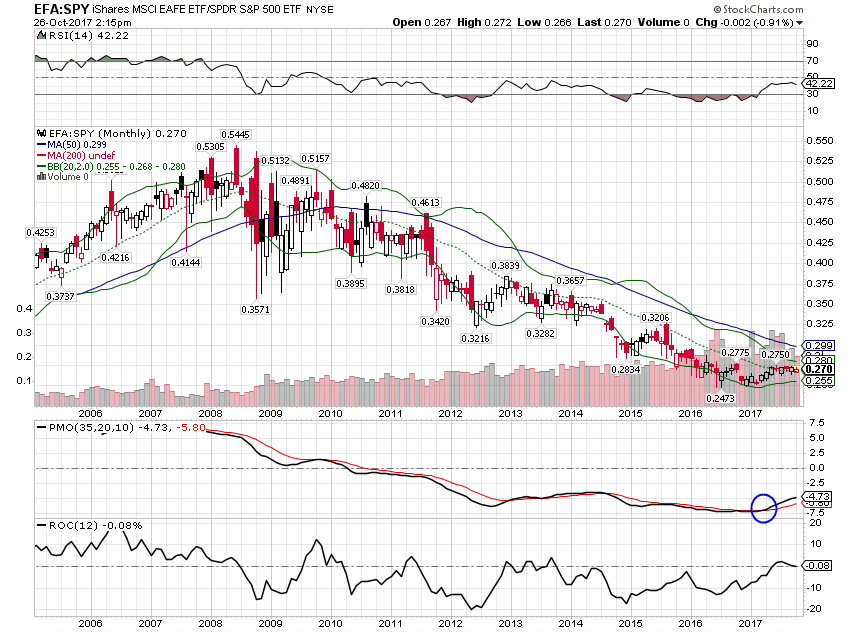
| Long term momentum still favors EFA vs SPY. |
EFA:SPY Monthly, 2006 - 2017 |
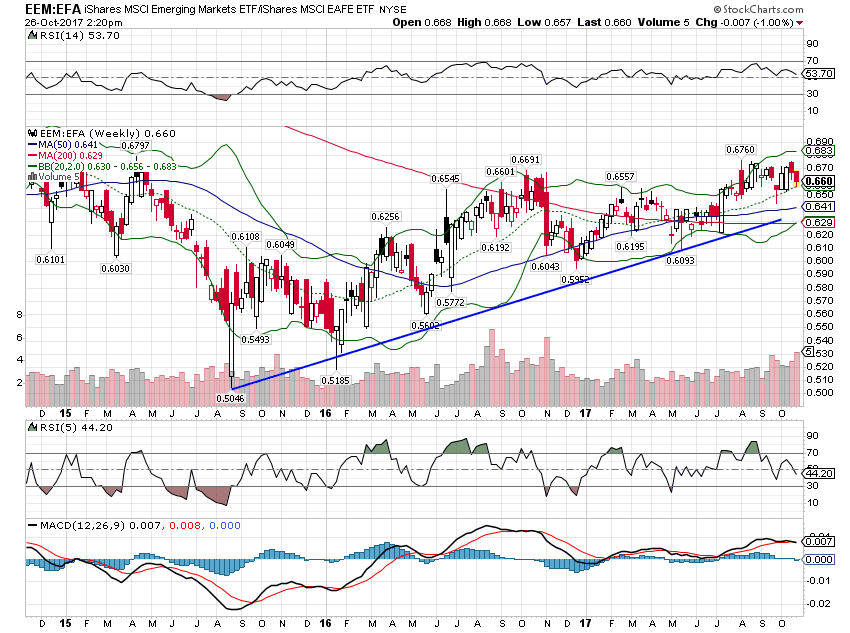
| The uptrend of Emerging market stocks versus EAFE is intact: |
EEM:EFA Weekly, Dec 2014 - Oct 2017 |
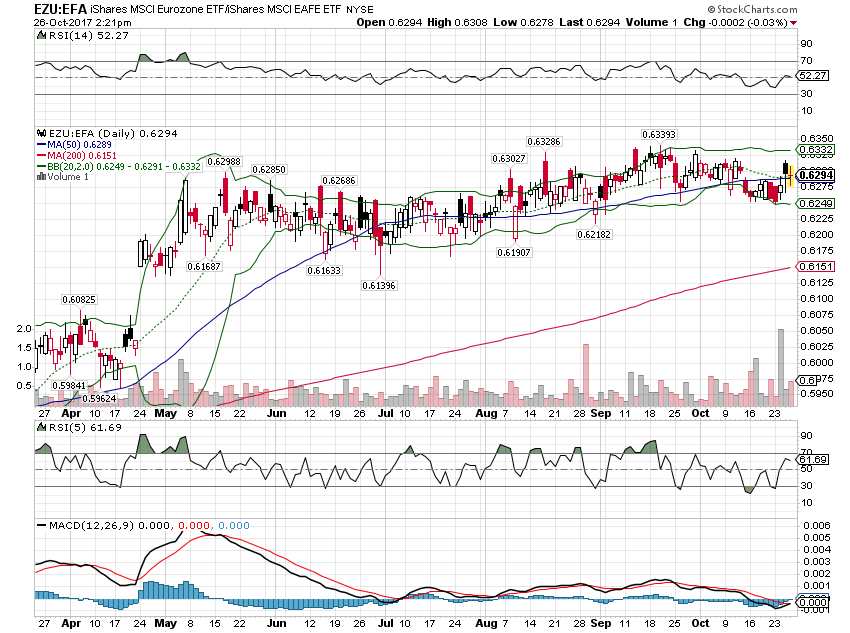
| European stocks are still leading the EAFE: |
EZU:EFA Daily, Apr - Oct 2017 |
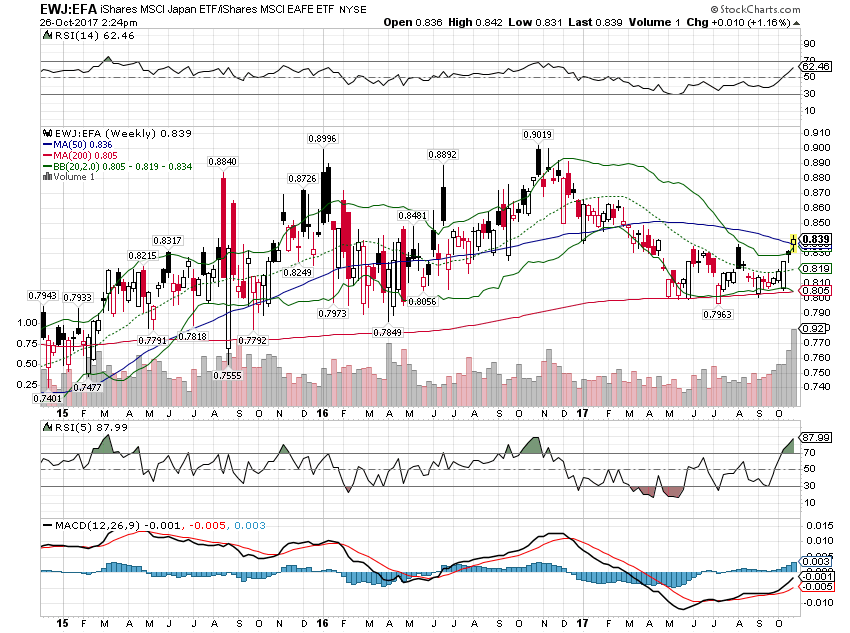
| Japanese stocks are resuming their uptrend versus EAFE after falling for most of the year: |
EWJ:EFA Weekly, Feb 2015 - Oct 2017 |
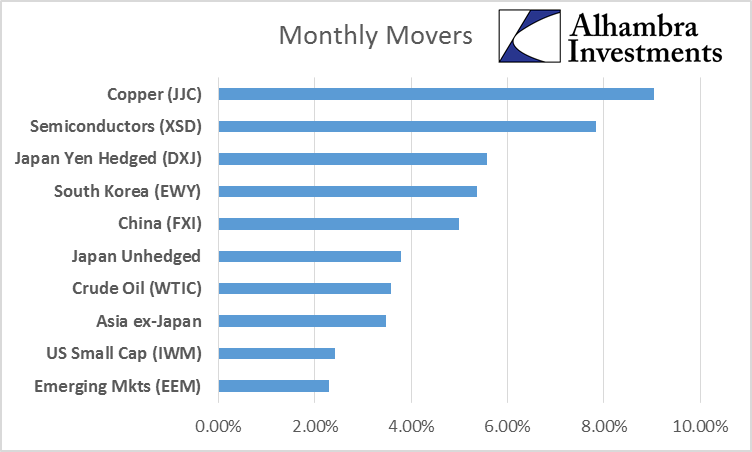
| The big movers for the month were Asia, commodities and technology: |
Monthly Movers |
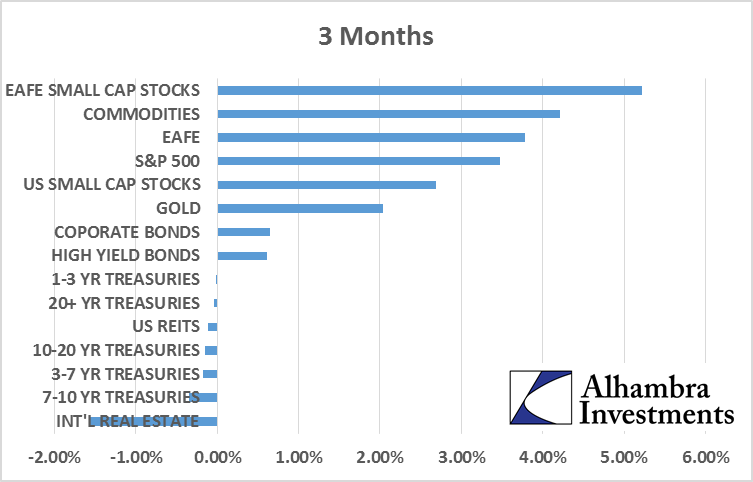
| Over the last three months the leaders have been stocks (international leading) commodities and credit: |
Monthly Movers |
| If the dollar continues to rally, there will likely be a shift in leadership. Bonds would be expected to improve as well as other interest sensitive areas like REITs. International stocks would probably start to lag a little in that case as well. But the degree of dollar movement matters and right now all we have is a countertrend move in a downtrending dollar.
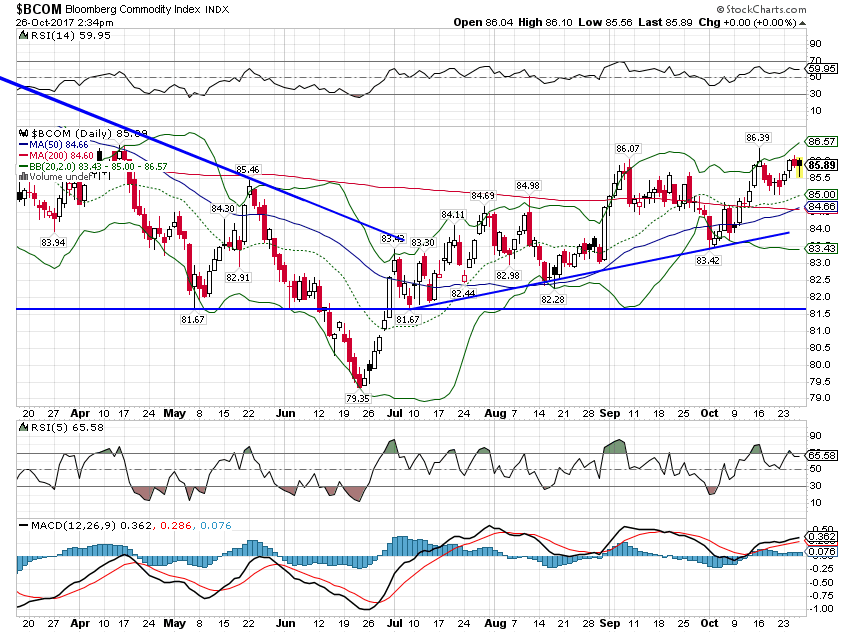
One last one. Commodity indexes continue to trend higher despite the recent dollar strength. Long term momentum turned positive in early 2016 and while it has been 3 steps forward and 2 steps back, the long term trend has turned. |
Bloomberg Commodity Index, Apr - Oct 2017(see more posts on Bloomberg Commodity, ) |
Portfolio changes
|
Moderate Allocation |
I think the greatest indicator of how frothy sentiment is right now is the difficulty I had in making the decision to reduce the risk allocation and raise a mere 5% cash. I struggled with this decision because I fear – yes, fear – not participating fully in the bull market. Intellectually, I know stocks are expensive and that the risk far outweighs the potential reward. But I also know that is no impediment to more gains, as we’ve already seen. I’m also cognizant of the fact that I am stretching the definition of momentum to keep this change within the parameters of our investment process. I am proud of the process we’ve developed here and I am confident it will perform fine across the entire market cycle, from bull to bear and back. But I also know that as investment advisers, we are bound not just to adhere to an investment process but to follow the prudent man rule. And under that standard it is hard to justify maintaining an investment in the S&P 500 right now.
This small move to reduce risk comes at a time of great uncertainty. The Federal Reserve is attempting to normalize – whatever that means these days – monetary policy. That involves raising interest rates and also shrinking their balance sheet. The impact of that on the economy and markets is highly uncertain. Even the Fed itself is unsure how QE affected things and so its unwinding is poorly understood as well. In addition, we have the complicating factor of President Trump naming a successor to Janet Yellen – which may be Yellen herself.
In addition to monetary uncertainty, we have fiscal uncertainty as Republicans try to thread the needle on tax reform. I have no idea how it will turn out, whether we will get significant tax reform or just something that gets that label. Based on what I’ve seen so far, I think the market may be disappointed if it doesn’t pass and possibly more disappointed if it does. Based on the realities of budget reconciliation, the economic impact of what is being discussed would be, in my opinion, pretty minimal. The tax cuts will be temporary and amount to roughly $1.5 trillion net spread over 10 years. There is ample research on the ineffectiveness of temporary tax cuts; one need look no further than the Bush cuts to see the evidence. And $150 billion a year is a rounding error in a nearly $20 trillion economy.
As I said at the top, this move may be temporary. If the overbought condition is relieved and there is reason to believe that economic growth will indeed increase sufficiently to justify a greater allocation to risk, I’ll be happy to reinvest the 5% we move to cash this month. But it would take a large correction in the S&P 500 for me to say with ease that I can buy it and still fulfill my prudent man responsibilities. An investment process is a necessary component of portfolio management but it doesn’t override our institutional responsibilities. History tells us that imprudent acts can, at times, be profitable but that does not make them prudent.
Full story here Are you the author? Previous post See more for Next postTags: Alhambra Research,Amazon,Apple,Asset allocation,Bitcoin,Bloomberg Commodity,Bonds,commodities,credit spreads,Cryptocurrencies,currencies,economy,Emerging Markets,Federal Reserve/Monetary Policy,Global Asset Allocation Update,Gold,Investing,Japan,Market Sentiment,Markets,Model Portfolios,momentum,newslettersent,Quantitative Easing,Real Estate,S&P 500,S&P 500 Large Cap Index,stocks,tax reform,Taxes/Fiscal Policy,U.S. Dollar Index,US dollar,valuations,Yield Curve


