| The hurricanes didn’t disappoint, causing major damage at least to the BLS. Precisely how much the statistics were affected by the disruptions in Texas and Florida really can’t be calculated, not that everyone won’t try. It makes this month’s payroll report a Rorschach test of sorts. You can pretty much make it out to be whatever you want.
|
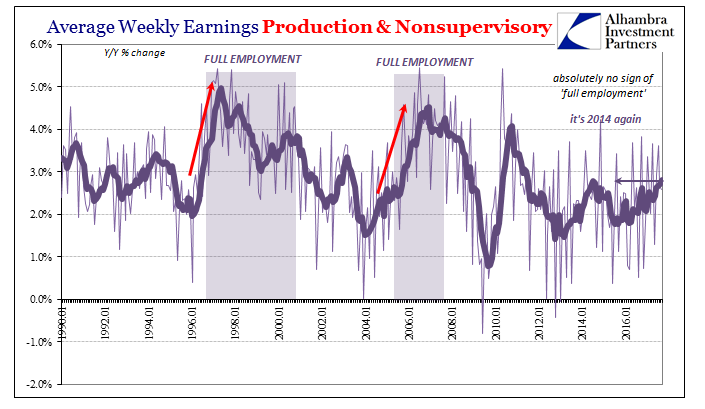
US Average Weekly Earnings, Jan 1990 - 2016(see more posts on U.S. Average Earnings, ) |
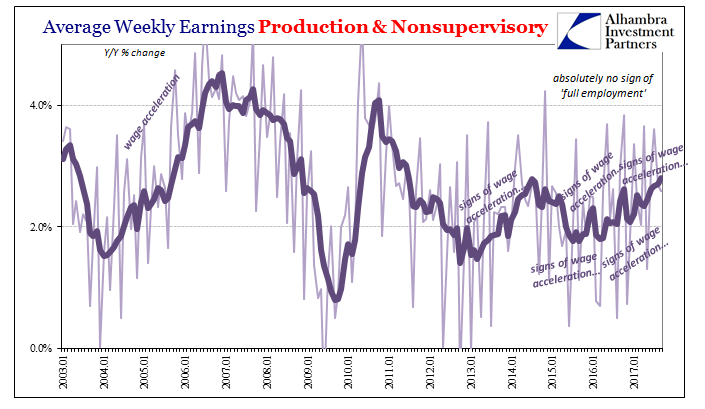
| In the early going, markets have made it about wages; or so they think. A slight rise in wage rates, which isn’t unexpected given the storm situation, is being extrapolated wildly into something closer to Janet Yellen’s most fervent dream. Wage inflation (not that it was really all that much) because of a labor shortage is what the FOMC has been waiting for. Wage inflation because of weather-produced bottlenecks is a more tricky interpretation. |
US Average Weekly Earnings, Jan 2003 - 2017(see more posts on U.S. Average Earnings, ) |
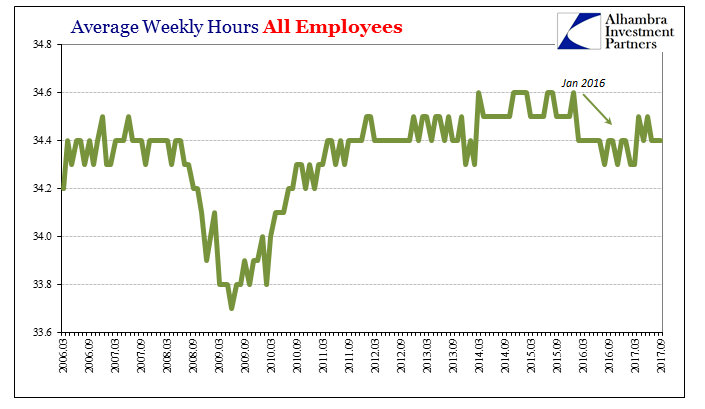
| In either case, that is as often the wrong thing to focus on. Even if we assume that wage rates are up because of a shortage, it wouldn’t trigger inflation without growth in hours. In other words, if people get paid more per hour but then work slightly fewer hours, the effect on earnings is almost muted; almost. Growth in average weekly earnings are in August about equal to where they were in the summer of 2014.
That’s hardly the inflation indication it is made out to be simply because it is the same inflation indication it has been constantly made out to be. Average weekly earnings in September were up just 2.6% year-over-year, less than the 6-month average for the second straight month. |
US Average Weekly Hours, March 2006 - Sep 2017 |
| Again, we don’t really know what the headline payroll figure might have been if there had been no disruptions from Mother Nature. Thus, the -33k can be set aside. Instead, we should focus on prior months where no such distortions are present.
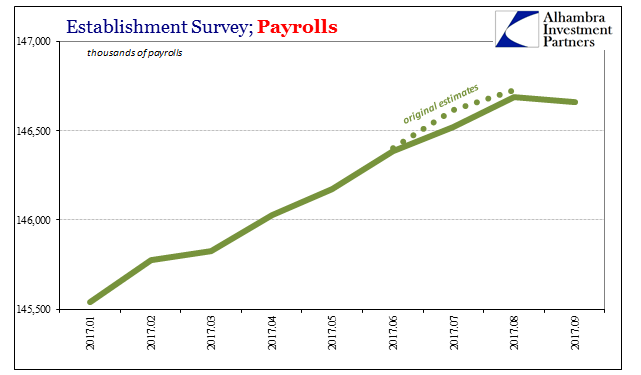
The BLS has revised downward the Establishment Survey for the past three months; a few substantially. The monthly gain for July 2017 was originally reported as a solid +209k. As of the latest update, the monthly gain stands at just +138k, which had it been released that way in early August would have produced a starkly different prevailing mood. It was far more in line with the August 2017 report, released in early September, one that did thoroughly disappoint across-the-board. |
US Establishment Survey, Jan - Sep 2017 |
| In other words, the August report wasn’t an isolated case at all, it was, as of these revisions, slightly better than the July report.
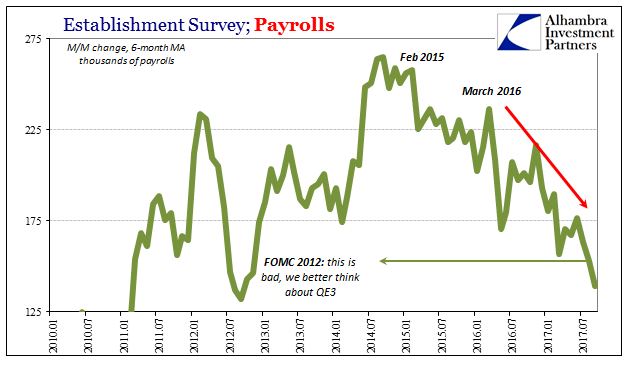
As I wrote yesterday, weakness in the labor market is not something that appeared with the gale gusts of Harvey. It has been looming over the economy all year; more than that, for several years now. The 6-month average gain, which is what you really should be looking at, is down to +139k for September. If you don’t wish to include the -33k because of its clear irregularities, fine. The 6-month average updated for August was just +153k. |
US Establishment Survey, Jan 2010 - Jul 2017 |
| That would have been the lowest average gain since 2012, right around when the Fed was increasingly desperate in their debate over a QE3 rescue for the near-recession of that time. The September number merely pulls it down a little more toward the lowest average gain since the initial, inordinately weak recovery from the Great “Recession.”
I still believe even this low average is overstating the payroll environment for the huge jump in 2014 that can’t be found anywhere else. The BEA’s estimates for GDP certainly suggest as much (low and often negative labor productivity), as does their statistics on national or aggregate income. |
US Real Personal Income, Jan 2010 - Jul 2017(see more posts on U.S. Personal Income, ) |
| These trends will be obscured by the rest of the payroll reports, particularly the Household Survey. The unemployment rate fell to a preposterously low 4.2% because this latter employment measurement recorded a massive surge in full-time employees; alongside a gain still in part-time employees. At +935k just in September, it was one of the largest gains in the full-time category going back decades. |
US Household Survey, Jan 1989 - 2017 |
It appears to be almost certainly a statistical artifact of hurricane-driven interruptions (employers paying employees under-the-table? It might start to explain why employers told the BLS they were employing fewer, but more employees telling the BLS they are working full-time). Who knows what the actual number is, would have been, or whatever else. You can pretty much feel about it however you like.
My analysis hasn’t changed (shocking, I know). The economy in 2017 was disappointing before the end of August. Maybe the hurricanes will help change that as they might in the auto sector, or they might end up proving Bastiat’s parable of the broken window for the umpteenth time (in a few months a great many Americans in Texas and Florida are going have their insurance premiums adjusted).
Nothing ever goes in a straight line, not the least of which because there are always storms and interruptions. It’s a bit weird, however, in light of the past few years where winter storms were a cause for dismissing weakness that was now in favor of summer hurricanes that might somehow fix all the labor problems that weren’t supposed to have existed.
Tags: average weekly earnings,average weekly hours,currencies,economy,employment,establishment survey,Federal Reserve/Monetary Policy,harvey,household survey,hurricanes,irma,jobs,Markets,newslettersent,payrolls,U.S. Average Earnings,U.S. Personal Income,unemployment rate,wages


