| – 10 year anniversary of pre-Global Financial Crisis market peak in S&P 500 on October 9th – Gold up 74% since the last market peak a decade ago; 11% pa in USD, 9.4% pa in EUR and 12.4% pa in GBP – Precious metal has climbed $736/oz on Oct 9th 2007 to $1278.75 ten-years later – S&P 500’s 102% climb is thanks to asset-pumping policies by central banks, rather than value – Gold’s performance is slowly forcing mainstream to re-consider gold – “Notion of gold as a hedge against serious risk aversion is true… ” – Bloomberg analystEditor Mark O’Byrne |
Gold Price Performance, 2002 - 2017(see more posts on gold price, ) - Click to enlarge |
| Ten years ago last week the U.S. stock market hit a peak before crashing during the financial crisis. That now seems a like a distant memory but with stocks making new record highs every day recently, it is prudent to step back and evaluate the long term performance of assets and indeed the outlook in the coming years.
Today the S&P 500 continues to make headlines as it repeatedly reaches new highs, most notably in September as it pushed past 2500 despite North Korean/Trump war drums. Quietly in the background gold has been putting in its own stellar performance. Although few would have known, given the lack of interest most market participants have paid to it in recent years. |
Gold Price in USD, Jan 2008 - 2017(see more posts on gold price, ) - Click to enlarge |
| Since the last peak of the S&P500 the precious metal, and ultimate hedge against inflation, has climbed over 74%.
After massive gains during the financial crisis, it fell quite sharply in all currencies in 2013 prior to consolidating at lower levels in 2014 and 2015 and then eking out gains again in 2016 and so far in 2017. This puts gold in the top five of best performing assets in the last ten years. |
Total Return of Assets - Click to enlarge |
| In the year-to-date gold has almost been in line with the S&P’s ongoing rally. Both remain in the top 10 performing markets, with an increase of 13.41% and 14.14%, respectively. |
Year to Date Relative Performance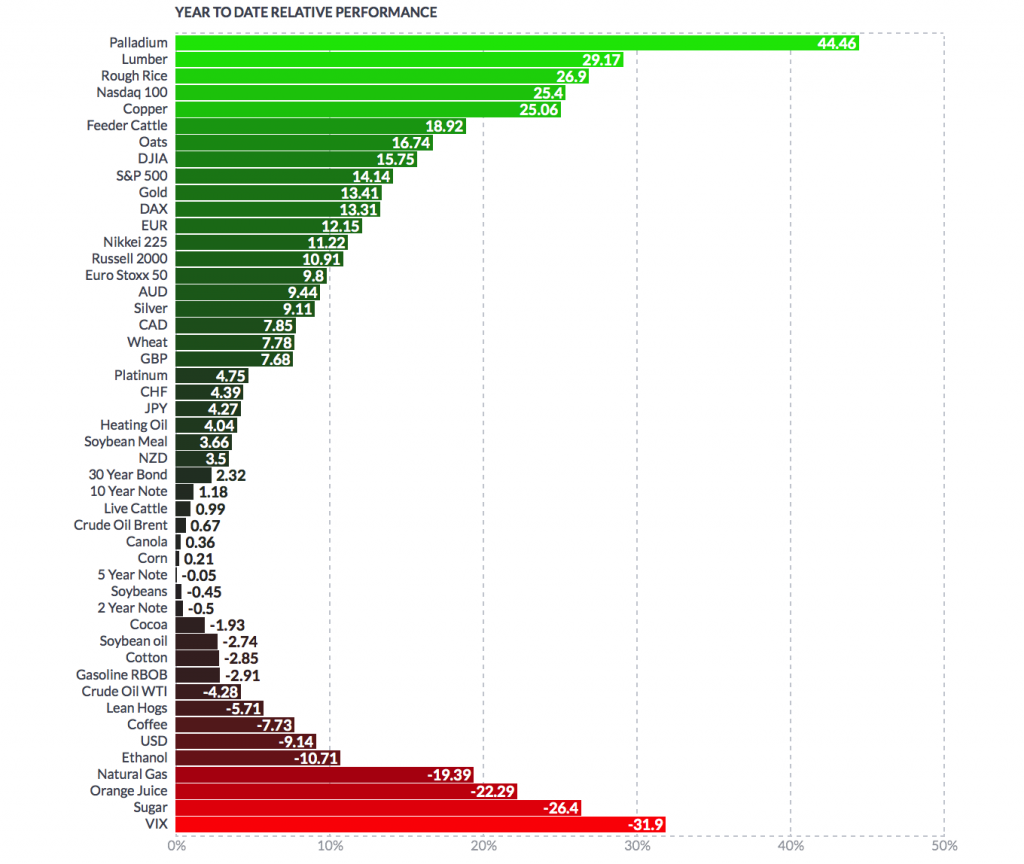 - Click to enlarge |
| Much of the chatter regarding the S&P’s recent performance is surrounded by whispers of concern. Some commentators wonder if equity markets are now entering the ebullient phase that we often see towards the end of bull markets and ahead of market peaks.
This is likely to be the case, but what does this mean for gold which has also had an excellent decade? Many mainstream analysts have been forced to reconsider their take on gold. An asset which, in their opinion, should not have performed so strongly against a backdrop of low inflation and strong, coordinated global growth. How did the S&P500 recover to such highs? |
S&P 500 Index Total Return, 1930 - 2017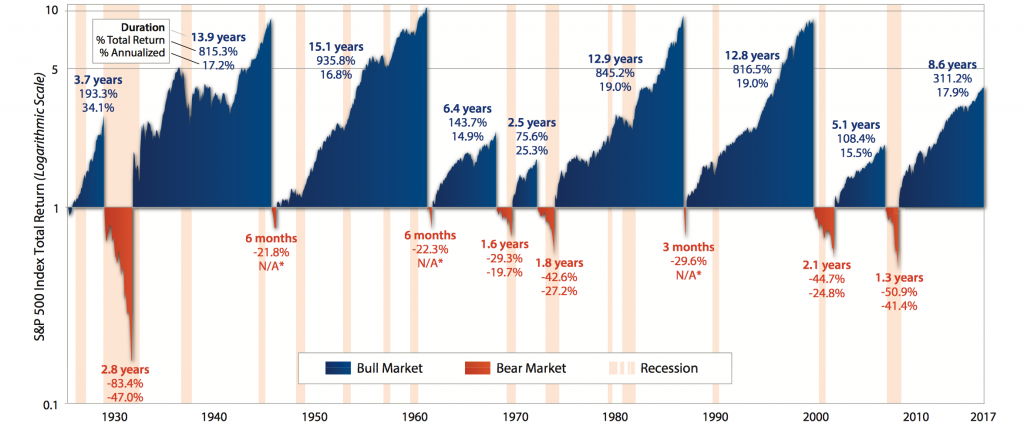 - Click to enlarge |
According to the above chart produced by First Trust, this current bull run in the S&P500 is not particularly remarkable. The average bull market has lasted 9 years with an average cumulative total return of 472%.
At the moment markets are still riding a wave of optimism, much of which seems based on the somewhat unexpected Trump Bump. Investors are either optimistic or relieved in terms of what he may do or hasn’t done already.
But the market hasn’t only been climbing thanks to Trump’s victory, it was already climbing for over seven years prior to his inauguration.
This bull-run is ultimately thanks to the ultra-loose monetary policies from major central banks.
The Federal Reserve used “QE bond purchases” to purchase assets in order to increase bond prices and reduce interest rates. The primary aim was to prevent a further crash in the housing market and indeed stock markets, it worked. However the Fed has made markets addicted to QE and they have been unable to stop the massive cash injections.
Quantitative easing has massively distorted asset prices. Just take a look at benchmark Spanish and Italian 10-year government bonds where yields have fallen from 6-7 per cent in July 2012, to below 2%.
It is unbelievable that investors are celebrating this state of affairs by pumping more money into the equity markets. Global growth is still slow, there is low U.S. productivity growth and rising inequality.
Inflation is beginning to tick higher both in the UK and the U.S. and many key property markets, such as London and New York city, are slowing down
One might say that we are seeing a stock market in a state of euphoria.
Will it last?
In a word: no.
Historically bull markets go out with a nice bang rather than a drawn-out whimper. They also like to go ‘bang’ right after they have shone at their brightest. Given the S&P500 has already outperformed analysts’ expectations for the end of 2017, one might ask if we are now seeing some serious glow.
What will trigger the last swan song of this market? There is little a bull market fears above a recession.
As explained above, the rally is thanks to QE. As the year goes on more central banks are expected to tighten monetary policy. But, there is a concern that investors are ignoring/misreading signals from central bankers or (worse) central bankers are failing to estimate the dangers of withdrawing stimulus and the recession it will likely trigger.
Citigroup recently expressed concern about how markets may react to quantitative tightening, in a research note, stating “even small balance sheet adjustments may create outsized responses in markets – especially when several central banks are adjusting policy simultaneously”.
This is of particular concern when one considers the high valuations in both global bond and equity markets (note, the S&P500 isn’t the only one having a good run). As Citigroup also notes, withdrawing stimulus “would be less disruptive if market valuations were fair rather than expensive”.
A September survey of Bank of America hedge fund managers saw the largest net increase in those who had bought hedges against a market downturn, in over a year. So fearful are they of a severe sell-off, respondents showed their biggest underweight position in US stocks since November 2007.
Meanwhile cash holdings were above the average of the past decade.
Gold has done very well despite the massive bull market in stocks. This is largely due to concerns regarding loose monetary policy by those aware of gold’s hedging and safe haven properties. If this is about to be reined in, what should we expect for the future performance of gold?
Gold “really is a good hedge”
One of the joys of gold’s stellar decade-long performance is the manner in which it has forced the mainstream to confront their prejudices.
It is not unusual for mainstream analysts to dismiss gold’s role as a hedge against multiple risks including inflation, recession and devaluation. But there is a change in the wind, helping gold’s cause.
Last week Bloomberg’s Macro Man (Cameron Crise) decided to really look into the stats and ask whether or not gold really is a good hedge.
I used the CBOE Volatility Index (VIX) as a proxy for market risk aversion and ran a series of multifactor regressions to determine whether equity volatility is statistically significant as an explanatory variable for gold.
The answer, somewhat to my surprise, appears to be yes.
…the VIX appears to be a significant statistical driver of changes in the gold price over a meaningful period of time. Based on this evidence, it looks as if claims of gold as a risk-aversion hedge might be true.
Why does this matter given what we have just been discussing? Currently Wall Street’s fear gauge, the VIX, stands just above its lowest level in two decades. But evidence (such as the BAML) survey shows that some fear is seeping into the market.
This is good news for gold, especially when one considers historical episodes of increased risk aversion.
Crise looked at the following:
|
Equity Volatility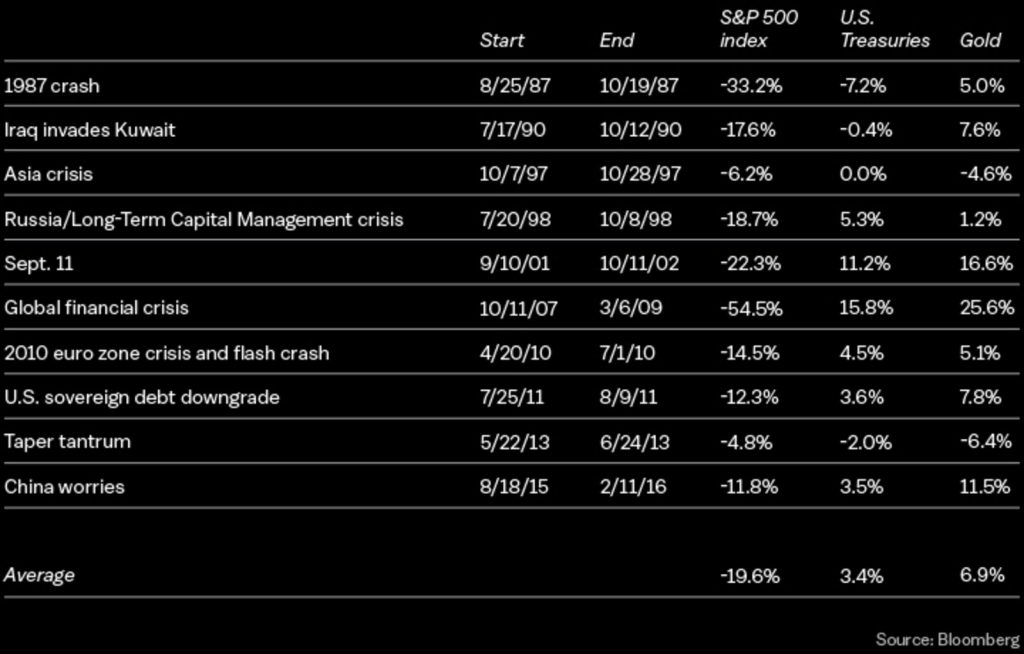 - Click to enlarge |
| Gold’s vital role in a portfolio
This is good news for those of us looking to hold gold in our portfolios. We have brought many examples to you (both academic and anecdotal) of gold’s safe haven role in investing. Crise’s work is yet another to add to the growing list of support for the precious metal’s vital role in portfolio insurance. Crise constructed two sample portfolios to test gold’s resilience and returns in a portfolio:
|
Portfolio Performance, Jan 1987 - Sep 2017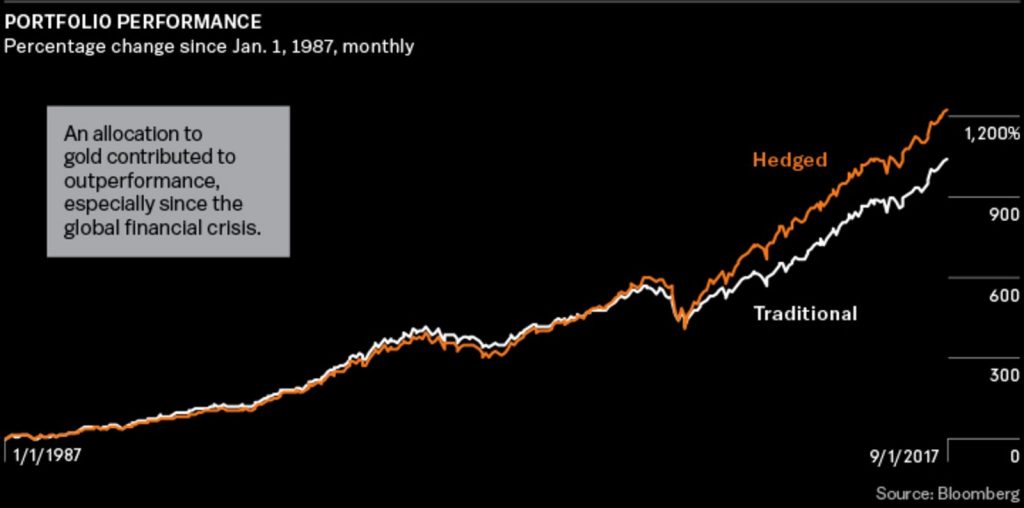 - Click to enlarge |
| Conclusion
For the past few years market bulls have been overjoyed to experience monetary stimulus and surging valuations. Now they cannot afford to ignore a reduction in stimulus against a backdrop of over-the-top valuations. Investors also cannot afford to ignore what is about to happen. Wealth management schemes and pension plans have a huge amount of cash wrapped up in equity markets. Savers would be wise to consider the forthcoming risks and consider re balancing and allocating funds to gold in order to protect their wealth and portfolio. The S&P500, along with other markets, may well continue to run for some time. History shows that equity bull markets have run for longer. Yet, on a host of metrics it looks very overvalued indeed and vulnerable to a sharp correction or indeed a crash. At the moment much rests on the unlikely scenario of central banks not going through with their threats to raise rates and for global growth to continue its current synchronised rise. Gold has performed incredibly well next to an asset class which it perhaps wouldn’t have been expected to do so well against. This does not mean that the two are complementary in their behaviour. Instead investors must consider the factors that drove the S&P 500 to such highs and how well gold will perform when they are no longer there. This scenario sounds like it is already making more prudent, smart money investors nervous, a situation that bodes well for gold in the coming months and years. |
S&P 500 Price to EBITDA, 1990 - 2019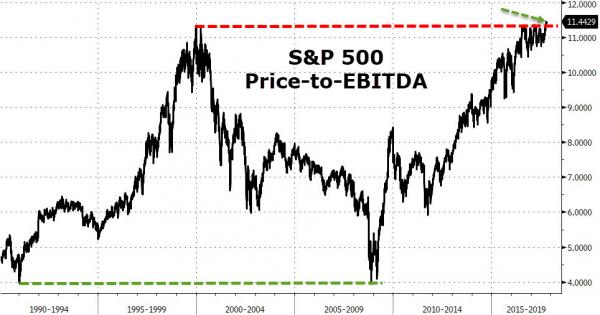 Source: ZeroHedge - Click to enlarge |
Tags: gold price,newslettersent,S&P 500,Weekly Market Update