


Jeffrey P. Snider
My articles My offerMy siteAbout meMy videosMy books
Follow on:LinkedINTwitterSeeking Alpha
During the middle 2000’s, one more curious economic extreme presented itself in an otherwise ocean of extremes. Though economists were still thinking about the Great “Moderation”, the trend for the Personal Savings Rate was anything but moderate, indicated a distinct lack of modesty on the part of consumers. In early 2006, the Bureau of Economic Analysis calculated that the rate had been negative for all of 2005. It was the first time in seventy years that had happened in the US.
As puzzling as that was for economists, it happened again in 2006. Unsure of what to make of it, the Wall Street Journal asked in July 2007 Is The Negative Savings Rate A Negative For The Economy?
In 2006, the national personal savings rate calculated by the U.S. Department of Commerce was around negative 1%. It was the second straight year that the measure indicated Americans are spending all of their after-tax dollars and then some. In 2005, the savings rate was negative 0.4%.
As a wave of baby boomers approaches retirement, some economists see significant risks in Americans’ apparent inability to sock away any savings. Others argue that worries over scant savings are overblown.
The reason even economists, who almost always argue in favor of debt-financed consumption, were split on the condition was history. The last time the US experienced a sustained drawdown in aggregate savings was in the years 1932 and 1933, the utter worst of the Great Depression and hardly the period with which you might want anything in a contemporary economy to be equivalent to.
The reason for the negative savings rate in the 2000’s was as simple as it was in the 1930’s; in the prior period it was the lack of income (and liquidity, due to bank runs and deposit losses) forcing the unemployed to spend more of what they had literally saved; during the housing bubble, it was home-equity-as-ATM’s.
Rapidly rising stock and house prices, fueled by an accommodative environment of low interest rates and a proliferation of “exotic” mortgage products (loans with little or no down payment, minimal documentation of income, and payments for interest-only or less) have sustained a boom in household spending and provided collateral for record-setting levels of household debt relative to income.
| That passage wasn’t written by some Ron Paul-type Fed critic, it was actually written by the Federal Reserve Bank of San Francisco in its collection of Economic Letters published in November 2005. At least some parts of officialdom were uncomfortable with the “spendthrift” extreme.
Revisions to both income and spending figures have over the years erased this one, or at least the degree of it. No longer is it believed that the Personal Savings Rate was ever negative at all. The current benchmark series shows the lowest at just less than 2% in July 2005 (but it might be hugely revised next month, so who really knows?). |
US Personal Savings Rate, Jan 2000 - 2017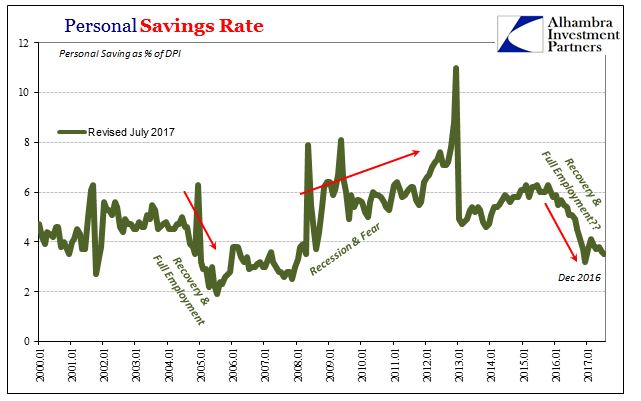 - Click to enlarge |
| The topic is once again relevant for its recent history. The Personal Savings Rate (admittedly after drastic revisions in July) has dropped considerably again, though to around 3.5% and as yet nowhere near housing bubble euphoria, negative or not. The question is how to interpret this clear change. |
US Personal Savings Rate, Dec 2013 - Jun 2017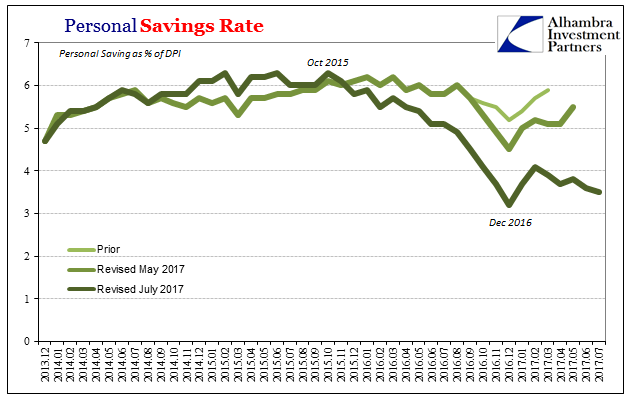 - Click to enlarge |
| Is it like the middle 2000’s if to a less alarming extreme, the embrace of debt by consumers and therefore confidence about recovery conditions? Or might it be more like the early thirties, where the ability to spend intersects negatively with the need/desire to? |
US Consumer Credit, Jan 2012 - 2017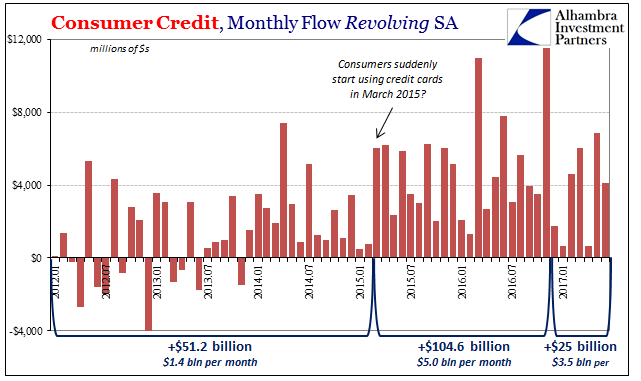 - Click to enlarge |
| In terms of revolving consumer credit, largely credit card debt, there is a clear increase in its use starting around March 2015. This was just after the BEA figured the “best jobs market in decades.” Consumer confidence had also surged in 2014 along with the rise in monthly Establishment Survey payroll gains. Officials in later 2014 and early 2015 grew more concerned about overheating than continued downside risks.
But all that was short-lived, as we know. The economy instead of revving up into full recovery as predicted fell further apart almost to full recession (that wasn’t more completely revealed in things like GDP until that series, too, was pegged to new benchmark revisions). It was a serious enough downturn that it dragged lower the labor market with it – both volume (payroll gains slow) and aggregate income. |
US Real Personal Income, Jan 2010 - 2017(see more posts on U.S. Personal Income, )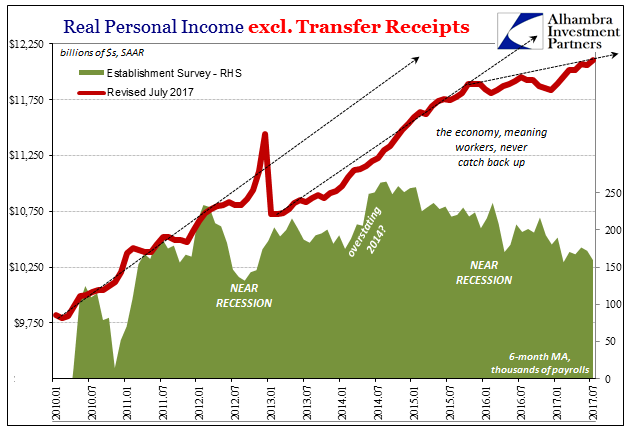 - Click to enlarge |
| It suggests more so that consumers were turning to credit cards out of necessity rather than confidence over their future prospects. The relationship between hours worked and revolving credit use has been clear enough; both in the downturn and the lagged “reflation” after it. |
US Consumer Credit, Jan 2010 - 2017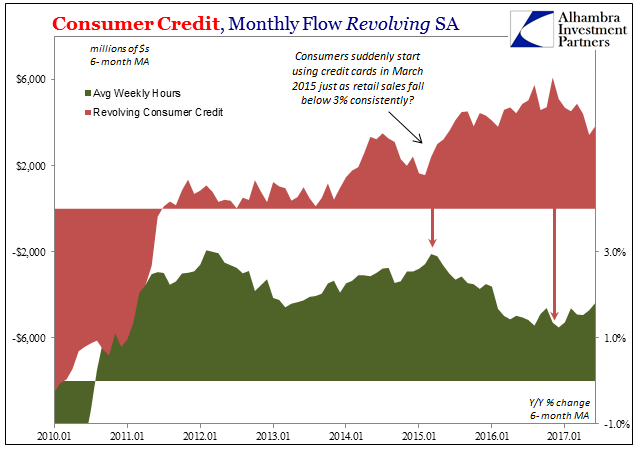 - Click to enlarge |
| As growth in labor utilization (hours) decelerated after the first phase of the “rising dollar” period, that is when credit cards (at the margins) suddenly became indispensable payment/spending tools. That trend lasted until November 2016, almost exactly coincident to the (so far) end of the slowdown at least in hours. In 2017, growth in utilization has ever so slightly accelerated while credit use has expanded much less blatantly (though still more than before March 2015). |
US Consumer Credit, Jan 2010 - 2017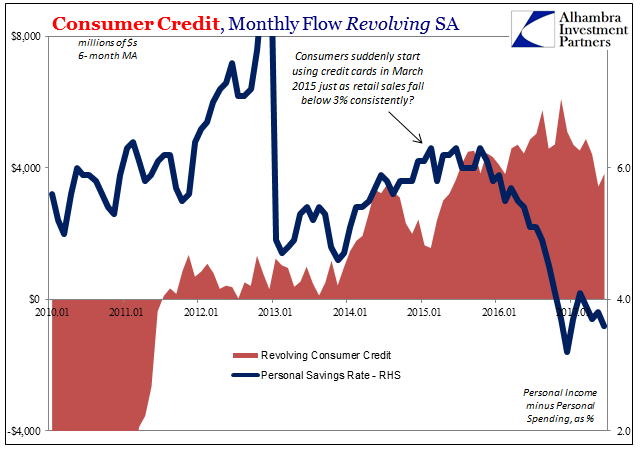 - Click to enlarge |
| It is all-too-consistent with so many other economic accounts and the collected interpretation of them; that there isn’t real improvement in 2017 so much as less negative economic pressure or negative factors on the whole mess. The reduced savings rate has more the tinge of the thirties (though, obviously, nowhere near the desperation) than the carefree attitudes the San Francisco Fed once criticized for the housing mania. It doesn’t signal recovery so much as the after-effects of further distress (“rising dollar” was a serious economic setback).
It leaves us again with what I wrote earlier with regard to another disappointing payroll report:
|
US Deflator Inflation, Jan 2016 - Jul 2017 - Click to enlarge |
| The ongoing underperformance of inflation is part of that unfulfilled mandate. The PCE Deflator was estimated this week to have slowed for the fifth straight month in July, painting “rate hikes” as further and further from reality (and data dependence, apart from the unemployment rate). At 1.40% year-over-year, it couldn’t even manage a one-month reprieve like the CPI did for the same month (another oil price base effect not because WTI was up in July 2017 but because it was down in July 2016). Apart from the two months earlier this year, the Fed has missed its own explicit target in 61 out of the past 63 months. |
Chain-type Price Index, Jan 2008 - Apr 2017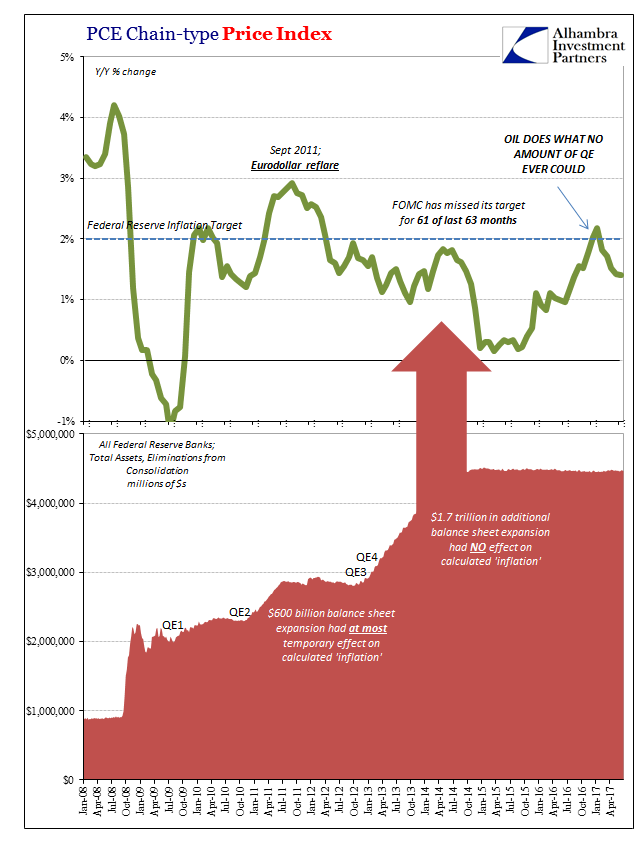 - Click to enlarge |
| At what point is the Fed made to own up to this rather obvious and important monetary violation? At what point do people start to realize that this, together with bond rates and eurodollar futures, tells us exactly what is wrong with the economy so that credit cards are becoming a (dangerous) last ditch consumer backstop again?
Populism hasn’t been built on xenophobia and racism, but on economic ineptitude at all levels, including the ability of the so-called establishment to accurately describe what has really been going on for ten years. It has been these past two or three, however, where those descriptions really stand out for being of an imagined world. Things are hard out there at the margins of this economy (which aren’t small, given the 15 or 16 million potential workers who slipped through the cracks of this narrative), and there is every reason to suspect apart from a brief reprieve late last year or early this year that hasn’t changed. |
US Markets & Economy, March 2012 - Feb 2017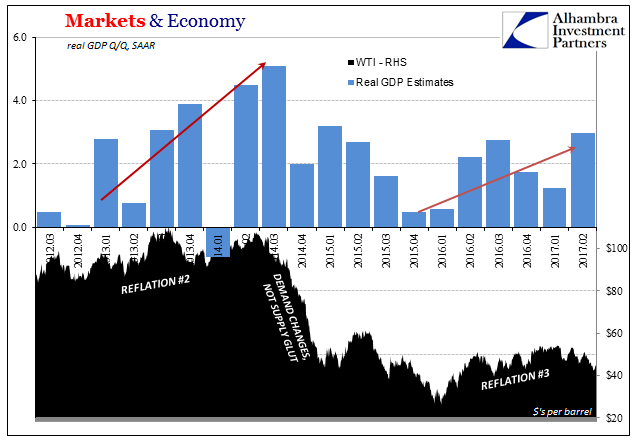 - Click to enlarge |
Tags: Consumer Credit,credit cards,currencies,economy,Federal Reserve/Monetary Policy,Great Depression,housing bubble,inflation,Markets,newslettersent,pce deflator,personal savings rate,revolving credit,U.S. Personal Income


