Jeffrey P. Snider
My articles My offerMy siteAbout meMy videosMy books
Follow on:LinkedINTwitterSeeking Alpha
| Of all the high frequency data the Personal Savings Rate is probably the least reliable. It is subject to both regular and benchmark revisions that can change the estimates drastically one way or the other. One step up from that statistic is the figures for Construction Spending. The initial monthly estimates don’t survive very long, and lately they have been quite weak in the first run only to be revised sharply higher over subsequent months. |
Total Construction Spending, Jan 1994 - 2017(see more posts on Construction Spending, )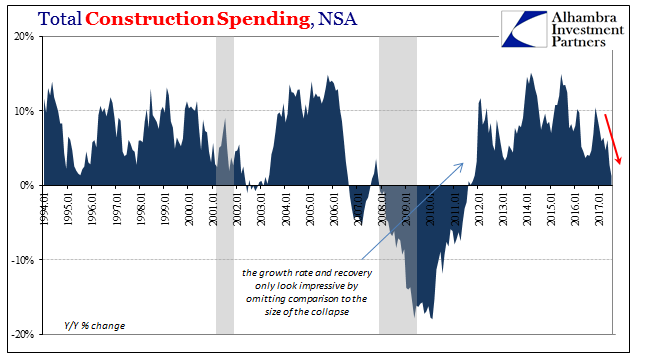 - Click to enlarge |
| Even with the upward revisions, however, Construction Spending has turned unambiguously weak in 2017. The clear slowing no matter the monthly variation had been largely due to the public sector. Construction activity here peaked all the way back in June 2015, and has been on a downward trend since. That negative tendency has picked up in the last several months, including the latest estimates for July 2017. |
Total Public Construction Spending, Jan 1994 - 2017 - Click to enlarge |
| For public sector activity, the reasons behind the slowdown were easy enough to figure and find. |
State & Local Tax Collections, Jan 1994 - 2015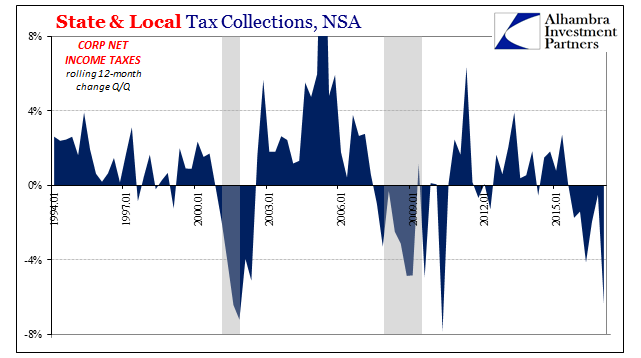 - Click to enlarge |
| As an indirect reflection of the “rising dollar” downturn, government construction has been scaled back surely in response to slower growth in tax collections. |
State & Local Tax Collections, Jan 1994 - 2015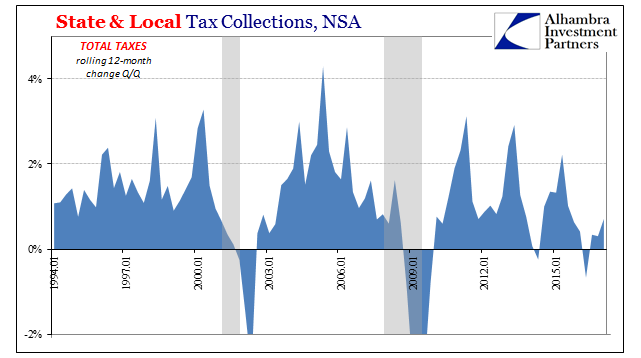 - Click to enlarge |
| State and local government taxes have been negatively affected by these macro conditions, so it would only make sense from a budget standpoint to equalize them in terms of major construction projects. |
State & Local Tax Collections, Jan 1994 - 2015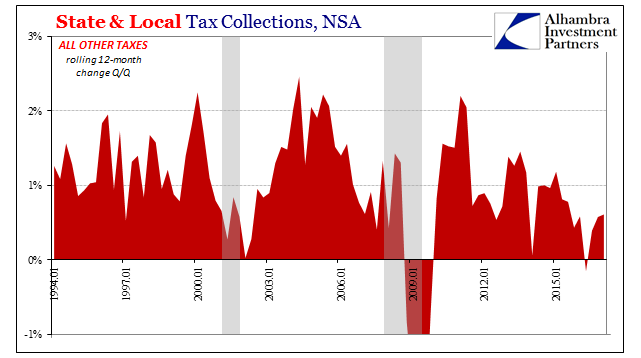 - Click to enlarge |
| That was not the primary reason for the major slowdown in construction in July, though, merely continuing the weak public baseline contribution. Instead, it was a full contraction (at least in the initial estimate) in private non-residential construction that dragged the whole sector slower. Just seven months before, in December 2016 this part of the industry was growing at almost a 14% annual rate (year-over-year). The latest estimate for July is -4%, the first decline of any level since 2013, and the worst monthly result since 2011. |
Private Non Residential Construction, Jan 2010 - 2017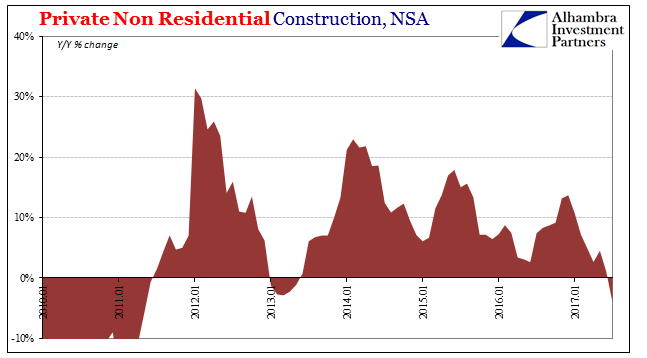 - Click to enlarge |
| This type of construction is more closely associated with capex and productive business investment, the kind of economic activity that is badly needed to help pull the economy out of its stagnation. The question is why in 2017 has capex been scaled back so far (to an-as yet unknown degree)? |
Profits Revisions, Jan 2010 - 2017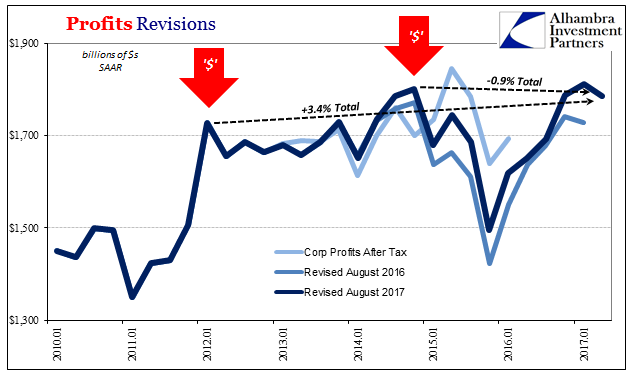 - Click to enlarge |
| I think the answer simple enough just like it was for the one on the public side. If taxes fuel government infrastructure projects, then profits fuel those sponsored by private firms. Rather than recover and rebound with vigor and symmetry, corporate profits have instead failed on that account. The latest estimates (from the BEA’s GDP, meaning GDI, series) through Q2 show a shocking lack of follow-through after the initial upturn in profits last year. |
Profits Revisions, Jan 2010 - 2017 - Click to enlarge |
| It may be that businesses were expected an actual improvement in the economy. That was, after all, the common narrative especially surrounding “rate hikes” and the reasons ostensibly for them. To be disappointed (yet again) by this year’s lack of real improvement could very well have triggered a re-assessment of cash flows and liquidity, and therefore capex as well as labor (which we also know continues on the slowdown). |
Private Non Residential Construction, Jan 2010 - 2017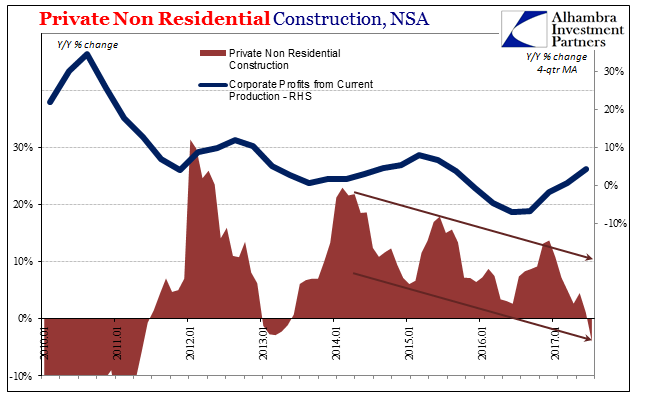 - Click to enlarge |
Again, it remains to be seen by how much there has been of these possible negative, dragging effects. It’s for now another suggestion of the ratchet effect ongoing, how the economy gets weaker as more industries and activities are pulled by monetary episodes into the negative column than are able to get themselves into the positive. Revisions and new data in the coming months should give us a better sense of what may be going on, or not going on.
Jeffrey P. Snider is the head of Global Investment Research of Alhambra Investment Partners (AIP). Jeffrey was 12 years at Atlantic Capital Management where he anticipated the financial crisis with critical research. His company is a global investment adviser, hence potential Swiss clients should not hesitate to contact AIP
Tags: capex,Construction,Construction Spending,currencies,economy,Federal Reserve/Monetary Policy,Markets,newslettersent,profits,Taxes