Jeffrey P. Snider
My articles My offerMy siteAbout meMy videosMy books
Follow on:LinkedINTwitterSeeking Alpha
| The oil effect continued to recede in late spring for more than just WTI prices or inflation rates. US trade on both sides, inbound and outbound, while still positive has stalled since the winter. |
US Exports, Jun 1989-2017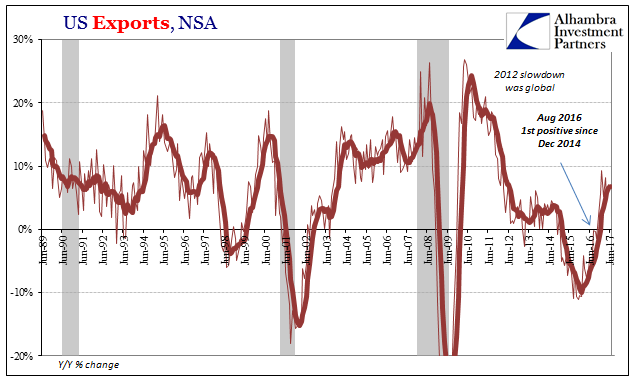 - Click to enlarge |
| Exports grew by just 6.2% year-over-year (NSA) in June 2017, about the same pace as estimated in December 2016. After contracting for nearly two years, twenty-two months straight at one point, global demand for US goods has not appreciably rebounded from it. |
U.S. Exports, Jan 2007-2017 - Click to enlarge |
| On the inbound side, reflecting domestic demand for foreign goods, US imports were up only 5.1% year-over-year (NSA) in June. |
U.S. Imports, Jun 1989-2017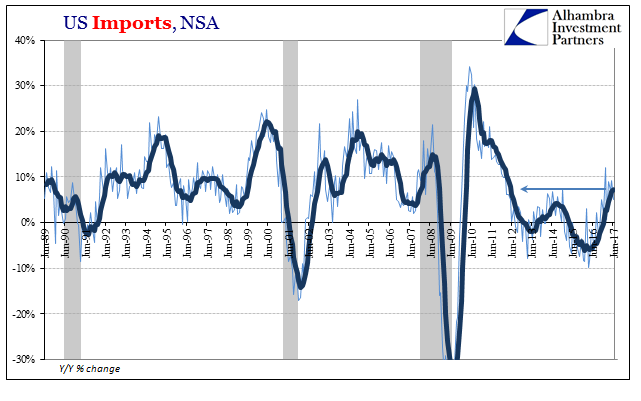 - Click to enlarge |
| It is here where oil price base effects were largest but now almost completely exhausted. Subtracting foreign oil purchases, imports were up 4.4%. |
U.S. Imports Jun 1989-2017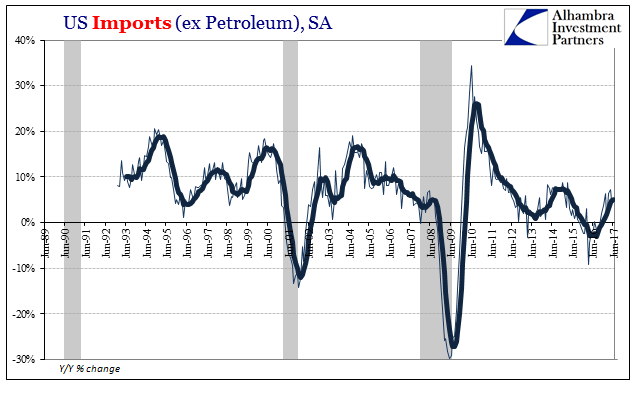 - Click to enlarge |
| The lack of economic momentum is most distinct in the seasonally-adjusted estimates on either side. Exports rose somewhat in June over May to the highest since December 2014, but the estimates for this latest month are only 1.3% more than those for January 2017. Exports, seasonally-adjusted, also remain more than 6% less than the peak in August 2014, nearly three years ago.
|
U.S. Trade, Jan 2014-2017(see more posts on U.S. Trade Balance, )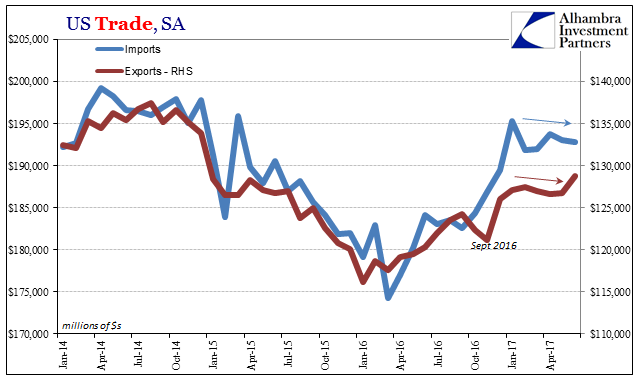 - Click to enlarge |
| Adjusted imports after surging in January have been mostly lower, too. The June figure is 1.3% below January and still 3% less than April 2014. The trend over the last eight months has followed closely the annual changes in crude oil rather than suggesting a rebound in US domestic appetite for overseas products more generally (even though the exchange value of the dollar remains largely “risen”). |
U.S. Trade, Jan 2006-2017(see more posts on U.S. Trade Balance, )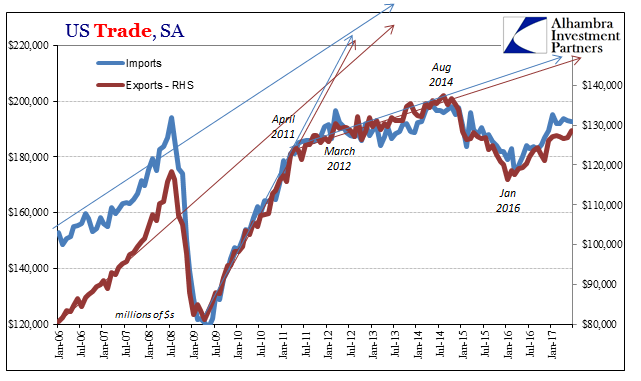 - Click to enlarge |
| These are, of course, very unwelcome results for our global trading partners who have been in very large part counting on the US unemployment rate to be applicable for once. If the downturn of 2014-16 could be explained by “transitory” factors (that somehow took more than two years to clear up, as economists would have it) and the US economy finally past them and in fine shape otherwise (according to the unemployment rate), then it might seem plausible that US demand would not just increase but do so emphatically.
At best, however, US purchases of these goods has re-attained 2014-levels rather than a more serious and corroborative acceleration. Imports from China, for example, had grown by double digit rates (Y/Y) in the three months preceding June. That sounds like meaningful improvement, though instead it is far too consistent with expansion rates of the past five years of (variable) slowdown. Chinese imports into the US were up only 9.7% in June, continuing what in context shows a serious and apparently continuing weak trend that is far less than what the Chinese economy requires (and seems to have been expecting). |
U.S. Imports, Jun 1989-2017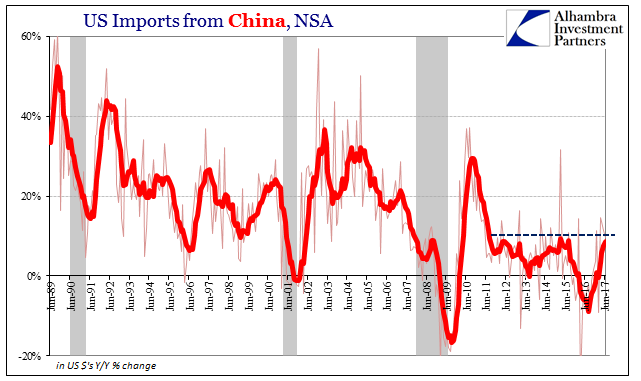 - Click to enlarge |
| Demand for goods from America’s second largest trading partner, the EU, actually contracted in June. Imports from Europe were down 1.3% year-over-year, with a 6-month average of barely 2%. Regardless of the euro/dollar exchange rate, imports from that side of the Atlantic have been consistently atrocious for several years as well. |
U.S. Imports European Union, Jun 1989-2017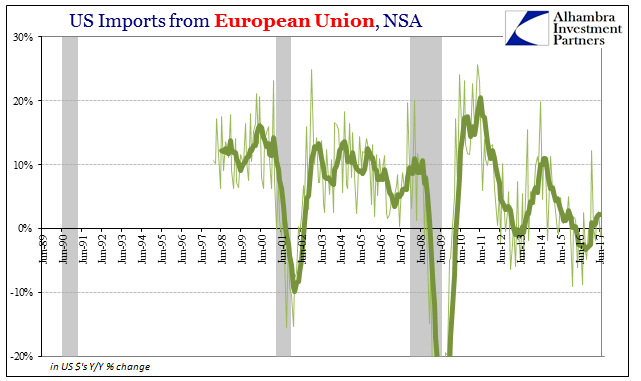 - Click to enlarge |
For all the mainstream talk of “robust” or “strong” economy especially in “global growth” terms, it remains conspicuously elusive in trade – both outbound but especially inbound. More than a year after what was nearly a recession in the US, consumers here continue to be constrained even though the unemployment rate suggests it should be the opposite.
It has been the defining feature of this lost decade that for each blow the global economy suffers in each of these intermittent “dollar” events, it comes away from them on the other side weaker every time. This is unique in historical experience, where symmetry is universally and empirically established for business cycles.
It therefore cannot have been a business cycle (singular or plural), which is how an economy can lose a decade. And be poised to lose another one still.
Full story here Are you the author?Tags: China,currencies,economy,EuroDollar,Europe,exports,Federal Reserve/Monetary Policy,global trade,imports,Markets,newslettersent,U.S. Trade Balance