The US created 209k jobs in July and jobs growth in June was revised higher (+9k) to 231k. The underemployment rate was unchanged at 8.6%.
United StatesNonfarm payrollsThe 287k nonfarm payroll growth in June (265k private sector) will ease fears that the US is headed for a recession. That type of jobs growth, and the stronger than expected, service sector ISM earlier this week, are not consistent with a contracting economy. The manufacturing sector gained 14k jobs, the most since January, recouping most of the 16k positions lost in May. This bodes well for manufacturing output. Despite the jobs growth, the fall in the unemployment and underemployment rates, wage pressure is modest at best. Jobs growth was particularly strong in leisure and hospitality sectors (62k). Hiring reached five-month highs in manufacturing, education and health services. |
U.S. Nonfarm Payrolls, July 2017(see more posts on U.S. Nonfarm Payrolls, )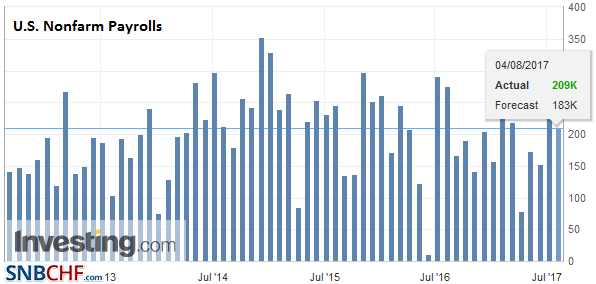 Source: Investing.com - Click to enlarge |
Participation RateThis is all the more impressive because the participation rate also ticked up (62.9% from 62.8%). |
U.S. Participation Rate, July 2017(see more posts on U.S. Participation Rate, )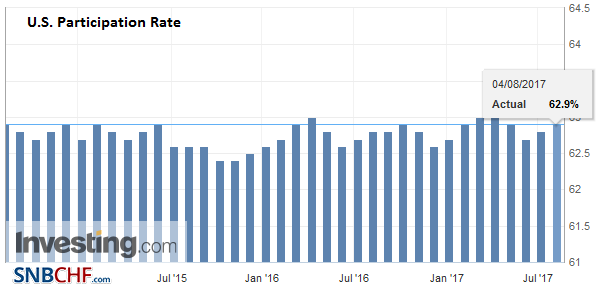 Source: Investing.com - Click to enlarge |
Unemployment RateThe unemployment rate ticked down to 4.3%, matching the cyclical low set in May. |
U.S. Unemployment Rate, July 2017(see more posts on U.S. Unemployment Rate, )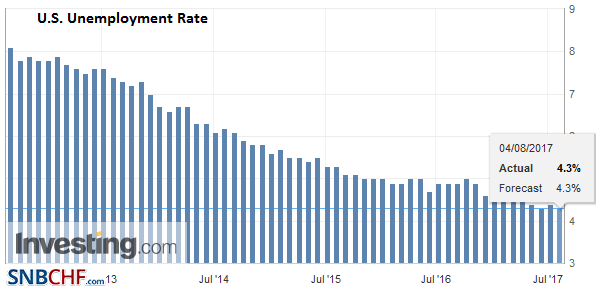 Source: Investing.com - Click to enlarge |
Average Hourly EarningsAverage hourly earnings rose the 0.3% the market had expected, but due to rounding, this kept the year-over-year rate at 2.5%. It is the fourth consecutive month that is has remained at 2.5%. Earnings growth average 2.6% last year. |
U.S. Average Weekly Hours, July 2017(see more posts on U.S. Average Earnings, ) Source: Investing.com - Click to enlarge |
Canada and the US reported June trade figures. Canada’s merchandise deficit swelled to C$3.6 bln, nearly three times larger than the median forecast in the Bloomberg survey. The May deficit was revised to C$1.36 bln from $1.09 bln. Exports fell 4.3%, the largest since February 2016. Imports rose 0.3%.
The US trade deficit narrowed to $43.6 bln, which is the smallest short fall since late last year. Exports rose 1.2%, boosted by capital equipment, oil, and soy. Imports slipped 0.2%. Of note, consumer goods imports fell for the second consecutive month. Given the small fall of the merchandise deficit in real terms, it supports a small upward revision in Q2 GDP.
The US dollar jumped on the headlines, and we recognize that technically the dollar’s sell-off is getting stretched after a four-week slide against the euro and yen. The Canadian dollar is on the verge of snapping a five-week advance. The Australian and New Zealand dollars are poised to end a three-week advance. The euro’s ascent has been relentless, and many short, and medium term participants appear to be still inclined to buy dips. The odds of a September Fed hike remain remote at best.
CanadaCanada also reported July employment figures. Still, full-time employment was robust. Canada added 35.1k full-time positions, which is just above the average from H1 (32.2k). |
Canada Employment Change, July 2017(see more posts on Canada Employment Change, ) Source: Investing.com - Click to enlarge |
| The unemployment rate fell to 6.3% from 6.5%, but this was not as impressive as it looks as the participation rate slipped to 65.7% from 65.9%. |
Canada Unemployment Rate, July 2017(see more posts on Canada Unemployment Rate, )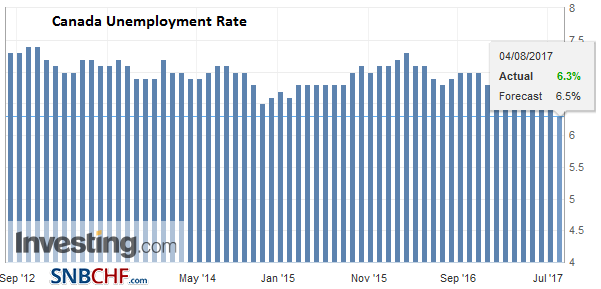 Source: Investing.com - Click to enlarge |
|
Canada Participation Rate |
Canada Participation Rate, July 2017(see more posts on Canada Participation Rate, )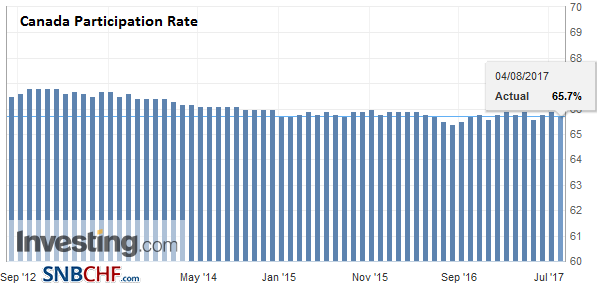 Source: Investing.com - Click to enlarge |
Tags: Bank of Canada,Canada Employment Change,Canada Participation Rate,Canada Unemployment Rate,jobs,newslettersent,participation rate,U.S. Average Earnings,U.S. Nonfarm Payrolls,U.S. Participation Rate,U.S. Unemployment Rate


