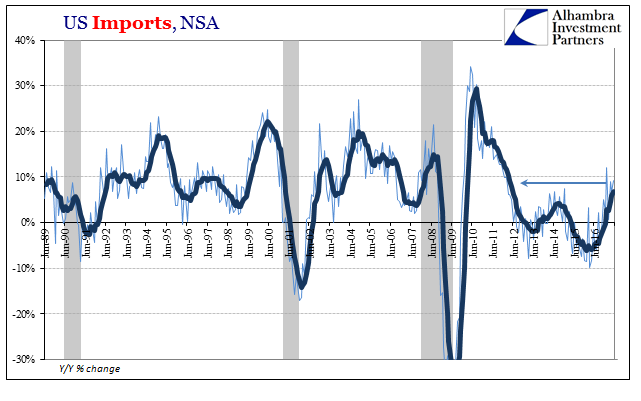
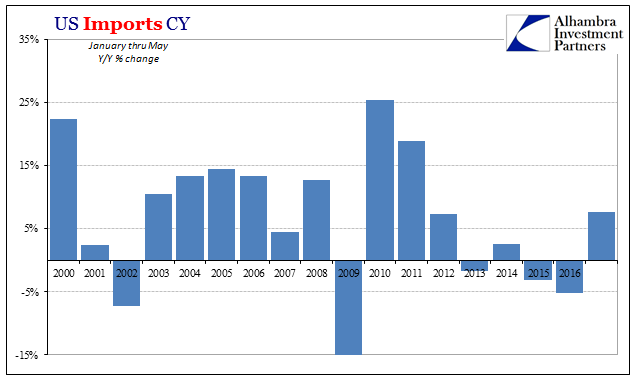
| US imports rose year-over-year for the seventh straight month, but like factory orders and other economic statistics there is a growing sense that the rebound will not go further. The total import of goods was up 9.3% in May 2017 as compared to May 2016, but growth rates have over the past five months remained constrained to around that same level. It continues to be about half the rate we should expect given the preceding contraction. |
US Imports, June 1989 - July 2017 |
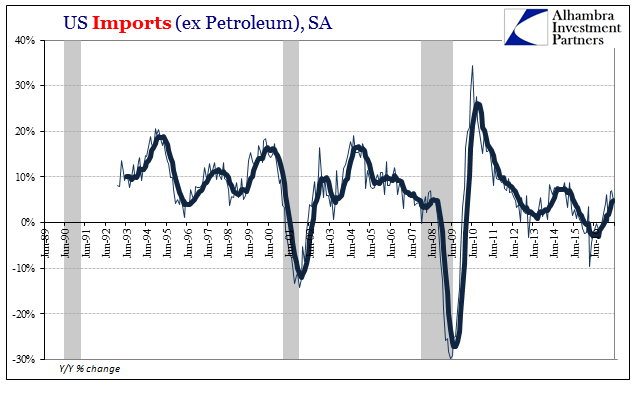
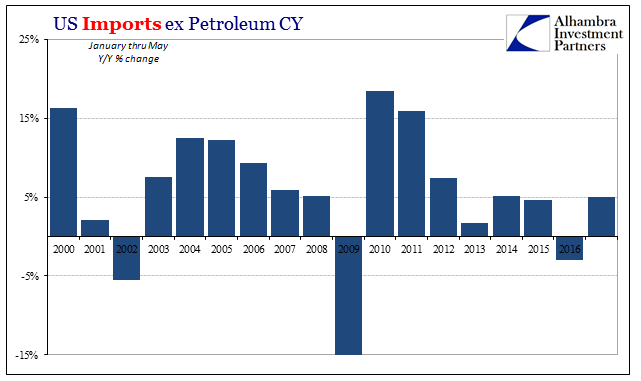
| Though price effects are tailing off, there was again a large base effect distortion from crude oil. US imports were up significantly again in May, by 41.8%, meaning that imports ex petroleum rose by just 4.8%. For the five months of 2017 so far, non-crude imports have grown by just 5% over the same period in 2016. That’s far too much like 2013 and 2014. |
US Imports Excluding Petroleum, June 1989 - July 2017 |
US Imports , 2000 - 2017 |
|
US Imports Excluding Petroleum CY, 2000 - 2017 |
|
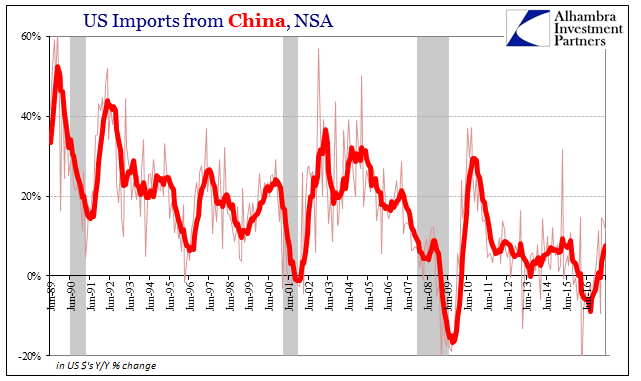
| Even US trade with China is less impressive than it might otherwise sound. Imports from our largest trading partner (inbound) rose by more than 11% year-over-year in the latest data. That was the third straight double digit growth rate. Even those gains, however, are about half to a third of what Chinese industry is counting on for a true global recovery. |
US Imports from China, June 1989 - July 2017 |
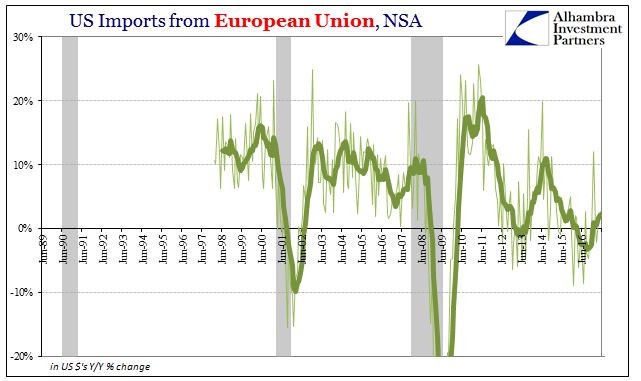
| The same is also true of inbound European goods. US imports from Europe grew by just 2.7% this May, and just 2.2% over the prior six months (including May). |
US Imports from European Union, June 1989 - July 2017 |
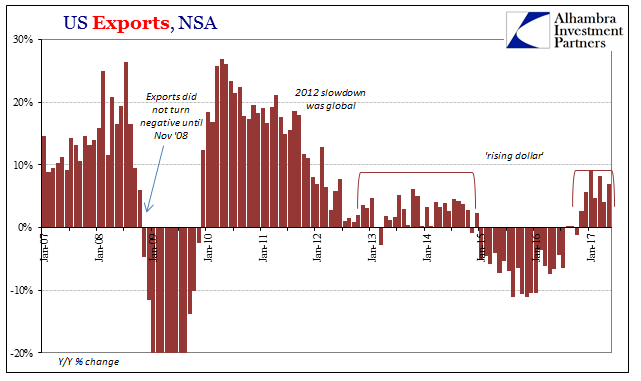
| There isn’t much difference on the export side, either. Outbound trade has rebounded from last year as everything else has, but not to the degree which would re-establish badly needed symmetry. Exports were up 7% during May, but as with imports there isn’t any indication of further momentum and acceleration. Instead, the level of activity appears to be in 2017 stuck best characterized as not 2016. |
US Exports, June 1989 - July 2017 |
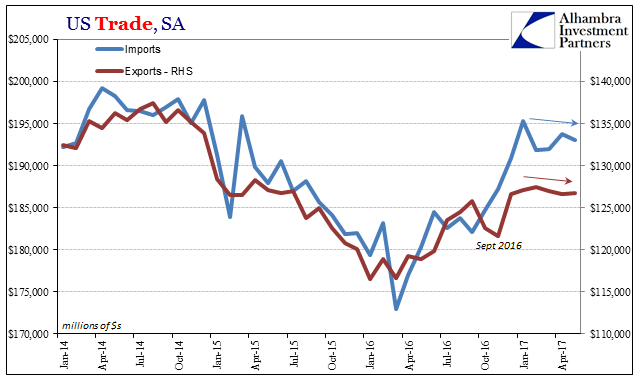
| This lack of momentum has, also like factory orders and other accounts, shown up as differences in the seasonally-adjusted monthly changes. Despite the unadjusted year-over-year rates cited above, seasonally-adjusted both imports and exports have stalled for several months now. On the import side, the current level is down from a rebound peak reached in January, while in exports the lack of further growth dates back to December. In short, the status of global trade in 2017 doesn’t appear to be very positive. |
US Exports, Janyaru 2007 - July 2017 |
| What that suggests when reconciled to the unadjusted annual gains is that the rebound was largely limited to the second half of last year. For whatever reasons (incomes!), it did not extend much if at all into this year. It is a widespread finding that largely agrees with financial indications such as the bond market conundrum (that isn’t). |
US Trade, January 2014 - July 2017 |
|
I’ll write it one more time; the economic rebound 2016-17 seems so far like the one in 2013-14 stalled out way before it would indicate a significant and meaningful change in economic condition. It suggests at best only the absence of further contraction pressure, a condition that in a normal cycle would be sufficient or close enough to it to allow for further forward momentum and actual growth. These are, however, not normal circumstances, made so by unstable monetary conditions that have radically altered business dynamics (globally). As I wrote yesterday:
US and global trade stuck at these levels does nothing to change the economic and liquidity risk/return equation. It’s good that there are plus signs again, but so very short of good enough. And so these mini-cycles repeat, alternating between low level positives and shallow but prolonged negatives. It only increases the already enormous economic costs in terms of time, making it that much harder to pull out of the rut. |
Economic Baselines in the Eurodollar Era, January 1993 - July 2017 |
Tags: China,currencies,economy,Europe,exports,Federal Reserve/Monetary Policy,global trade,imports,Markets,newslettersent


