| – Gold prices break 6 year down trend on safe haven demand (see charts) – Chinese gold demand set to surge 50% to 1,000 metric tonnes – Chinese demand for gold bars on track to surge more than 60 percent in 2017 – Geopolitical risk internationally leading to safe haven demand – UK election, terrorism and rising tensions in Middle East supporting gold after attacks in London and attacks in Iran today – Gold is 12.5% higher for year and outperforming stocks (see table) Gold prices have broken out above the six year long downtrend (see charts) due to a 50% surge in Chinese demand and increasing safe haven demand internationally. |
Gold prices technical 2008-2017(see more posts on gold price, )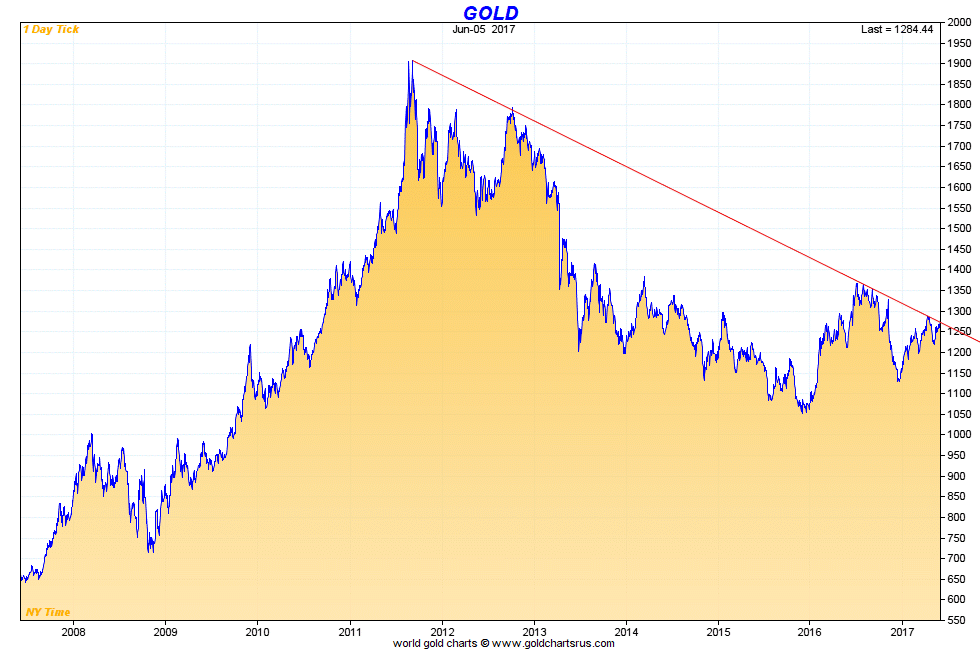 Source: Goldchartsrus.com - Click to enlarge |
| Gold is now 12.5% higher year to date in dollar terms and technical analysts say that the breakout is important technically. When combined with the very uncertain geo-political and positive supply demand backdrop, it is a bullish development.
Gold jumped more than 1% yesterday on concerns of conflict in the Middle East after the Saudi coalitions aggressive move against gas rich Qatar and Iran. Today there have been terrorist attacks in the Iranian parliament and at least seven people have been killed. |
Gold prices safe haven 2017(see more posts on gold price, )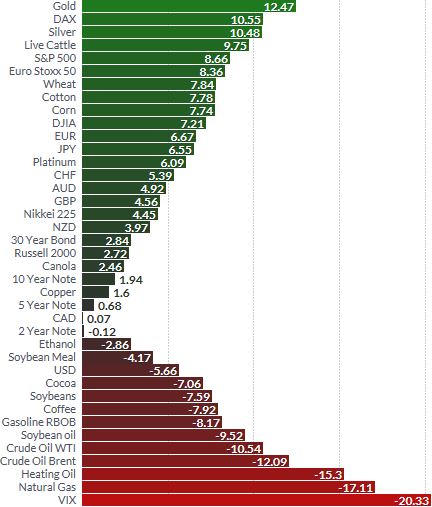 Source: Finviz - Click to enlarge |
| Gold likely also received a safe haven bid due to heightened terrorism concerns after the terrorist attacks in London and the possibility that a left leaning Labour government under Corbyn may come to power in the UK.
Chinese gold demand has increased very substantially again and Chinese gold imports are seen jumping 50% back to 1,000 metric tonnes as reported by Bloomberg. The world’s biggest gold market looks set to increase imports through Hong Kong by about half this year as Chinese investors seek to protect their wealth from currency risks, a slowing property market and volatile stocks, according to the Chinese Gold & Silver Exchange Society. Chinese demand for gold bullion bars is surging and is on track to surge more than 60 percent in 2017. |
Chinese Gold net Imports 2001 - 2017(see more posts on Chinese gold import, )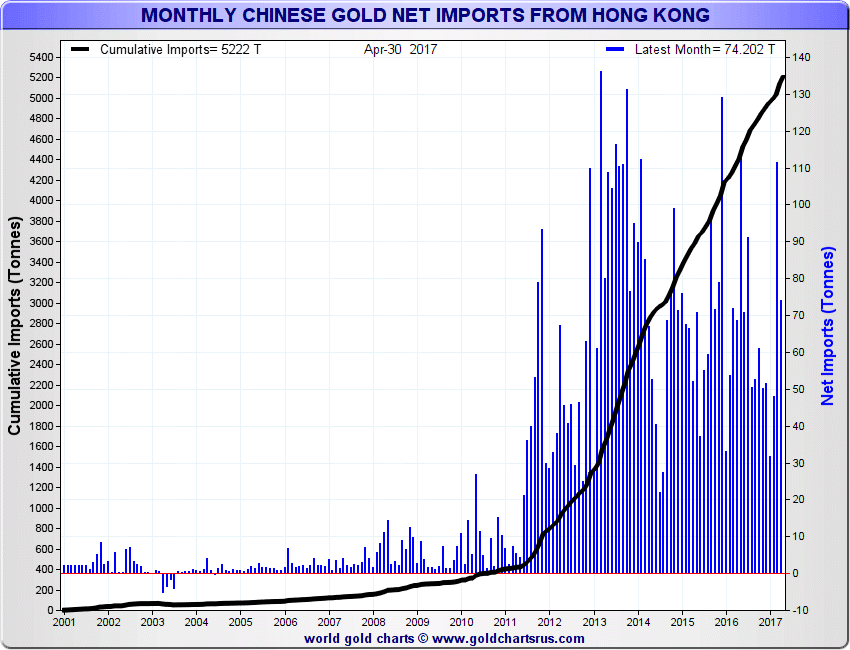 Source: Goldchartsrus.com - Click to enlarge |
| Gold is now just a fraction from its highs for the year so far and the 12.5% gains means that gold is outperforming most international stock indices. The S&P 500, the Euro Stoxx 50 and the Nikkei are just 8.7%, 8.4% and 4.5% higher respectively (see table above).
It is also breaking out from the long term downtrend line left from the bear market as noted by many technical analysts and Bloomberg today: “Gold is breaking out of a six-year slump as investors search for safe havens during a period of global upheaval and bets that historically low U.S. interest rates will endure. After breaching a six-year downtrend line, gold is at the highest level since Nov. 4, and has advanced 12.7 percent this year. An uptick in bullion imports in China, as a hedge against currency risk, and a tepid pace of U.S. monetary tightening could fuel the next leg-up in the rally, say analysts.” After breaking the 2012 downtrend at $1,290, the next level or resistance is the psychological level of the round number $1,300 per ounce and above that the next level of resistance is $1,350 per ounce. There is a risk of gold weakening before and on the day of the Federal Reserve interest rate announcement on June 14. However, the risk posed by the Fed tightening is exaggerated and even if the Fed does tighten by a meager 25 basis points, there are increasing doubts as to whether there will be further interest rate rises due to fragile U.S. and global economic growth. |
Gold Spot Price 2011-2017 Source: Bloomberg - Click to enlarge |
Full story here Are you the author? Previous post See more for Next post
Tags: Chinese gold import,Daily Market Update,gold price,newslettersent


