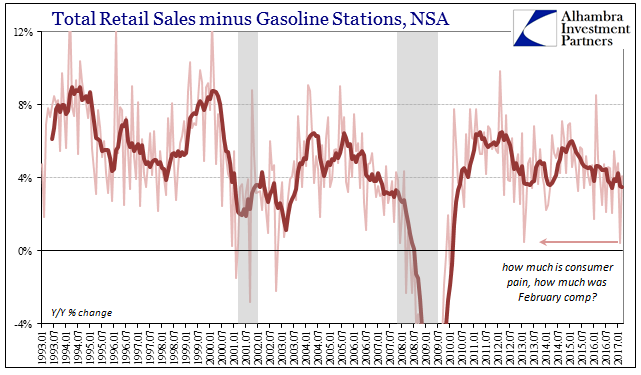
| Retail sales growth in February 2017 was going to be low by virtue of its comparison to February 2016 and the extra day in that month. The Census Bureau’s autoregressive models are supposed to normalize just these kinds of calendar irregularities so that we can make something close to apples to apples comparisons. The seasonally-adjusted estimate for February, however, was calculated to be less than the one for January 2017, therefore suggesting that weakness in the prior month wasn’t entirely related to the non-economic reasons of a leap year.
The current estimates for March 2017, released last Friday, include (standard) revisions to February. The unadjusted figure for the prior month was revised down by more than $2 billion, increasing more so the month-over-month decline for the adjusted estimate. By whatever standard, February 2017 was not a good month for US consumers (check the snow patterns). |
US Retail Sales Trade, Jan 1993 - 2017 |
| Unfortunately, that condition appears to have spilled over into March. Seasonally-adjusted (more calendar effects due to the differences in Easter 2016 to 2017), retail sales declined for the second straight month; the first time that has happened since three onthly negatives starting with December 2014 and continuing in the first two months of 2015. Retail sales didn’t even decline in consecutive months last year during the near-recession conditions that prevailed then.
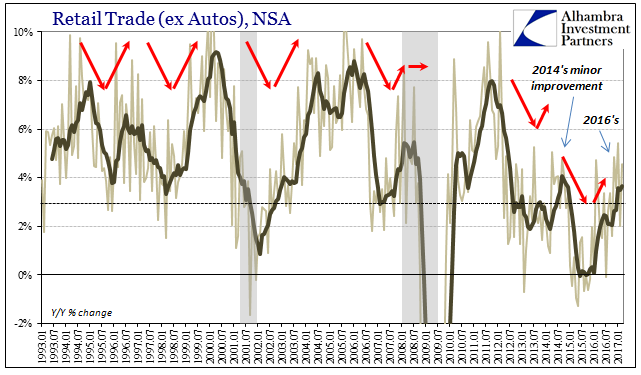
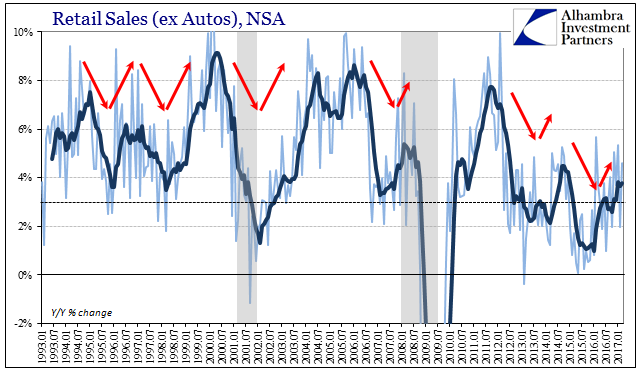
Unadjusted, year-over-year retail sales expanded by 4.82%, and 4.60% ex autos. For the first quarter as a whole, retail sales were just 3.9% above those figured for the first quarter of 2016, about half the growth rate that could be considered healthy and normal and nowhere near what would be symmetrically consistent given the proposed change of economic environment. |
US Retail Sales, Jan 1993 - 2017(see more posts on U.S. Retail Sales, ) |
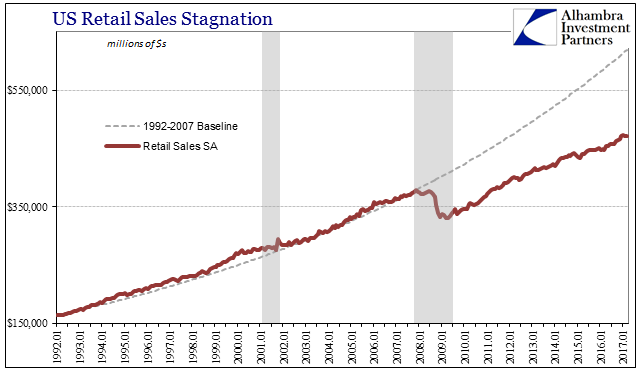
| The growth rates are clearly better this year, but still falling far, far short of what is necessary. We can use the seasonally-adjusted series to better illustrate this point (continued lack of recovery/growth). After falling off dramatically in the second half of 2008, retail sales then, like everything else, only partially recovered and only at first. |
US Retail Sales, Jan 1992 - 2017(see more posts on U.S. Retail Sales, ) |
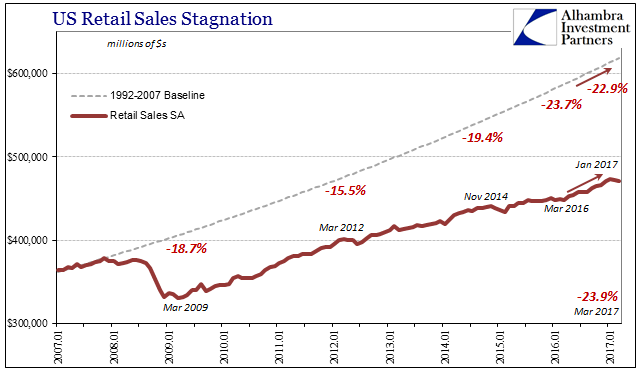
| At the trough in March 2009, the gap was about 19%, a huge hole that perfectly describes the shocking extent of the Great “Recession.” From there, however, despite what looked like normal growth rates, that gap was only narrowed by the smallest margin. This lack of symmetry should have been more alarming than it was, for at the time it was thought that just meant the recovery would take a lot longer to achieve – not that it wouldn’t ever happen.
The “unexpected” slowdown that developed in early 2012, however, permanently altered the growth trajectory (again, for more than just retail sales) so that by late 2014 and the “rising dollar” the gap had actually increased relative to the pre-crisis baseline. Economists were getting excited at that time by confusing positive numbers for actual growth. |
US Retail Sales, Jan 2007 - 2017 |
| The subsequent further slowing in early 2015 and lasting until early 2016 merely stretched the interruption to another extreme. Then, despite the “reflation” enthusiasm and relatively better economic numbers particularly in the second half of last year, the interval has barely budged. Still, the same mistakes made in 2014 are being repeated all over again. Now, with two months of declines in a row, the gap of retail sales to its pre-crisis baseline is once more at a record extreme – meaning that nothing has changed despite the heavier influence of oil prices on gasoline sales (retail sales at gasoline stations were up 14.5% in March). |
US Retail Sales, Jan 1993 - 2017(see more posts on U.S. Retail Sales, ) |
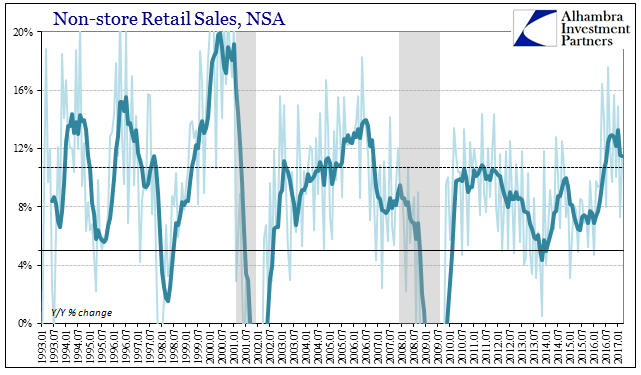
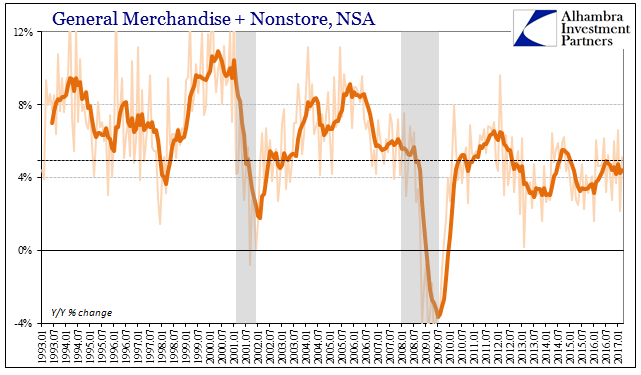
| The acceleration in sales through online outlets seems also to have plateaued if not peaked. Retail sales to non-store retailers were up almost 15% in January, but just 7.3% (revised) in February and 11.4% in March. Department store sales fell 5.2% last month, which was actually a good month for the segment. Overall, non-store sales plus those through general merchandisers rose just 4.6% in Q1. Like retail sales overall, that is only about half of the growth rate we would expect to find where consumer spending wasn’t an immediate problem. |
US Retail Sales, Jan 1993 - 2017(see more posts on U.S. Retail Sales, ) |
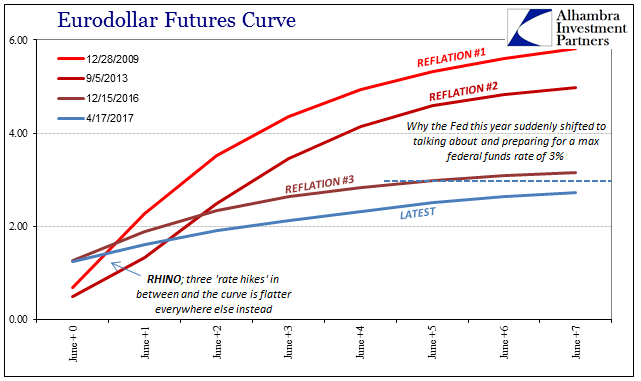
| Without any measurable (calendar effects aside) change in the condition of US consumers, it can only contribute to the rethinking of “reflation” optimism that was summoned on something being different (or at least the hint of it by now). More and more without meaningful improvement actually showing up, it falls to nothing but projections of the expected positive effects of still non-specific policies that may not have had much of a chance to succeed in the first place. |
US Retail Sales, Jan 1993 - 2017(see more posts on U.S. Retail Sales, ) |
| That is because the economic rut is not just this year as compared to last year, or even the last three years of the “rising dollar”, but one that goes on for almost a whole decade backwards in time. And without truly radical action rather than the cosmetics of “rate hikes” or even tax reform, there is a far, far better chance that it continues for another decade than it doesn’t. |
Eurodollar Futures Curve |
Tags: Auto Sales,consumer spending,consumers,currencies,depression,economy,Federal Reserve/Monetary Policy,gasoline sales,Markets,newslettersent,Retail sales,U.S. Retail Sales


