Behind the CurveEconomic nonsense comes a dime a dozen. For example, Federal Reserve Chair Janet Yellen “think(s) we have a healthy economy now.” She even told the University of Michigan’s Ford School of Public Policy so earlier this week. Does she know what she’s talking about? |
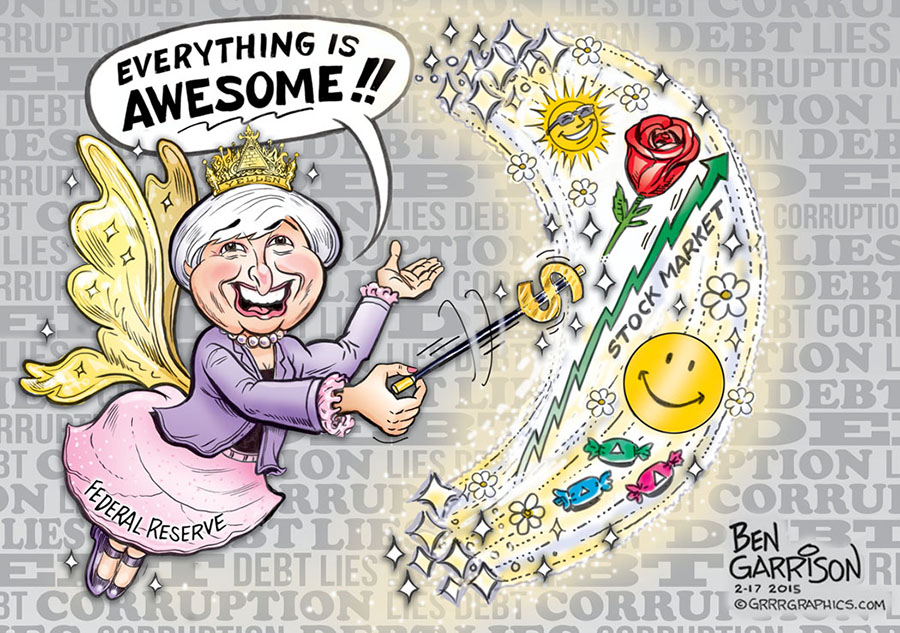 Somehow, this cartoon never gets old… - Click to enlarge |
| If you go by a partial subset of the ‘official’ government statistics, perhaps, it appears she does. The unemployment rate is at 4.5 percent, which is considered full employment. What’s more, inflation is ‘reasonably close’ to the Fed’s 2-percent inflation target. But what does this mean, really?
According to Fed Chair Yellen, it means that now’s the time to tighten up the nation’s monetary policy. By now you’ve likely seen this upcoming – choice – quote from Yellen. Nonetheless, we can’t resist repeating its remarkable idiocy. For Yellen, who was in the greater Detroit metropolitan area, was kind enough to humor us all with a nifty automotive analogy to explain how to go about normalizing monetary policy. Here Yellen elaborates with a variety of technical terms:
|
Awesomeness - Unemployment Rate and CPI YoY Change, Jul 2008 - Jan 2017(see more posts on U.S. Consumer Price Index, U.S. Unemployment Rate, )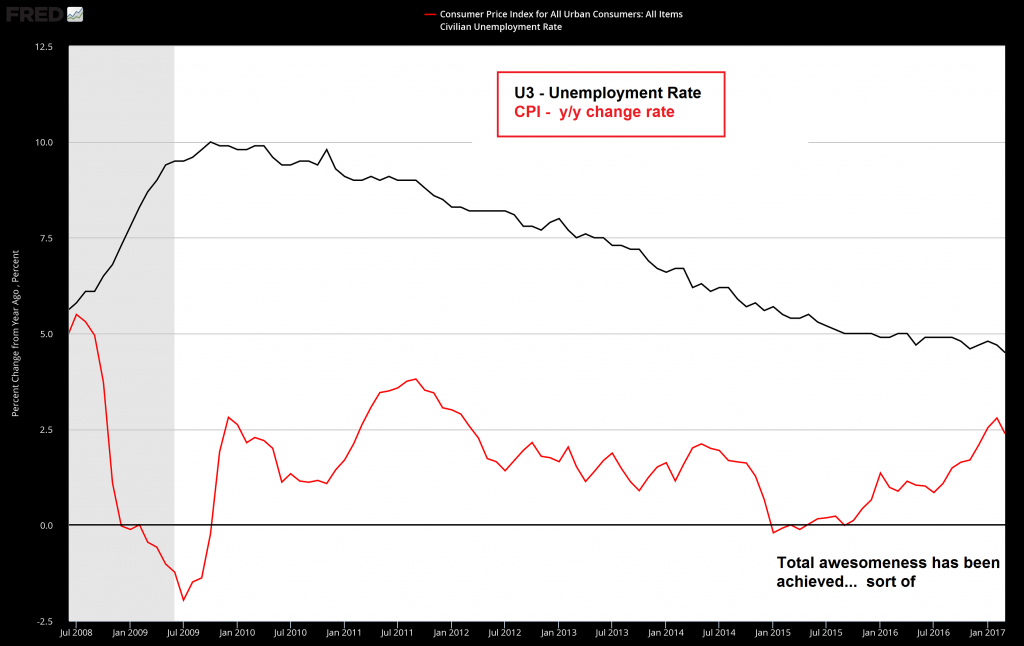 Behold this display of awesomeness, citizen. Doesn’t it prove that central planning “works” after all? Unfortunately the ointment is never entirely fly-free, especially when one is pondering statistical aggregates - Click to enlarge |
| As far as we can tell, Yellen’s merely huffing and blowing gas. What curve she wants to stay ahead of is unclear. We assume she’s referring to the inflation curve, although this does seem a bit out of context.
By our account, inflation of the money supply is, indeed, inflation. Hence, the Fed fell behind the curve between September 2008 and December 2014 when it inflated its balance sheet from $905 billion to $4.5 trillion. By our back of the napkin calculation that tallies up to nearly a 400 percent inflation of the Fed’s balance sheet. But what do we know? |
US Money Supply and Federal Reserve, Jan 2008 - 2017(see more posts on U.S. Money Supply, )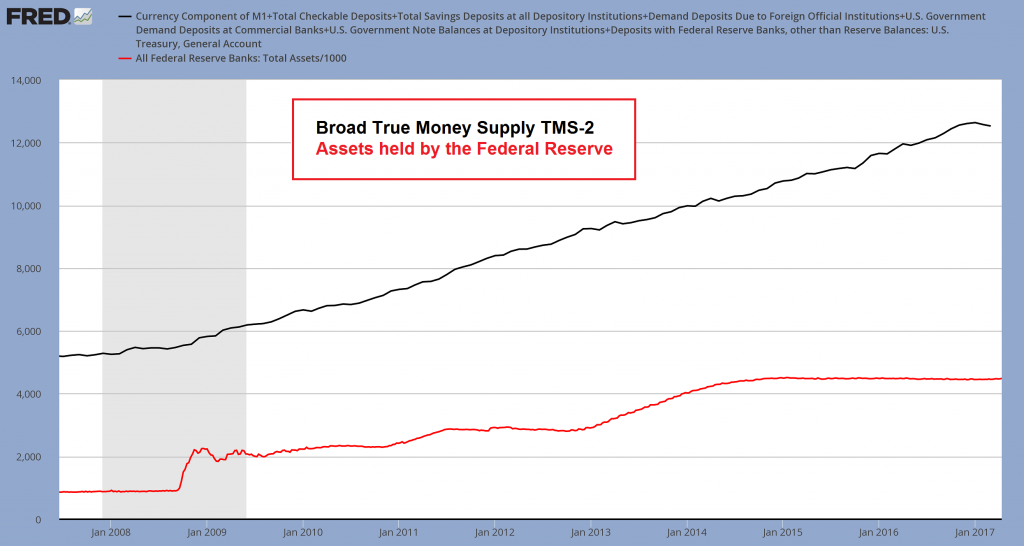 The broad true US money supply TMS-2 vs. assets held by the Federal Reserve since the GFC. A few points worth noting: TMS-2 expanded by ~140% between January 2008 and January 2017. One way of looking at this statistic is “in the entire history of the US, an amount X of money was created until early 2008. Since then, the amount of money in the economy has increased by 2.4 times”. The money supply had doubled by November 2014, so it took a little less than six years to print as much money in the US than in its entire preceding history. Yes, this is quite a bit of inflation. The fact that it has “bought” the weakest recovery of the entire post WW2 era is apparently considered a surprise by many people, but it shouldn’t be (the capital theory of the Austrian School provides answers). Also noteworthy: since peaking at ~$12.64 trillion in January 2017, TMS-2 has actually declined by roughly $110 billion. Whether this trend will continue remains to be seen, but if it does, the weak recovery will turn into an outright bust - Click to enlarge |
Economic FlatlineApparently, the Fed is so thrilled with the economy’s health that it wants to start shrinking its balance sheet later this year. In fact, New York Fed President William Dudley wants to execute balance sheet shrinkage by ending reinvestment of maturing principal. Easy come easy go, right? Unfortunately, Dudley’s plan ain’t gonna be easy. When it comes down to it, it’s unlikely the Fed will ever be able to shrink its balance sheet in any meaningful way. Quite frankly, both the economy and financial markets simply can’t afford it. Sure Yellen says that “we have a healthy economy now.” However, the economy may not be nearly as healthy as she believes. This becomes much more evident when looking beyond just the unemployment rate. In particular, as of 4th quarter 2016, GDP is increasing at a lethargic 2.1 percent. Yet that’s not the half of it. As of April 7, the Federal Reserve Bank of Atlanta’s own GDPNow model forecast for real GDP growth in the first quarter of 2017 is just 0.6 percent. By the time you read this they’ll have published an update. The point is, in the face of 0.6 percent GDP growth, Yellen’s statement that we have a healthy economy is patently absurd. For all practical purposes, 0.6 percent GDP growth is at economic flatline. Clearly, it’s not the type of growth that will lighten the load of today’s massive public and private debt burden. Nor is it the type of growth that propels first term presidents into a second term in high office. |
US Atlanta Fed GDP, Dec 2016 - Apr 2017(see more posts on U.S. Gross Domestic Product, ) Fresh from the Atlanta Fed: the latest GDP Now forecast for Q1 2017 stands at a paltry 0.5%. Keep in mind that GDP is a measure of economic activity that leaves a lot to be desired, but as is generally the case with such macroeconomic aggregates, it does give us a rough idea of general growth trends. It remains to be seen if the forecast turns out to be correct, but this particular model has so far worked quite well, so we would not dismiss it. - Click to enlarge |
Hell To PayPresident Trump doesn’t want 0.6 percent GDP growth. He wants 4 percent GDP growth. He demands it. He’s even promised it. But promising something and then delivering on it are two entirely different things. One takes cheap blather. The other takes hard work, persistence, tenacity, and good luck. Like many of President Trump’s promises, we are certain the promise of 4 percent GDP growth will be broken. But Trump’s only fault in the matter is promising it to begin with. It’s been over 13 years since the U.S. economy had a single year of 4 percent GDP growth. The simple fact is, the U.S. economy’s too larded over with debt and intervention to attain it. On top of that, Trump has the cards stacked against him. The Fed’s plans to increase the federal funds rate and shrink its balance sheet, either simultaneously or in sequence, will likely be counterproductive to President Trump’s GDP target. As the price of credit becomes more expensive, less borrowing and spending will occur. |
US Total Credit Market Debt, Federal Debt, Stocks and GDP, 1970 - 2016(see more posts on U.S. Federal Debt, U.S. Gross Domestic Product, ) Agian inflationary illusion: total credit market debt, federal debt, stocks and GDP (no points are awarded for guessing what comes dead last). A little aside: the Fed has stopped updating total credit market debt in late 2015. But fear not, the underlying data set keeps being updated. Thanks for nothing guys – now we will have to reconstruct this chart manually if we want to keep publishing it (if we understand this correctly, they simply removed one equation from their spreadsheet – the only effect is to make it more difficult to track, chart and compare this aggregate number. Honni soit qui mal y pense) - Click to enlarge |
| Of course, over the long-term, less borrowing and spending is precisely what the economy and financial markets need. Contracting credit. Deflating asset prices. Bankruptcy and default of marginal businesses. Most of all, default of U.S. government debt. Liquidate it all.
These are the solutions to an economy that’s been distorted so far out of balance – where a median income job doesn’t buy a median priced home. This is also the solution to a government that’s gotten too big for its britches. Cutting off the government’s overdrawn credit line will be the surest way to shrink it down to right size. No doubt, there’s hell to pay for 100 years of ever escalating financial insanity. Take it in stride. The downside is here and it’s not going away any time soon. |
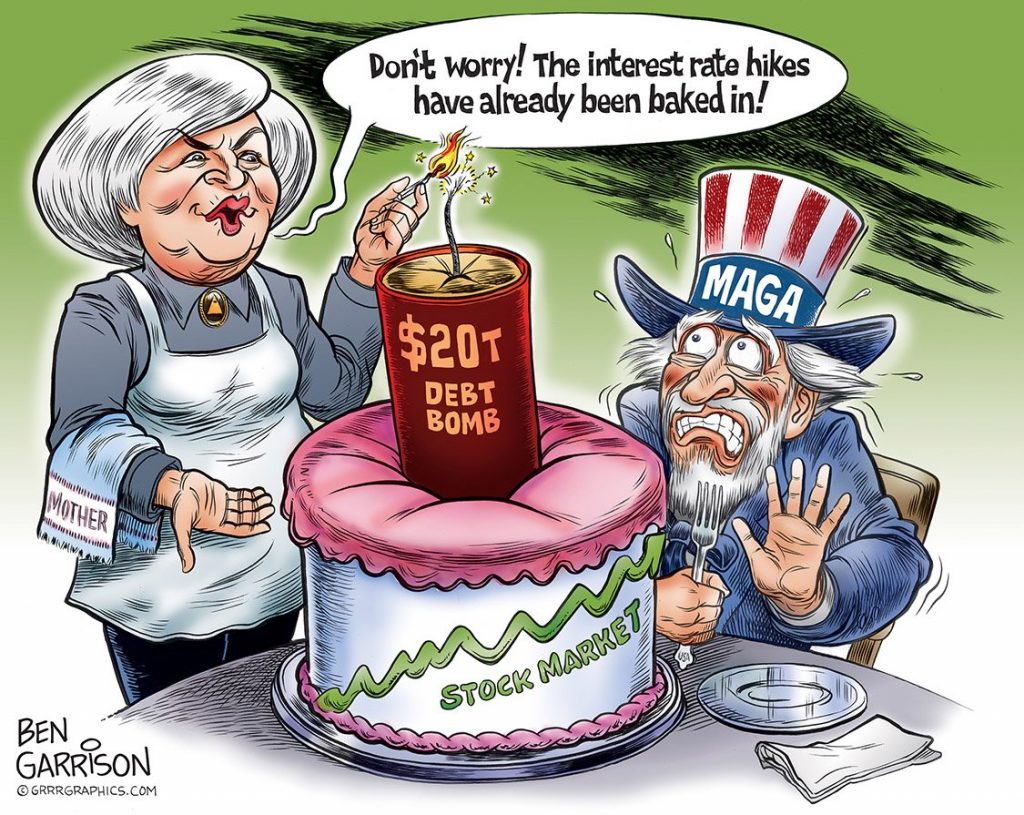 That’s just the federal debt bomb – and it’s less than a third of the total. - Click to enlarge |
Charts by St. Louis Fed, Atlanta Fed
Chart and image captions by PT
Full story here Are you the author?
Tags: central-banks,newslettersent,On Economy,U.S. Consumer Price Index,U.S. Federal Debt,U.S. Gross Domestic Product,U.S. Money Supply,U.S. Unemployment Rate