A Case of Botched Timing, But…When last we wrote about the gold sector in mid February, we discussed historical patterns in the HUI following breaches of its 200-day moving average from below. Given that we expected such a breach to occur relatively soon, the post turned out to be rather ill-timed. Luckily we always advise readers that we are not exactly Nostradamus (occasionally our timing is a bit better). Below is a chart of the HUI Index depicting the action since the January 2016 bear market low, with lateral support/resistance lines relevant to the recent action. To the above, readers should keep in mind that we are slightly biased, due to our positive long term view on gold (which is based on good reasons as we believe). We obviously underestimated the extent to which the looming rate hike would weigh on the gold market and real rates. The latter are an important fundamental driver of gold and had begun to look increasingly bullish in mid February, but that positive signal fell apart within days of our update (more on this in an upcoming post on the fundamental drivers of the gold market). As Quintilianus would probably advise us to say: culpa tota nostra est. Still, we think our little study of the HUI’s behavior following breaches of its 200-day ma was a useful exercise, regardless of what happens in the near term. After all, once such a breach does happen, it will be a quite convenient resource if one wants to look at past patterns for comparison purposes. A “buy the news” response to the Fed’s rate hike on Wednesday was to be expected (as noted in this article by Helder M. Guimares). We were hoping to post a positioning and sentiment update prior to the event, but only found the time to do so today. A few words on the bounce: One day of strength, even an impressive one, doesn’t allow us to come to any conclusions about the likely direction of the near term trend yet, especially in view of the HUI still struggling with overcoming its moving averages (see above). There are some things we like about its chart (such as the higher low it has possibly put in) and some we don’t like (such as the fact that the 200-day ma has begun to turn down). So we will have to wait and see what develops. In this post we are going to focus on positioning/sentiment data though. We will shortly take a look at several of gold’s fundamental drivers in a separate post as well. |
HUI Near Term Support Resistance, 2016 - 2017 After the HUI turned down from its 200-dma, we thought the red line would hold as support, but it was not to be. However, the area between the two blue lines has provided support, so there is a higher low in place for now, due to the “buy the news” response to the payrolls data and the rate hike. It is a bit difficult to see on this chart, but the advance on Wednesday stopped exactly at the 20-day ma, and the gap up open on Thursday (as we write this) stopped right at the 50-day ma. In spite of its volatility, the HUI is actually quite well behaved in terms of the technical picture, this is to say it often respects support and resistance levels, trend lines and moving averages and is quite amenable to Elliott Wave counts as well - Click to enlarge |
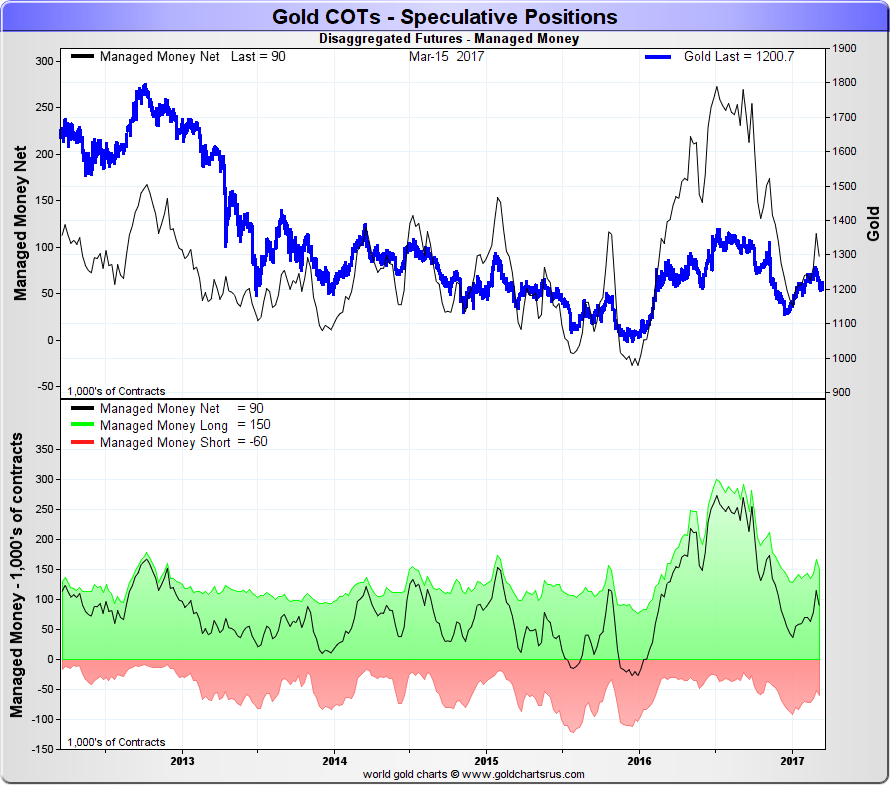
Positioning and Sentiment – Large TradersWe wanted to show something different from the usual legacy commitments of traders charts, and have found just the right thing at Nick Laird’s site “GoldchartsRus”. The chart archive there offers quite comprehensive and detailed charts of futures positioning data. For starters, here is a chart of the “managed money” category, which represents the bulk of the reportable non-commercial positions: |
Managed Money, 2012 - 2017 |
| Since the 2008 crisis and the subsequent vast increase in the global fiat money supply and the concurrent rise in the popularity of assorted systematic trading strategies (including HFT), there has been an enormous expansion in futures trading volumes. As a result, much higher levels of positioning extremes have become the “new normal” in many markets.
An especially egregious example are crude oil futures; nowadays an extreme speculative net long position in crude oil (WTIC) futures is about 5 to 5.5 times larger than what used to be considered an extreme position until 2008. A far less extreme, but still noticeable expansion in position sizes has occurred in precious metals futures as well. That raises the question if it is even possible to make useful comparisons based on these data. Luckily, the answer is yes. Apart from the fact that more finely grained data are available in the form of disaggregated CoT reports these days, one can e.g. compare net positions to open interest or to their recent ranges (time periods of 26 or 52 weeks seem most useful in this context. Larry Williams originally came up with this idea). Here is where the managed money net long position currently stands relative to its 52 week range: |
Managed Money Net Positions, 2012 - 2017 On a longer term chart the managed money net long position (gray line) looks medium-sized in absolute terms, but relative to its 52 week range (blue line) it is actually still quite small. In the 2016 rally this group of traders hugely expanded its long positions and the current level of the range oscillator still reflects a “base effect” on account of this expansion - Click to enlarge |
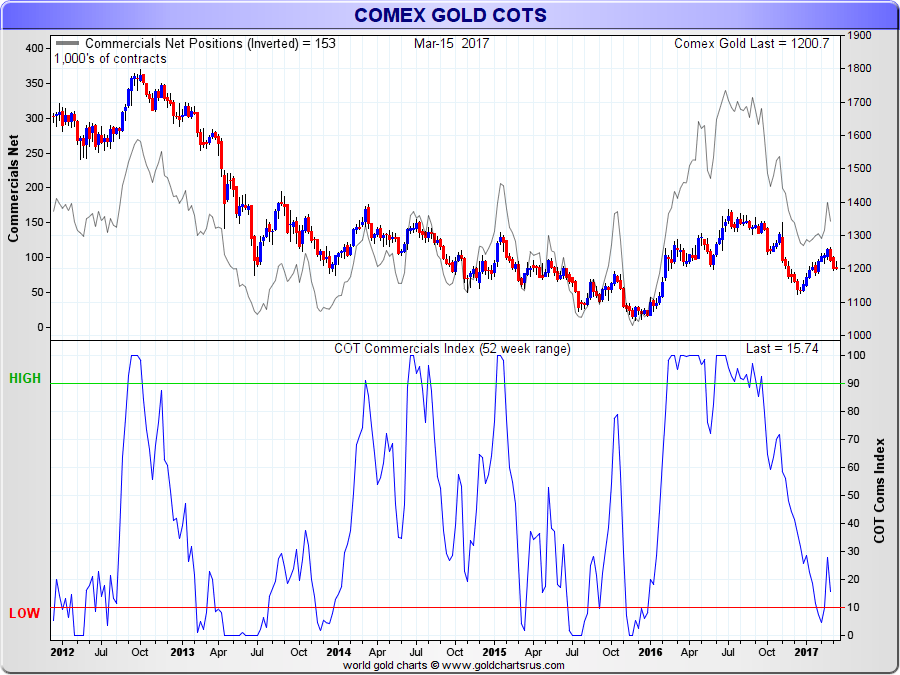
| The net short position of all commercial hedgers combined is currently also near the low end of its 52-week range (but also “mid-sized” in absolute terms). |
Commercials Net Positions, 2012 - 2017 |
| The next chart shows the gross positions of the two speculator categories (large and small speculators) according to the legacy CoT report as a percentage of open interest over the long term. This chart illustrates that as a percentage of OI current speculative long positions are not particularly large in a historical context – assuming a long term bull market remains in force. |
Gross Long and Short Positions of Large and Small Speculators, 1998 - 2017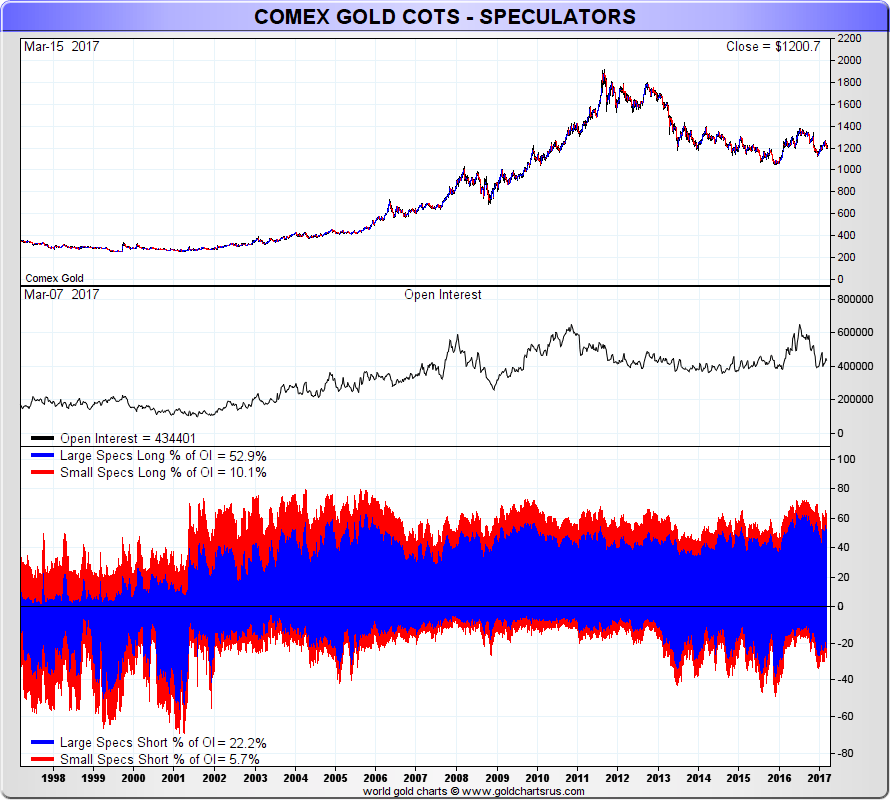 Gross long and short positions of large and small speculators as a percentage of open interest since 1999. The current combined percentages are between the levels historically seen in bull and bear markets, but defintitely closer to bull market readings (especially compared to pre-2000 percentages – in the late 1990s large speculators were routinely net short). - Click to enlarge |
Small Trader Positions and Survey DataThe next chart details gross and net non-reportable positions, i.e., the positions of small speculators. |
Net and Gross Positions of Small Speculators, 2007 - 2017 Net and gross positions of small speculators over the past decade. During the time period highlighted by the green square, the net position of this group frequently dipped into net short territory, which is rare – even in the severe late 1990s bear market, such forays into net short positions by this group were rare and not this pronounced. The net short position in late 2015 highlighted by the red circle was actually the biggest in at least 20 years. The current net long position of approximately 19k contracts is also not very large. From 2002 to 2011, small speculators routinely held far larger net long positions (peaking at more than 60k contracts in 2012) - Click to enlarge |
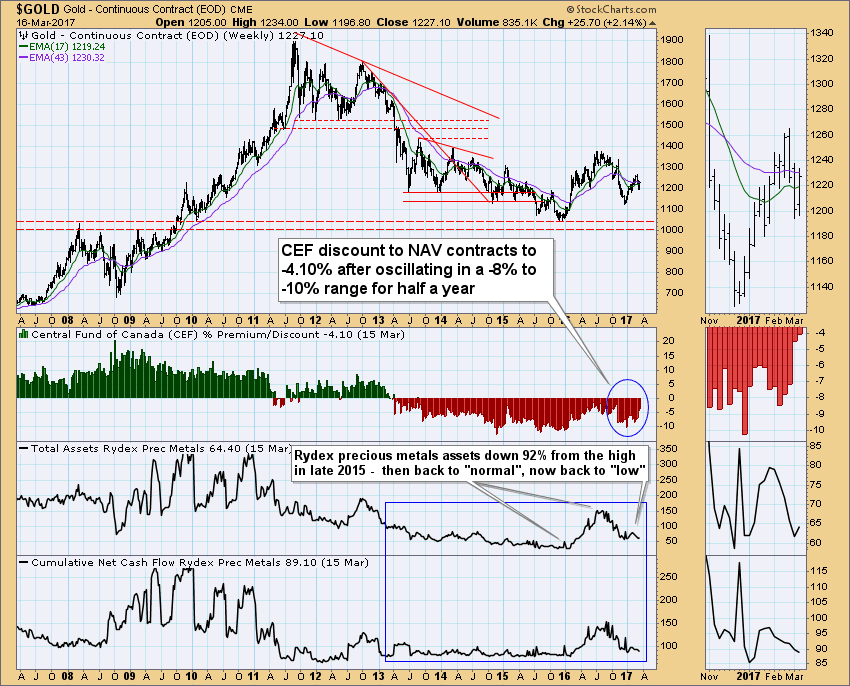
| It is fair to say that small speculators remain quite cautious with respect to gold. Even last year’s rally generated only muted enthusiasm. This is also reflected in the asset and cash flow statistics of the Rydex precious metals fund (note by the way that Rydex funds apparently continue to be used by many small short term traders. Several sector funds achieved new record highs in cash inflows and AUM as recently as 2015).
The next chart shows what has recently happened on that front. An interesting new development is that the discount to NAV of the closed-end bullion fund CEF (which holds both gold and silver) has recently contracted to 4.10% after fluctuating in a range of -8% to -10% for quite some time. Even during the 2016 rally phase, a premium failed to develop. We believe that needs to eventually happen in order to confirm bull market conditions. The current discount still denotes skepticism, but at the same time it is actually at a better starting point in that sense if a bigger rally develops from here. |
Gold, CEF’s Premium/Discount to NAV, 2008 - 2017 |
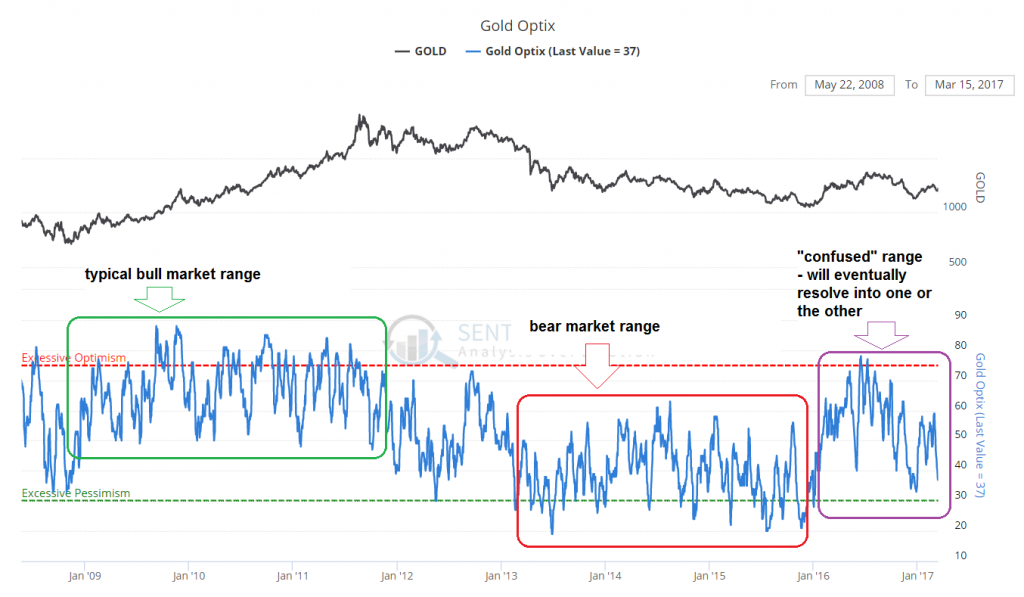
| Lastly, to round out the collection of sentiment indicators, here is one we haven’t shown in while, namely the gold optimism index (or Optix) by sentimentrader. This indicator is an amalgamation of the most prominent sentiment surveys as well as futures/options positions. It currently stands at 37 points, close to the low end of its long term range (the 30 level is considered the “excessive pessimism” threshold).
As we pointed out last year, in bull markets this indicator tends to oscillate in a higher range. Occasionally sharp downward spikes will of course happen in corrections, but similar to many of the other positioning and sentiment data discussed above, the OPTIX will generally behave differently in bull market than in bear market phases and on average reflect a much stronger bullish consensus during the former. |
Gold Optix, Jan 2009 - 2017 |
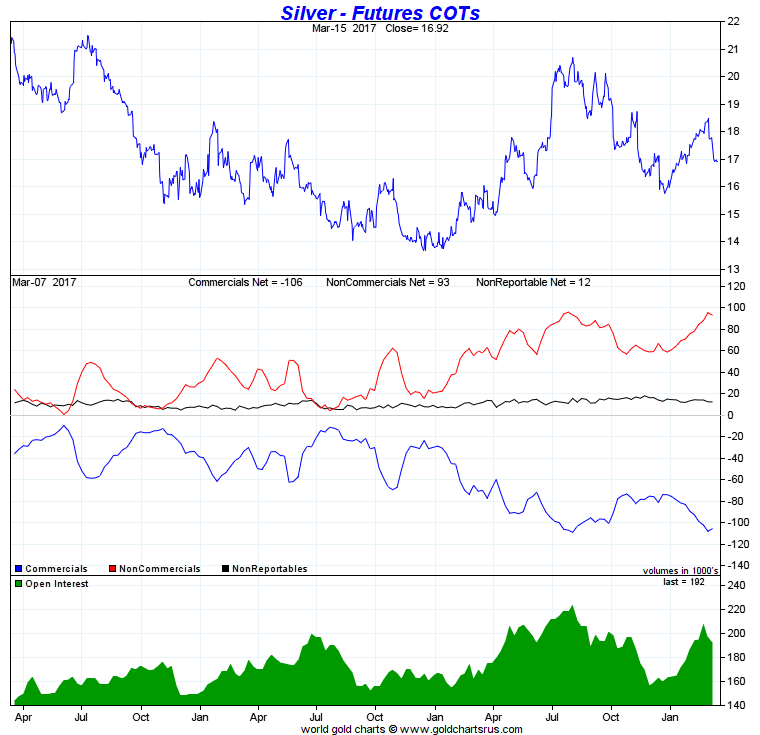
ConclusionIt certainly looks as though speculative positions in gold futures and other sentiment indicators would allow for a rally to develop – even though they are no longer at pessimistic extremes. If gold has successfully put in a higher low late last year relative to the late 2015 low (i.e., a low that won’t be broken again in the near to medium term), such extremes should in fact no longer necessarily occur. There is one problem though that could well hamper the sector in the near term. Gold and silver are historically strongly correlated and the speculative net long position in silver futures indicates that bullish speculators in the silver market are unusually stubborn at the moment. Even the sharp recent sharp pullback hasn’t persuaded them to shed their exposure (the CoT report about to be realeased on Friday after the market close will probably show a more pronounced decline in their net long positions though). It is possible that the absolute size of positions in the silver market will eventually shift to a higher range similar to what happened in crude oil futures, but that remains to be seen. At the moment speculator positioning in silver is definitely a concern for the prospects of precious metals shares and indirectly for gold as well. A situation in which gold eventually strengthens markedly relative to silver is of course definitely conceivable. |
Speculators in Silver, Apr 2016 - 2017 |
In the next part we will look at recent developments in gold fundamentals and ponder what is likely to happen on that front in the short to medium term.
Charts by: StockCharts, GoldChartsRus, SentimenTrader
Full story here Are you the author? Previous post See more for Next post
Tags: Chart Update,newslettersent,Precious Metals


