| The second estimate for GDP was so similar to the first as to be in all likelihood statistically insignificant. The preliminary estimate for real GDP was given as $16,804.8 billion. The updated figure is now $16,804.1 billion. In nominal terms there was more variation, where the preliminary estimate of $18,860.8 billion is now replaced by one for $18,855.5 billion. Therefore, to net out with no change in real terms a slightly less nominal output is reduced by a slightly less overall deflator, mostly attributable to the PCE Deflator. That was revised lower from 2.2% Q/Q (annual rate) to just 1.9%.
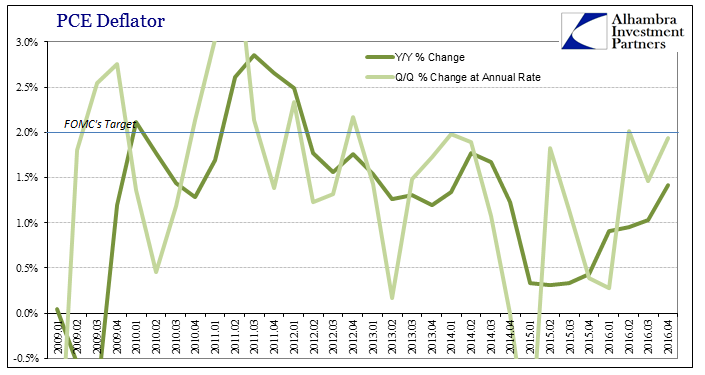
Though the GDP calculation itself is a product of the Q/Q advance in the deflator, the quarterly figure itself does little to aid in exploring the view of inflation as presented by GDP. The quarterly comparison is highly volatile, which is not unexpected when using such short run changes. The PCE Deflator appeared to accelerate in the latest quarter, up from 1.5% in Q3 but down from 2.0% in Q2. The year-over-year change in the index, however, more closely aligns with the measured view of inflation provided by the CPI or the monthly version of the PCE Deflator. |
GDP PCE Deflator QQ YY, January 2009 - April 2016 |
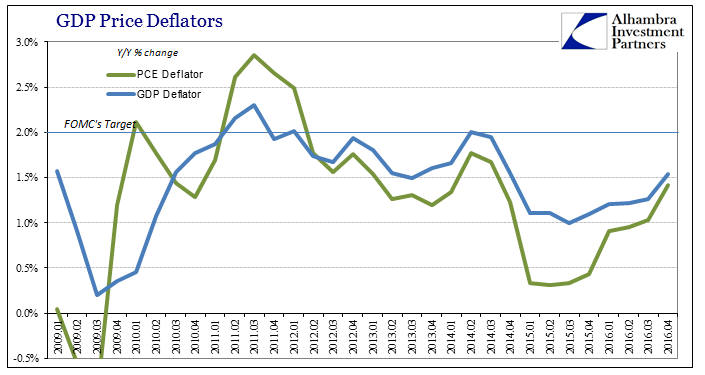
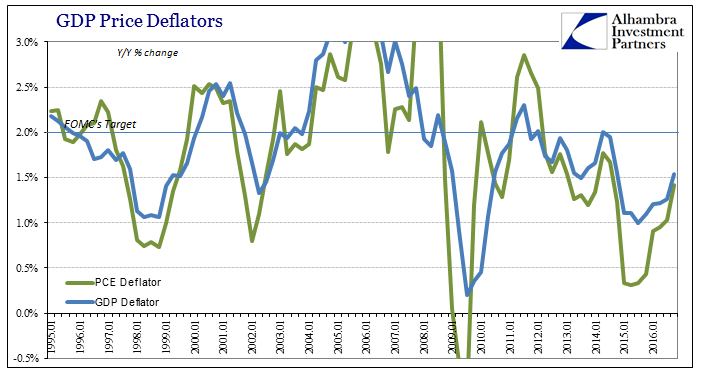
| The annual change (as opposed to the quarterly change at an annual rate) was just 1.420% in Q4, accelerated only slightly from 1.035% in Q3 and 0.956% in Q2. The implied inflation rate is only marginally higher in terms of the overall GDP Deflator, remaining still at the lower levels of the historical context. |
GDP PCE Deflators Recent, January 2009 - April 2016 |
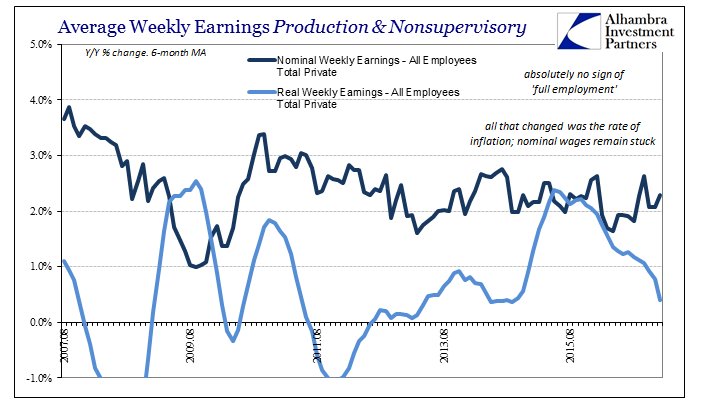
| The latest estimate marks the 9th consecutive quarter with the PCE Deflator less than 1.5%, and the 19th below the Fed’s 2% mandate. Even with oil prices rising rapidly as to the base effects of comparison to the lowest points in late 2015 (and coming up in Q1 to early 2016), there just isn’t an indicative quickening that would be attributable to “full employment.” Economic theory describes the pathology of inflation expectations leading to real economic activity leading to rising wages leading to rising prices. It was always assumed that QE would at least play a big role in setting Step 1.
It is difficult to say if the PCE Deflator will eventually make to 2% in Q1, though outwardly that seems likely to be the case. Staying at or above 2% is quite another thing, one reason why Fed officials have expressed very little concern about inflation of late even though the CPI was at 2.5% in the latest month. Without a further appreciation in oil prices, measured inflation rates will start to come back down again in the middle of this year. The only way that doesn’t happen outside of WTI is if the economy starts to live up to its “full employment” description. Apart from mainstream rhetoric, there is little to suggest that. |
GDP PCE Deflators Longer, January 1995 - January 2017 |
| The only other reason to note the second GDP release is more trivia than serious analysis, except by way of measuring derivatively that rhetoric. In early 2015, the media, through economists in particular, still in a state of near euphoria as to the prospects of economic “liftoff” were shocked when Q1 2015 GDP came in near negative yet again. The term “residual seasonality” was born as a means to try to discredit the negative interpretation of what low GDP might mean. Since the economy was about to take off, they thought, there was no way GDP could be so bad in yet another Q1 (like 2014 and, importantly, 2011).
Given how the rest of 2015 transpired, and the lack of acceleration in 2016, the debate has been rendered almost a footnote, but not quite. The uneven behavior of real GDP was, in fact, a relevant consideration as it was a clear warning that “something” wasn’t right with the real economy. The BEA for whatever reasons (and I hate to think they were more political than not) indulged “residual seasonality” and gave it an honest effort. They adjusted Q1’s going backward (Phase 1) but also committed to studying the phenomenon with intense interest and focus. The second phase of their plans have been completed and released with this latest GDP update. Suffice to say, their conclusions are anything but positive toward the idea, a surprise perhaps only to those who might remain all this time later committed to the liftoff fantasy. The BEA, however, would never put it in such terms:
|
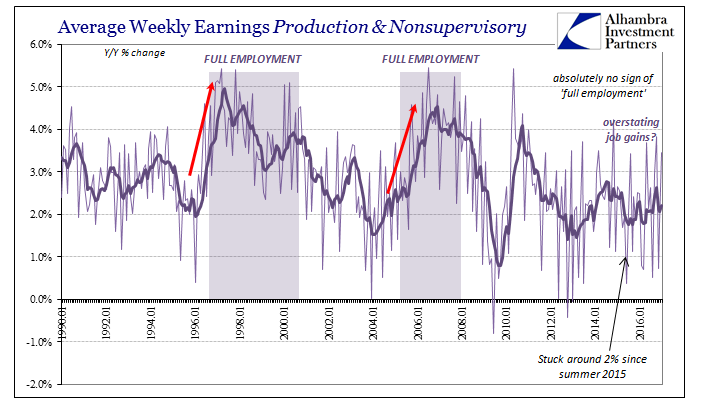
Average Weekly Earnings Production and Nonsupervisory, August 2007 - 2016 |
They found only some debatable “residual seasonality” but more so inconclusive given the criteria for it. This was not really a surprising development, as the BEA had originally responded to the charge back almost two years ago noting it didn’t see it as a problem before. I wrote in May 2015 when it all first became somehow a serious topic:
|
Real Wages Nominal Full Employment, January 1990 - 2017 |
| That leaves unanswered the question about why they undertook seasonal adjustments anyway on the flimsiest of evidence (really “evidence”). That I cannot answer and will thus leave it to your own imagination. At some point, this might matter and therefore should not be tossed arbitrarily down the memory hole. |
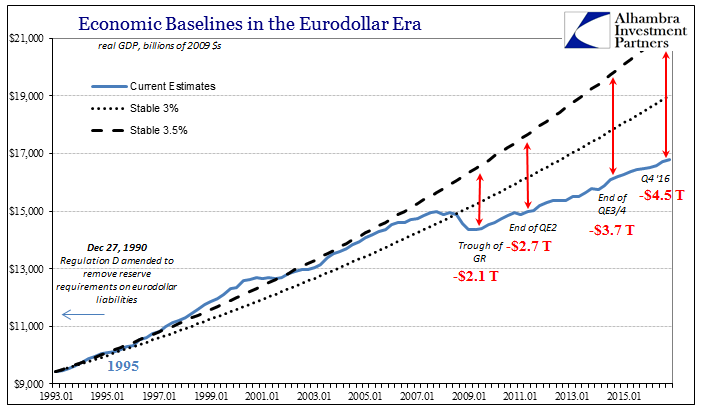
Economic Baselines in the Eurodollar Era, January 1993 - 2016 |
| There is some good to come out of the affair. Phase 3 of the BEA plan will come to fruition in the middle of 2018. The agency will start providing the unadjusted data for GDP and some of its components (it’s not clear to me exactly how much unadjusted data will be released), a part of the GDP picture that has been sorely lacking for a very long time. A small silver lining perhaps for what has shaped up as more sordid than solid analysis. |
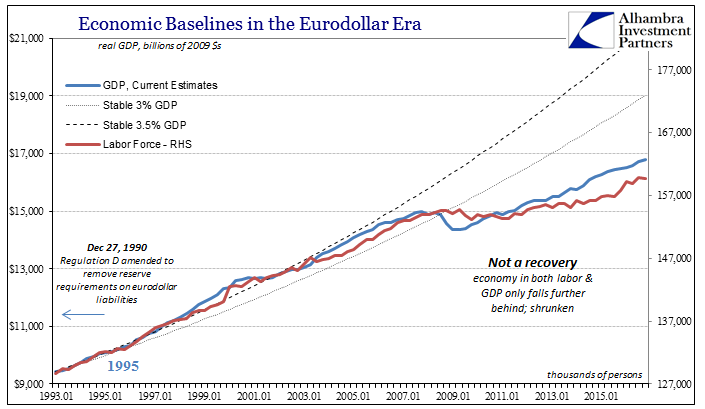
GDP Baseline Labor Force, January 1993 - 2016 |
Tags: currencies,depression,economy,Federal Reserve/Monetary Policy,GDP,inflation,Markets,newslettersent,Nominal GDP,pce deflator,real GDP


