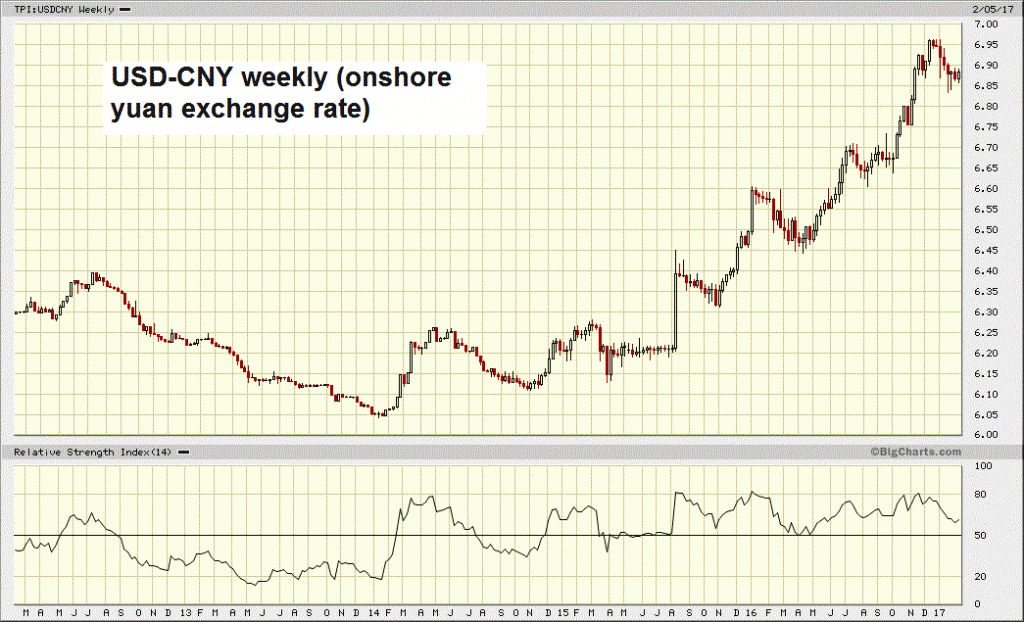
Looming Currency and Liquidity ProblemsThe quarterly meeting of the Incrementum Advisory Board was held on January 11, approximately one month ago. A download link to a PDF document containing the full transcript including charts an be found at the end of this post. As always, a broad range of topics was discussed; although some time has passed since the meeting, all these issues remain relevant. Our comments below are taking developments that have taken place since then into account. It has become a tradition to invite a special guest to the board meeting and we were honored to be joined by Paul Mylchreest this time. Most of our readers will probably know Paul as the author of the Thunder Road Report. He currently covers equity and cross-asset strategy for ADM ISI in London. USD-CNY, the onshore exchange rate of the yuan vs. the USD. After years of relentless appreciation, the yuan topped in early 2014 and has weakened just as relentlessly ever since. The yuan’s top coincided with the beginning of the “tapering” of the Fed’s QE3 debt monetization program and the peak in China’s foreign exchange reserves at just below $4 trillion. There was practically no lead time involved, which is rare. Although the yuan is not convertible and therefore by definition a “manipulated currency” (is there a fiat currency that isn’t manipulated?), the assertion that China’s authorities are deliberately weakening the yuan is erroneous. The opposite is true: they are trying to keep it from falling or are at least trying to slow down its descent with every trick in the book (every intermittent phase of yuan strength since the beginning of the decline was triggered by intervention). Understandably so: due to the close correlation between the level of forex reserves and credit and money supply growth in China, a rapid depletion of reserves is likely to impact the country’s giant credit bubble. One of the moving parts in this equation are bank reserve requirements, which the PBoC essentially uses to control the extent of credit growth triggered by the accumulation of reserves (a.k.a. “sterilization”). These peaked at 21.5% in June 2011 and were since then lowered to 17% to keep domestic credit expansion going. |
Yuan Onshore Weekly |
| Paul took up the issue of dollar liquidity abroad, which has come under pressure as foreign exchange reserves have declined nearly everywhere and the dollar has strengthened. Foreign borrowers have amassed enormous amounts of dollar-denominated debt in recent years (more than USD 9 trillion in total). As the dollar appreciates, it becomes ever more difficult to service and repay this debt.
This may pose a particularly difficult problem for China. The country’s authorities are determined to slow the yuan’s depreciation and the outflow of foreign exchange reserves, both of which have begun in early 2014. At the moment the markets seem oddly unworried by the persistent weakness in the yuan, although they (ostensibly) panicked over it when the yuan reached 6.40 to the US dollar in mid 2015. The fact that the issue has been relegated to the Alfred E. Neuman file ever since (“what, me worry?”) definitely does not mean that it won’t become relevant again. If the mandarins fail to contain the pace of forex outflows, it will very likely return to the forefront of market concerns with a vengeance. |
Cross Currency Swaps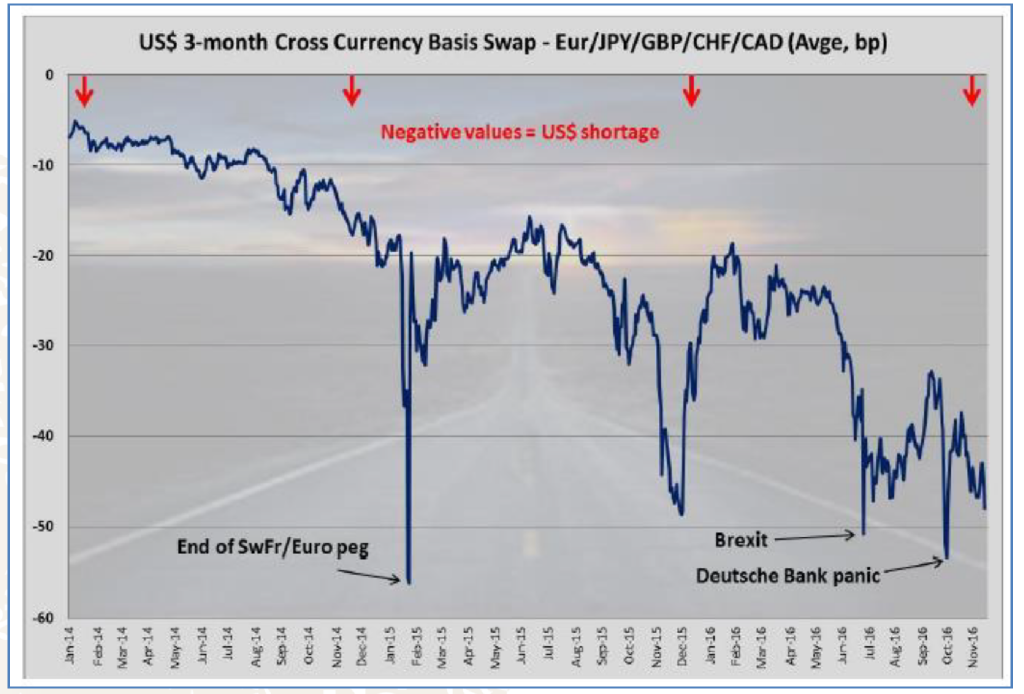 Cross-currency swaps are illustrating the growing pressures on dollar funding abroad (the chart shows an average of the basis swaps of 5 major currencies against the USD) – data sources: ADM ISI, Bloomberg, annotations by Paul Mylchreest (see also his detailed report on the world’s “financial plumbing” here). - Click to enlarge |
The Trump Administration’s Economic PoliciesAnother point the board focused on were some of President Trump’s proposed economic policies. Several of his plans are certainly positive – such as deregulation, defunding of various useless federal agencies, simplification of the tax code and lowering taxes – but others are quite problematic. The problematic ones comprise mainly the planned erection of trade barriers and the administration’s deficit spending proposals. Dr. Shostak remarked on this that tax cuts which are not offset by spending cuts and a reduction in the size of government won’t reduce the burden of government on the economy, which is of course true. In short, one has to be careful about lauding planned tax cuts without taking the issue of fiscal spending into consideration. That said, there is substantial evidence that tax cuts by themselves are likely to increase government revenues (due to the Laffer curve effect). Even though one must be very careful about invoking economic statistics as proof for theoretical arguments (as the statistics are always affected by a multitude of factors), the data presented by Dan Mitchell here are quite convincing. We reproduce a table shown in his article below: |
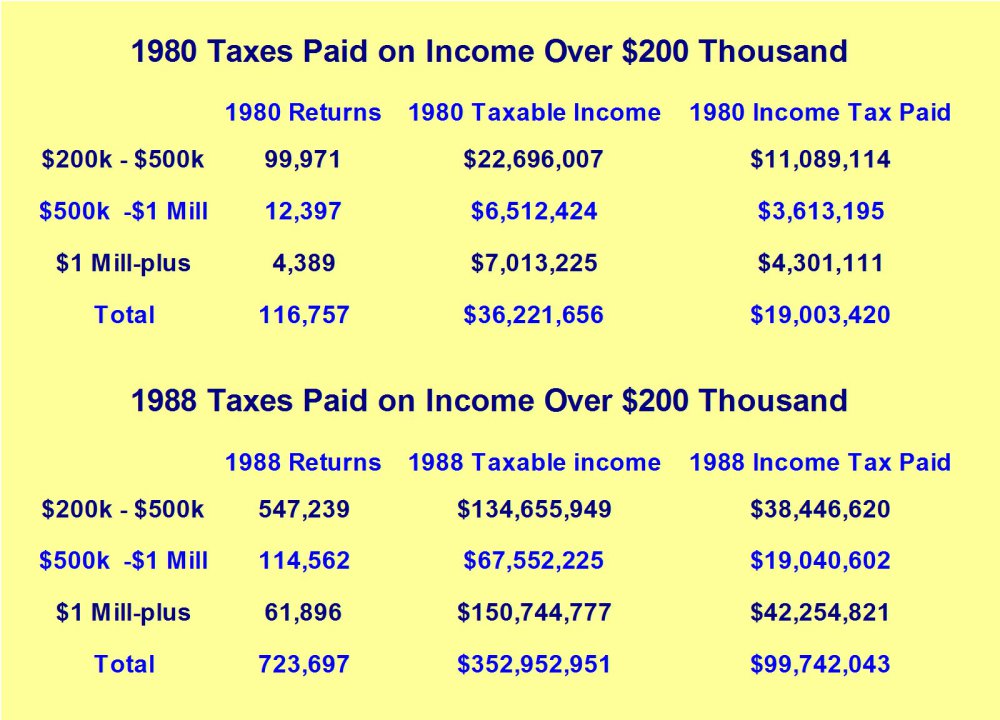 The change in income tax receipts from high income earners after the Reagan tax cuts of the early 1980s, via Dan Mitchell. This certainly appears to provide evidence in support of the famed “Laffer curve” effect. Lower taxes and a decrease in regulations boosted economic growth and incomes, and government tax revenue increased accordingly. While one has to keep in mind that a great many other factors have influenced these trends as well, Laffer’s theory should certainly not be dismissed out of hand – not least because it also makes sense on theoretical grounds. - Click to enlarge |
| We didn’t dwell on the issue of trade at the meeting, but this is a topic that will certainly be discussed on future occasions and readers can expect us to pick it up again in these pages as well. We would note though that president Trump has so far used trade issues mainly as a negotiating device rather than actually imposing any major restrictions.
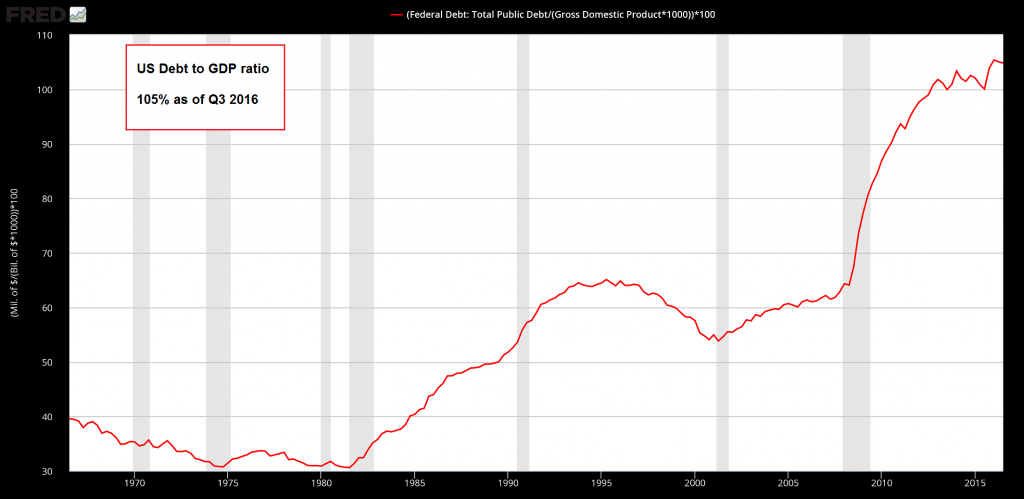
Deficit spending came under scrutiny though. Originally the question was whether a surge in deficit spending made any sense if monetary policy was tightened concurrently. Obviously, this is not a question we can possibly answer in a straightforward manner, for the simple reason that we believe all deficit spending to be harmful to the economy, and the same holds for the manipulation of interest rates and the money supply by central banks. So no, it doesn’t make sense, but not because it threatens to coincide with a tightening cycle, but because it makes no sense, period. It would also make no sense for the government to accumulate fiscal surpluses; not to put too fine a point to it, the entire Keynesian idea of applying “loose fiscal and monetary policy in a slump” and doing the opposite in an expansion phase is complete hooey (even if it sounds superficially reasonable). We won’t go into all the details here, but we will quickly mention two salient points. For one thing, government spending on infrastructure is not magically exempted from the above conclusion. Government bureaucrats cannot possibly gauge the opportunity costs of their spending, which practically guarantees it will be a waste of scarce resources and will mainly benefit cronies – a.k.a. swamp critters (isn’t there still some draining to do?). Secondly, both deficit spending and central planning of interest rates and money supply expansion will alter the economy’s capital structure in a way that is incompatible with the actual wishes of consumers. Economic progress will be hampered and the seeds of a bust will be sown. The main difference between the two methods is that central bank intervention promotes inter-temporal distortions of the production structure, while deficit spending promotes intra-temporal distortions. Initially, both will appear to help the economy by boosting activity, but this is always unmasked as a costly error down the road. |
US Debt to GDP Ratio 1965 - 2016 |
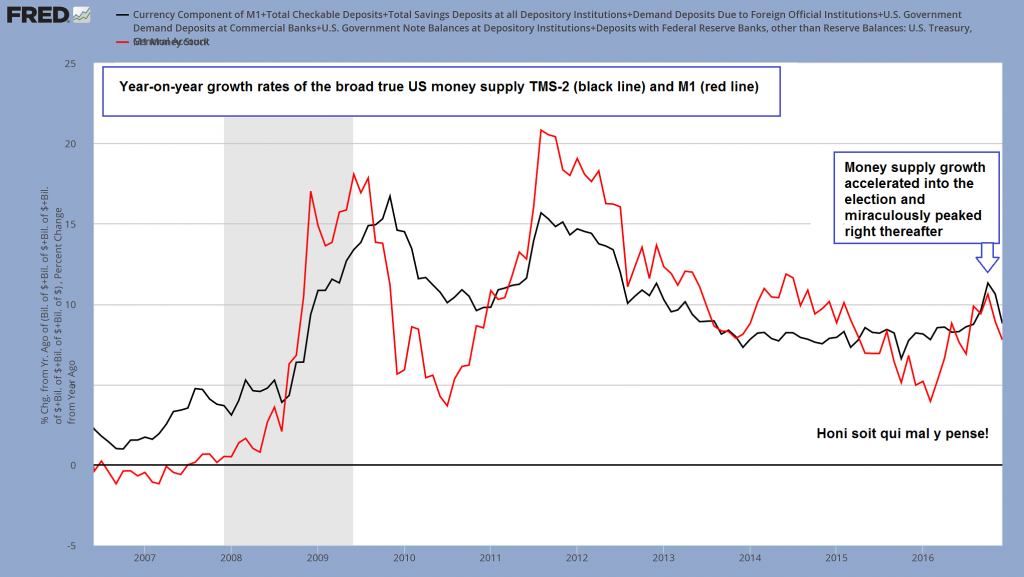
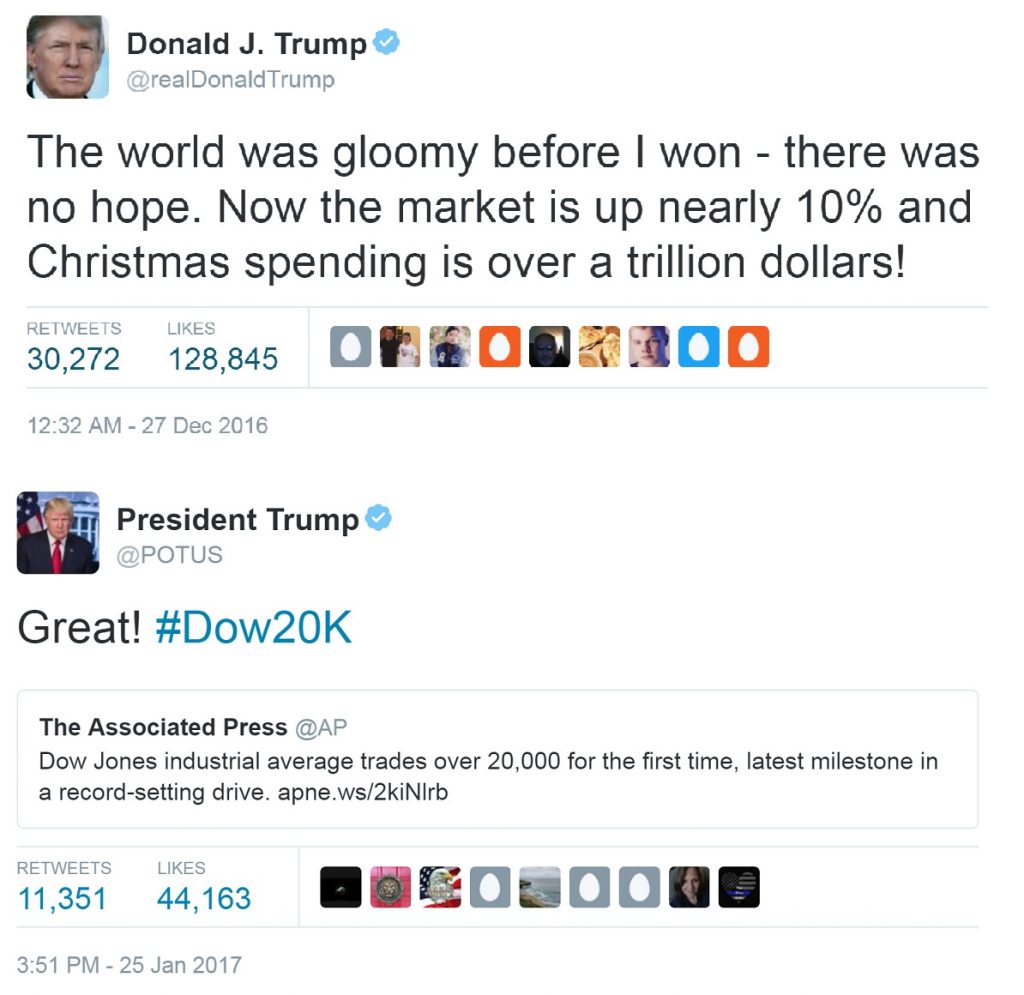
US Money Supply Growth and the MarketsIt is certainly odd that the stock market is so extremely sanguine. The advisory board meeting was held prior to Donald Trump’s inauguration, but in the short time since he was sworn in as president, he has been quite active. It appears as though he wants to implement all, or at least most, of his election promises as quickly as possible (which is both refreshing and slightly scary). However, it remains unknowable to what extent it will be possible for him to do so and what his main focus will be. So why is the stock market behaving as though there is no longer any uncertainty and only good things are likely to happen? Superficially, that doesn’t make much sense and one should certainly expect a reassessment at some point – possibly quite a violent one. So what gives? A crucial driver of the market’s performance is money supply growth, which has accelerated significantly prior to the election (you have one guess as to why the Fed would tolerate an acceleration in money supply growth just before the election, in spite of having officially embarked on a “tightening cycle”). Greater money supply and credit growth have a lagged effect on prices, but asset prices tend to be affected first and to the greatest degree. As can be seen above, money supply growth has decelerated notriceably again since then – i.e., right after the election. What a coincidence! However, due to the lag with which the effects of accelerations and decelerations in money supply growth tend to play out, share prices have continued to strengthen so far. Also, the current y/y growth rate of TMS is approximately 8.80% and that isn’t exactly slow. Donald Trump’s victory was undeniably a boon for economic confidence. To mention an example, small business confidence has soared according to the NFIB survey (it is actually approaching “contrary indicator signal” territory). We would nevertheless strongly advise the president to refrain from trying to “own” the stock market rally, because doing so will condemn him to ownership of the eventual bear market as well. |
TMS and M1 Growth 2006 - 2016 |
| It is well known that the decisions of stock market participants are not always very rational. In fact, a good case can be made that decisions to buy or sell are in many cases driven be emotions rather than a rational assessment of risk and reward – even if these decisions are rationalized after the fact. It would be wrong though to conclude that market participants are entirely bereft of logic.
As we have mentioned previously in these pages, we believe the Republican “clean sweep” has contributed to the decision of investors to pile into the market. A number of the policies that are likely to be implemented easily with Republican control of the administration and both houses of Congress are considered to be good for Wall Street. In view of the recent public yammering by Mario Draghi about the possibility of the Trump administration easing excessive financial sector regulation, we guess this assessment is correct. As an aside to this: we find it interesting that Mr. Draghi believes that now is an opportune time to try to cover his behind. We say this because it should be crystal clear that it isn’t going to be Mr. Trump or an alleged “lack of regulations” that is going to be responsible for the next crisis. The people deciding on monetary policy at the major central banks deserve to be blamed and Mr. Draghi is obviously one of them. |
|
| The next crisis is not a question of “if”, but of “when”. It cannot be prevented anymore, only its timing is open to question. We said it before and we’ll say it again: Trump has no time machine, he cannot go back and stop these insane money printers from doing what they have done. Draghi’s lame attempt to assign responsibility for the crisis to him in advance is beyond ludicrous.
With respect to the stock market we also mentioned the seasonal pattern during post election years, which Dimitri Speck discussed in detail in “Regime Change, the Effect of Trump’s Victory on Stock Prices”. Obviously the market has so far failed to conform to the pattern, as it remains near its peak. In light of current sentiment and positioning extremes, one should remain open to the possibility of a slightly delayed move though. |
S&P 500 Index, Daily - March 2016 - February 2017(see more posts on S&P 500 Index, )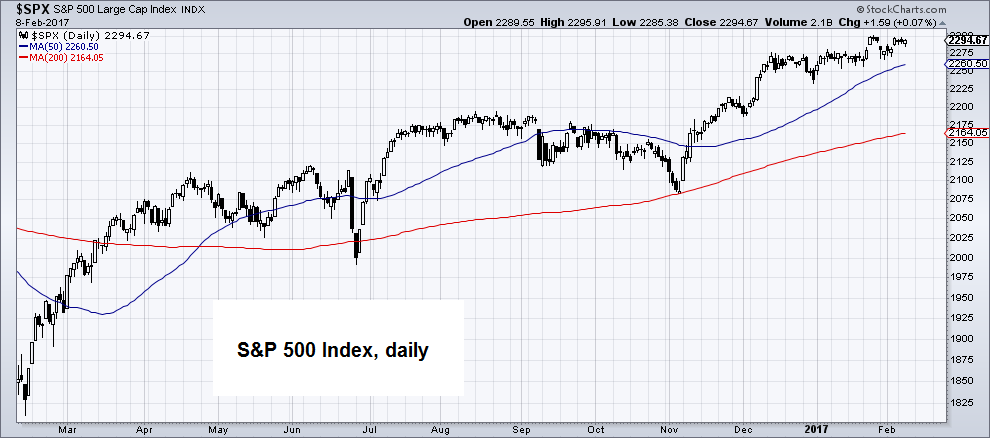 S&P 500 Index, daily (SPX). We must admit that this is not a bearish looking chart. It gives no indication yet that anything is amiss (except perhaps for the fact that low volatility side-ways moves in stocks are often a precursor to corrections). And yet, many of the sentiment and positioning data we watch are at or near extremes. The typical initial post-election correction begins in January and ends in late February, so there is still time for a delayed move; note that sizable corrections can occasionally happen in a very short period of time (see August 2015 as a recent example). - Click to enlarge |
Global Money Supply Growth and ConclusionThere is a lot more in the transcript; e.g. the interesting question of whether gold and the US dollar might once again surge in tandem under certain circumstances was discussed as well. One thing readers will take away from the transcript is that money supply and credit growth not only continued to be strong in the US, but elsewhere as well. In China money supply growth recently peaked at close to 25% y/y and currently stands close to 20%; euro area money supply growth (M1) peaked at well over 14% y/y in 2015 and still stands at slightly more than 9%. Even Japan’s money supply growth (M1) finally took off in 2016 and also reached nearly 9% at the end of the year (by the way, this hasn’t happened in a very long time and we plan to investigate what precisely prompted this acceleration).
|
Euro Area M1 1980 - 2016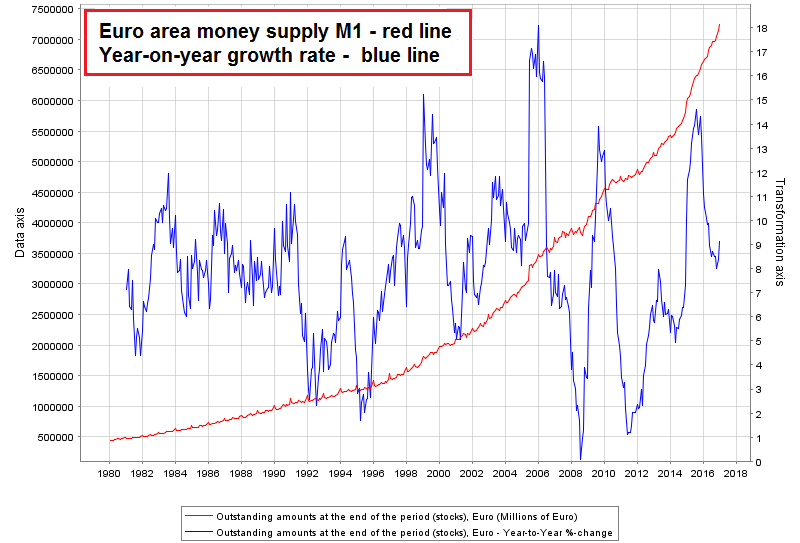 Euro area M1 (red line, lhs, millions) and y/y growth rate (blue line, rhs, percent). The growth rate is down from its most recent peak, but still brisk at more than 9%. The euro area’s money supply has now nearly quadrupled since the introduction of the euro in 2000 and is up nearly 15 times since 1980. The fiat money system is insane. - Click to enlarge |
| A chart of China’s narrow money supply growth can be found in the transcript. Below we show charts of euro area and Japanese money supply data – we use the narrow money supply aggregates M1 in both cases. Note that these are not precisely equivalent to the US true money supply measure, but they come fairly close and are of greater analytical relevance than broader aggregates such as M2 or M3, which contain non-money items as well.
A global economic recovery is widely held to be underway, but relative to the pace of money supply expansion all over the world, it is surprisingly lame. Note, so-called “economic growth” visible in aggregate data that is primarily or even solely supported by such obscene and persistent monetary pumping is essentially a mirage – much of it is simply capital consumption masquerading as growth, the result of falsified economic calculation. Still, it is no wonder that stock markets all over the world have performed well in light of this flood of money looking for a home. It should not be taken for granted though that this will continue. |
Japan Money Supply Data 2004 - 2017 The BoJ has finally also managed to egg on a sizable expansion in money supply growth with its utterly reckless “QQE” debt monetization scheme (lately coupled with negative deposit rates and “yield curve control”). Japan’s system remains an excellent candidate for coming off the rails first due to its headstart. - Click to enlarge |
Download Link:
We hope you will enjoy this quarter’s transcript. It can be downloaded here: Incrementum Advisory Board Meeting, Q1 2017 (PDF).
Charts and tables by: BigCharts, ADM ISI / Paul Mylchreest, Dan Mitchell, St. Louis Federal Reserve Research, StockCharts, ECB, BoJ
Full story here Are you the author? Previous post See more for Next post
Tags: central-banks,Chart Update,commodities,newslettersent,On Economy,S&P 500 Index,The Stock Market


