Summary:
The Dollar Index’s technical tone has deteriorated.
It is corresponding to the easing of US rates and a narrowing differential.
The risk is that the correction can continue in the coming days.
| We took a closer look at the US Dollar Index last week. In our write up, we noted highlighted the importance of the 100.60 area. We warned that a break of that support could signal the start of a deeper correction as opposed to a shallow consolidation. Two targets were offered, 99.70 and 99.00.
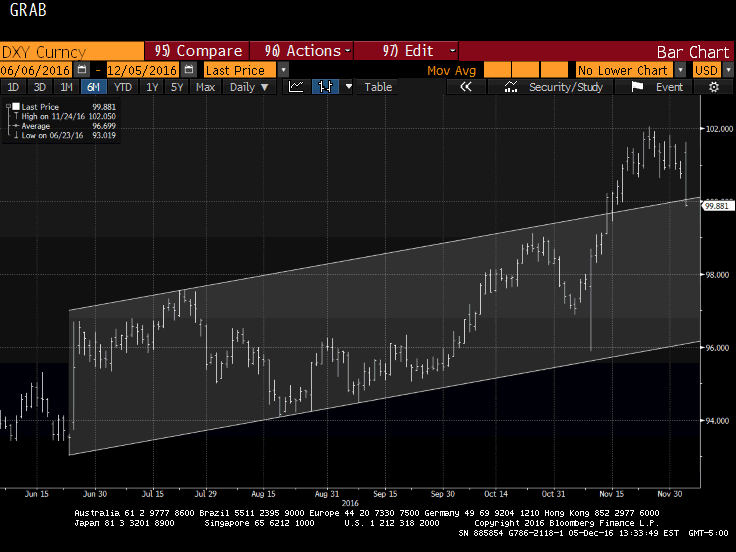
Before the weekend the Dollar Index briefly slipped through the support before closing above it. However, today there is no doubt. The Dollar Index is posting a large outside down day. Initially it rose through the pre-weekend highs and subsequently push there the recent lows, and appears likely to finish below the pre-weekend low of 100.62. The technical condition has deteriorated. The RSI, MACDs, and Slow Stochastics have all turned down. The Dollar Index has been sold through the 20-day moving average for the first time since the US election. The five-day average is poised to move below the 20-day average for the first time in almost a month. As this Great Graphic, created on Bloomberg shows, the Dollar Index is flirting with the upper end of the old trend channel. The top comes in near 100.00. The 99.70 level corresponds to a 38.2% retracement of the post-election rally. The Dollar Index has already been down to 99.85 today. At this juncture, it seems likely that a deeper correction will be forthcoming. The 99.00 area corresponds to the 50% retracement of the post-election rally. It is also the minimum measuring objective of the potential head and shoulder topping pattern. The head was former near 102.00 on November 22-25. The neckline was 100.65. Rotating the pattern over it neckline would take it to 99.35. Also, the high from the second half of October is found a little above 99.00 as well. For the record, the 6.18% retracement of the post-election rally is found near 98.25. On November 9, the day after the US election, the Dollar Index closed near 98.50. The correction we envision for the Dollar Index is likely to coincide with a correction in rates. We note that the 10-year yield is already about 10 bp below last week’s high. The technical indicators for the 10-year Treasury note futures suggest more upside potential (lower yields). The US premium over Germany on two-year month recorded a multi-year high near 188 bp on December 1. The premium now is 181 bp and is heavy. We see potential toward 170-175 bp. |
DXY Currency |
Full story here Are you the author? Previous post See more for Next post
Tags: #USD,Great Graphic,newslettersent


