George Dorgan
My articles My siteAbout meMy videosMy books
Follow on:LinkedINTwitterSeeking Alpha
CFA SocietyEconomicBlogs
It is a very interesting discrepancy:
Health care prices as measured by Swiss Statistics are falling, but Swiss insurers continue to hike premiums.
There are three possible interpretations:
- The oligopoly of insurers continue raising their administrative costs and reserves, and consumers have to pay.
- We consume higher and higher quantities of health services. This would be the reading of a “mainstream economist”.
- Swiss Statistics is hiding inflation. Doing so, the Swiss National Bank can keep rates low and continue weakening the franc.
Comparing different data sources, our verdict is that Swiss Statistics is keeping consumer price inflation artificially low, while interpretation 2 is true only to a limited extend.
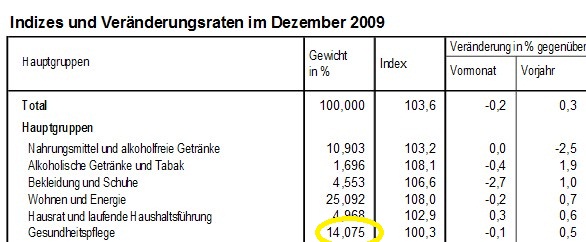
2016 Health Care Prices Have Fallen By 0.6%Swiss Statistics regularly publishes the Consumer Price Index. In the year 2016, health care prices have fallen by 0.6% against the previous year: one major reason is the stronger franc that allowed for buying health equipment at lower price abroad. We should remind that Swiss Statistics uses these effective inflation for the CPI, but not the perceived inflation as measured by insurance premiums.
|
Falling Health Care Prices in Switzerland(see more posts on health care, )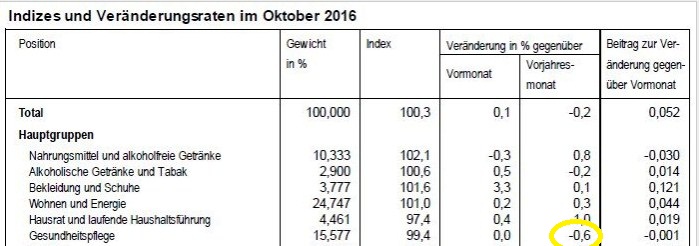 . |
|||||||||||||||||||||||||||||||||||||||||||||||||||||||||||||||||
Insurers continue to raise premiums,..Consumer perceive inflation via the health insurance premiums have risen by 3% this year. The comment from Swiss Statistics is
|
.. while health care prices according Swiss Statistics are fallingdata from Consumer Price Indices releases In the United States health care prices are rising by 4.3% despite a strong dollar.
|
|||||||||||||||||||||||||||||||||||||||||||||||||||||||||||||||||
Version 1: Insurers have increasing admin costsBut Insurers claim that costs per patient are risingWe double-checked our macro data at micro level and looked at one insurance company. For this compary, benefits per person rose from 3120 francs in 2012 to 3776 CHF, benefits rose in line with premiums.
|
Numbers from a major Swiss health insurance
source Visana |
|||||||||||||||||||||||||||||||||||||||||||||||||||||||||||||||||
Version 2: We consume more and more health care quantities (but prices are falling)At first sight, one could think that insurers just raise prices, while their costs are falling, obviously an abuse of their oligopoly. It might be a part of the issue. But one other aspect is not price but quantity. We all consume more health care, but costs for a single medicine might be unchanged for years. The consumer price index does not capture the quantity consumed directly. Swiss Statistics captures it indirectly with the weight in the consumer basket:
Hence a difference of 1.5%. Health care increase by 11% in total, from 14% to 15.5% of the CPI basket.
The total CPI index did not change since 2009 (and even 2005) Based on Swiss Statistics CPI figures, prices barely changed.
|
.
|

Based on Swiss Statistics Data Consumers must pay higher premiums, while total costs for insurers are stable
Quantities: Barely changed nominal GDP per capita
Swiss nominal GDP per capita has barely changed since 2010: it increased by 0.6% in total (not per year!). GDP is rising but population is increasing, too.
This implies that quantities per capita consumed have not changed, for most components of the CPI.
But health care quantities have risen by 1.5%
But as we have seen above, health care quantities consumed have risen by 11, this is 1.5% per year, while quantities consumed of other good and services have barely changed.
This leads to the following:
The weight adjustment (aka quantity consumed) only justifies an increase of 1.5% per year, while costs per unit – as denoted in the CPI – have fallen by nearly 1% per year. This nearly equals out to zero.
But the data from the insurers proves the contrary.
Conclusion
One of the two is wrong in the Swiss CPI
- Prices of health care services
- The weight of health care component in the CPI basket
Version 3: Is Swiss Statistics hiding real inflation data?
It appears that Swiss Statistics is just artificially keeping inflation rates low so that the Swiss National Bank can keep rates low for longer.
Clearly, “being creative” with the CPI is easier than cheating with the insurance premiums.
Healthcare is taking a bigger and bigger pie of consumption and will end inflation
Healthcare is taking a bigger and bigger pie of consumption. We showed that in Switzerland prices per unit were falling (thanks to the stronger franc). But in the United States, both health care prices and quantity are rising.
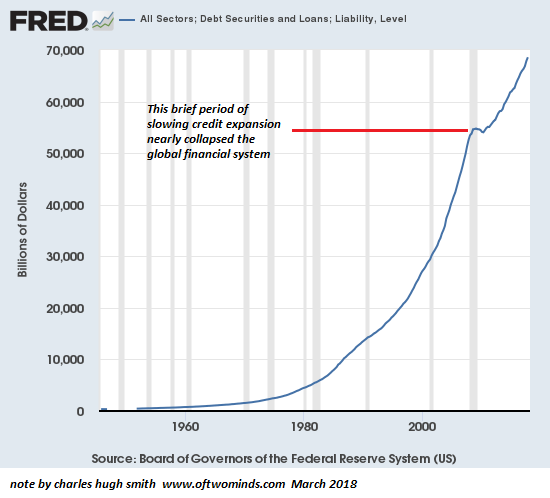
For reference see my global comparison of CPIs or the newest post by Charles Hugh Smith Healthcare: Inflation Hidden in Plain Sight
If we do not stop our behaviour as for health, then finally most of our consumption will be for health care
Finally we understand that this period of low inflation is only a temporary period. With the change in life expectancy and less working people per pensioners, prices must and will rise again.
For completeness here the full German data release from Swiss Statistics
Prämienwachstum 2015-2016 dämpft die Entwicklung der verfügbaren Einkommen um 0,2 Prozentpunkte
Neuchâtel, 22.11.2016 (BFS) – Der Krankenversicherungsprämien-Index (KVPI) verzeichnet für das Prämienjahr 2016 ein Wachstum von 3,0 Prozent gegenüber dem Vorjahr. Der KVPI erreicht damit einen Indexstand von 178,5 Punkten (Basis 1999=100). Anhand des KVPI lässt sich die Auswirkung der Prämienentwicklung auf das Wachstum des verfügbaren Einkommens schätzen. Gemäss der KVPI-Modellrechnung des Bundesamts für Statistik (BFS) beeinflussen 2016 die steigenden Prämien das Wachstum des verfügbaren Durchschnittseinkommens um 0,2 Prozentpunkte.
Der KVPI erfasst die Prämienentwicklung der obligatorischen Krankenpflegeversicherung und der Krankenzusatzversicherung. Die Prämien für die Krankengrundversicherungen sind 2016 um 4,8 Prozent gestiegen und erreichen damit einen Indexstand von 204,0 Punkten (Basis 1999=100). Diese Schätzung entspricht der Prämienentwicklung des gesamten Versichertenbestandes im Durchschnitt.
Die erhobenen Prämien für die Krankenzusatzversicherungen gehen 2016 um 2,9 Prozent gegenüber dem Vorjahr zurück. Dabei sinken die Prämien der allgemeinen Spitalzusatzversicherung um 13,1 Prozent, während jene der halbprivaten um 0,7 Prozent und jene der privaten Spitalzusatzversicherung um 0,6 Prozent ansteigen. Für die Zusatzversicherung insgesamt ergibt dies für das Prämienjahr 2016 einen Indexstand von 124,1 Punkten (Basis 1999=100).
Prämienentwicklung beeinflusst das verfügbare Einkommen
Die Entwicklung der Krankenversicherungsprämien verringert gemäss der BFS-Schätzung das potenzielle Wachstum des geschätzten verfügbaren Durchschnittseinkommens zwischen 2015 und 2016 um 0,2 Prozentpunkte. Wären die Prämien im gleichen Zeitraum stabil geblieben, hätte dieses Geld den Haushalten zusätzlich für Konsum- oder Sparzwecke zur Verfügung gestanden.Prämienerhöhungen belasten – ähnlich wie höhere Steuern oder andere Versicherungsbeiträge – das Budget der privaten Haushalte. Zur Messung dieses Effekts bietet sich der Einfluss auf das verfügbare Einkommen an. Es entspricht dem Einkommen (Erwerbseinkommen, Zinsen, Renten, Rückerstattungen und Verbilligungen der Versicherungen und sonstige Einkommen) abzüglich der so genannten Transferzahlungen (beispielsweise Steuern, Sozial- und sonstige Versicherungsbeiträge) – also dem Betrag, der effektiv für Konsum- und Sparzwecke zur Verfügung steht.
Schweiz Krankenversicherungsprämien 2000-2016
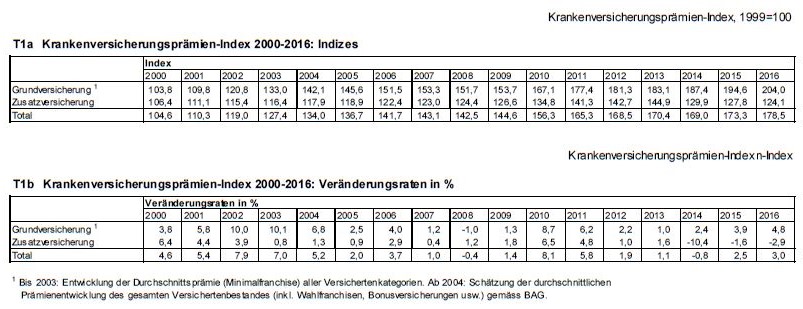
. - Click to enlarge
Tags: health care,newslettersent