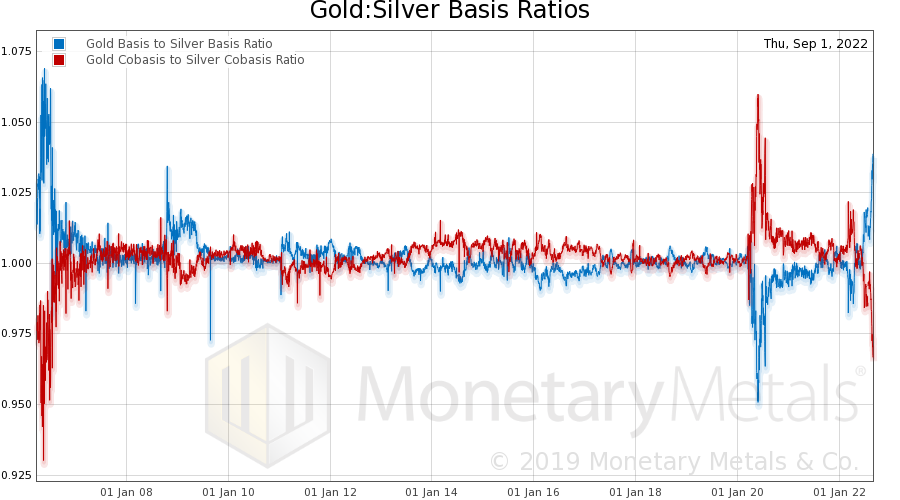
See the introduction and the video for the terms gold basis, co-basis, backwardation and contango.
The Cost of CarryThe prices of both metals were down this holiday-shortened (Labor Day in the US) week, especially on Friday. The decline corresponded to a spike in interest rates. Of course everyone watched the action of the stock market on Friday. Whatever the proximate cause, the root is credit. When borrowing to buy assets does not work, then selling assets to repay debt is required. It could be companies who bought their own shares, it could be European banks. It could be leveraged investors speculators in their E-trade accounts. This leads us to another reason why a high basis is a bearish signal for the USD price of a metal. The basis is the carrying cost. One month ago, if you bought a December silver contract, you paid a big premium. As we recall, it was around 14 cents per ounce. As you hold that contract, this premium decays. If you wait until First Notice Day, it could be completely gone or even negative. That is, you may get a few pennies under the spot price to sell the contract. If you roll the contract—i.e., sell December and buy March—you will incur that cost of carry again. Think of this like buying a house, not to live in, but just to await a higher price. Every month, you have to pay taxes, insurance, and a guy to mow the lawn. The more that adds up, the more urgency you will feel to sell the house (we won’t address renting it to cover the costs, as there is no way to rent a futures contract). The higher the basis, the bigger this steady erosion of the investor’s speculator’s capital credit. It’s a nagging incentive to close the position that, at some point, must and will be heeded. Of course, once the selling begins then the price falls, adding to the losses. Last week, we said:
This week, the price did not quite fall back to the level prior to last week’s labor report fueled spike, but it came close. |
|
Fundamental DevelopmentsRead on for the only true picture of the fundamentals of the monetary metals. But first, here’s the graph of the metals’ prices. |
|
Gold-silver ratioNext, this is a graph of the gold price measured in silver, otherwise known as the gold to silver ratio. It rose 1.5 points this week. |
|
Gold basis and co-basis and the dollar priceHere is the gold graph. The price of gold started moving up this week, but then fell back to unchanged (OK, up a buck) from last week. The October basis (i.e. abundance) was down, and the co-basis was up. However, that was not true for farther-out contracts (next week, we will switch to the December gold contract). The Monetary Metals fundamental price of gold is down a few bucks from last week, just under the market price now. |
|
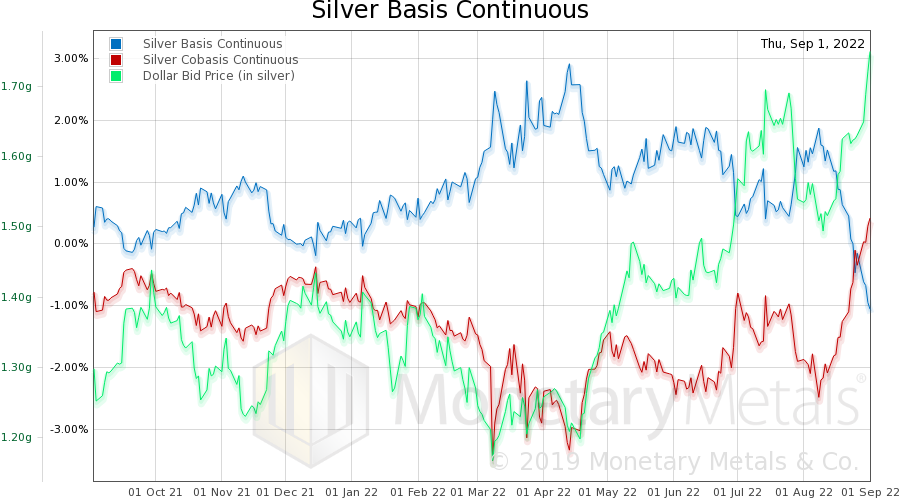
Silver basis and co-basis and the dollar priceLet’s look at silver. In silver, we had a dramatic price move downward. We would expect that to be driven by the selling of futures. If so, that would result in a falling basis and rising co-basis. And sure enough, that is what happened. The fundamental price is up about 50 cents, but still in the mid 17’s. We recall a silver permabull once calling silver the “good news metal”. Well, if that be true then it is possible that it is also the “bad news metal”, the price of which will fall along with stocks in a declining economic and credit environment, growing inventories and more importantly inventory-to-sales ratios, disappointing sell-through, etc. |
Charts by: BarChart, Monetary Metals
Full story here Are you the author? Previous post See more for Next post
Tags: dollar price,gold price,gold ratio,newslettersent,Precious Metals,S&P 500 Index,silver,silver basis,Silver co-basis,silver price,silver ratio


