Summary:
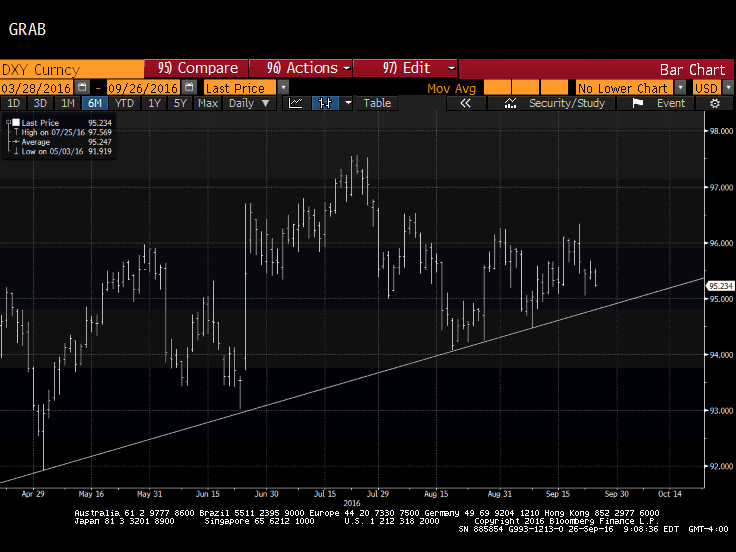
DXY has been holding an uptrend since early May.
It looks set to be tested near-term and technical indicators suggest it may not hold.
Here are the two scenarios of penetration.
| The US Dollar Index has been trending higher since early May. This Great Graphic, created on Bloomberg shows, that it has been successfully tested several times.
It appears set to be re-tested in the coming days. It comes in near 94.80 today and rises a little more than two ticks a day to finish the week near 94.90. Technical indicators, like the RSI, MACDs, and Slow Stochastics suggest there is reasonably good chances that the trend is violated. We see two main scenarios. The more benign of the two is that the violation is a function of a broad sideways movement. In this case, the immediate target is 94.45 the low from September 8 upside reversal. Below there, is the congestion from the second half of August in the 94.05-94.25 area. The other scenario warns of deeper losses. It notes that the pullback in the second half of August already completed the 61.8% of the run-up from the early May low (~91.90) to the late-July high (~97.57). Under this scenario, the Dollar Index gains since mid-August was a correction of the down leg from late-July. The late-August high and last week’s high stalled near 96.25, a corrective retracement target. The risk is a return to the 92.00-93.00 lows from Q2. |
US Dollar Index(see more posts on Dollar Index, ) |
Tags: #USD,Dollar Index,DXY,Great Graphic,newslettersent


