Summary:
The bottom of the US wage scale is rising.
The added wage costs are being blunted by less staff turnover, hiring and training costs.
It is consistent with our expectation of higher price pressures.
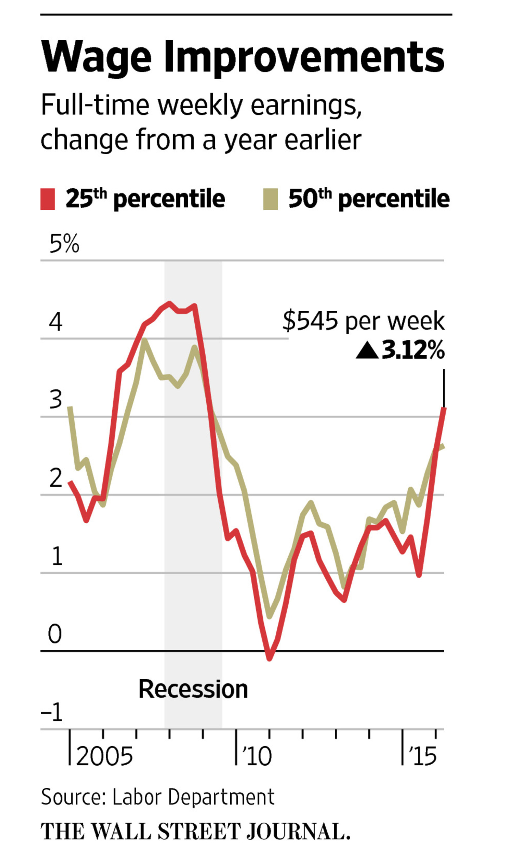
| This Great Graphic comes from the Wall Street Journal. It shows what is happening to the pay of the least compensated in the US. Their pay is going up at a pace that is exceeding the averages and inflation.The data is from Q2 16. Weekly wages for full-time employees in the 25th percentile, earning about $13 an hour, are up about 3.1% from a year ago. The Labor Department data show that this is the largest increase since 2009. The pace of increase exceed the pay of median workers who make about $20 an hour for full-time work.
While many companies who are giving their lowest paid workers raises are broadcasting it widely and loudly, they seem to have barely re-discovered good business practices that Henry Ford found more than 100 years ago. Reports suggest that employee turnover at call centers has dropped and employee satisfaction surveys show improvement. There are reports showing lower employee turnover and a decline in hiring and training costs. Alan Krueger, a former Obama adviser, was quoted in the WSJ arguing that the pay increases was a “hint” of a corporate shift toward more profit-sharing. This seems a bit of an optimistic read. However, more compellingly, he argues that the pay increases show that “wage policy is not fully dictated by the market.” A strictly market-driven approaches would set different wages in different cities. There would be no national wage policy. Since 2014, WSJ reports, 26 states have raised minimum wage, as have many cities. The federal minimum wage has been at $7.25 for seven years and counting. This is consistent with our macro call for a continued increase in US price pressures. Our argument sits on three legs: rents, medical services, and wages. We anticipate one hike this year, and are penciling in two for next year. |
Tags: Great Graphic,inflation,newslettersent,wages


