Evil Speculator
My articles My siteAbout meMy videosMy books
Follow on:TwitterFacebookYoutubeGoogle +
Net LinesIt’s that dreaded day after Independence Day. The weather is gorgeous and I don’t really feel like trading either. The thought of just phoning it in had occurred to me, but as the new month just rolled over I thought I may as well take another peek at our monthly charts. Which uncovered quite some interesting perspectives that I’m eager to share. But no worries – we’re keeping it light and easy today. Consider this a purist’s approach to market analysis as we’re going to ignore everything but Net-Lines. So what are Net-Lines? Before we get into the thick of it let’s quickly cover the concept of Net-Lines, which is purely price based and as such I don’t consider them ‘indicators’ in the traditional sense. There are in fact two types of Net-Lines, one for the buy and one for the sell side. The rules are pretty trivial: Net-Line Buy Level (NLBL): Wait for three consecutive lower lows, then take the high of the first candle as your NLBL. The push above that high is your signal to go long. Net-Line Sell Level (NLSL): Wait for three consecutive higher highs, then take the low of the first candle as your NLSL. A breach below that low is your signal to go short. |
 It’s that dreaded day after Independence Day. The weather is gorgeous and I don’t really feel like trading either. The thought of just phoning it in had occurred to me, but as the new month just rolled over I thought I may as well take another peek at our monthly charts. - Click to enlarge |
Spoos, monthly – net lines illustratedThat’s pretty simple, isn’t it? No exotic mathematical formulas or price derivatives which may require a PhD in quantum physics to fully grasp. The whole idea here is to identify price inflection points as well as trending behavior. If you’ve been visiting the lair for a while then you know I have been using Net-Lines in the context of our market analysis for many years now. So let’s get to the goods. Usually we focus on short term and daily charts but today we’ll be exclusively looking at monthly panels. The first one is the E-Mini and it’s the one that actually inspired me to write this post. If you look at the price action over the past five years then what do you see? A lot of red lines below it, correct. Those are monthly Net-Line Sell Levels and we’ve been trading above them almost the entire time. That is bullish of course. However, what is it you are NOT seeing? Green Net-Line Buy Levels (NLBLs) – because there had only been one since summer of 2010, and it was quickly taken to the woodshed. A lack of NLBLs indicates strong trending price action which is unable to produce three consecutive lower lows. On the inverse however we see a ton of Net-Line Sell Levels (NLSLs) as the direct results of repeatedly producing three consecutive higher highs. |
 It’s that dreaded day after Independence Day. The weather is gorgeous and I don’t really feel like trading either. The thought of just phoning it in had occurred to me, but as the new month just rolled over I thought I may as well take another peek at our monthly charts. - Click to enlarge |
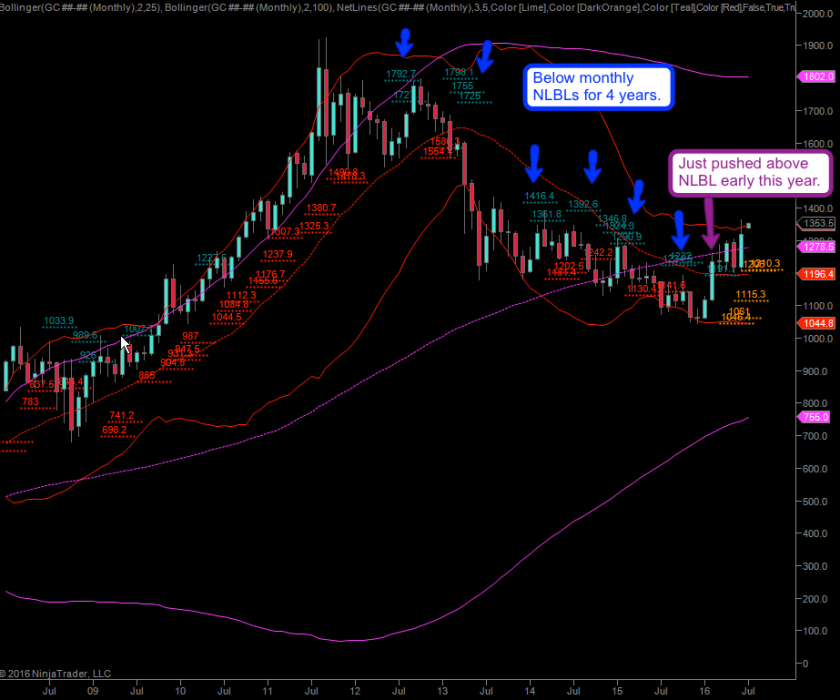
A New Market PhaseNow clearly something has changed in the past year or so. Because in the course of one year we have produced not just one but five monthly NLBLs. And we keep knocking against it, thus far however all those Net-Lines have been coalescing into a pretty solid wall. There are two ways of interpreting this of course. One – we’re building long term resistance which will eventually drag us much lower. Two – we’re in a sideways correction and if we manage to push above the wall near 2100 then it’s happy days again. I think both perspectives have merit as I have long learned that markets can remain irrational for much longer than most could imagine. But the take away message for now is that there is long term bearish potential, as long as the wall stands. Should it be breached then the bulls may just get another lease on life. Which makes this current market period and especially the coming fall season a very exciting moment in time. But we’re just getting warmed up. There’s a lot more. Here’s gold which, not surprisingly, has been doing the exact inverse over the past four years. You see a lot of green NLBLs which are never so much as being challenged. Then early this year gold finally manages to push above a monthly Net-Line Buy Level and remained above it. And now it is in the process of breaching its upper 25-month Bollinger and there is nothing but air above. |
 It’s that dreaded day after Independence Day. The weather is gorgeous and I don’t really feel like trading either. The thought of just phoning it in had occurred to me, but as the new month just rolled over I thought I may as well take another peek at our monthly charts. - Click to enlarge |
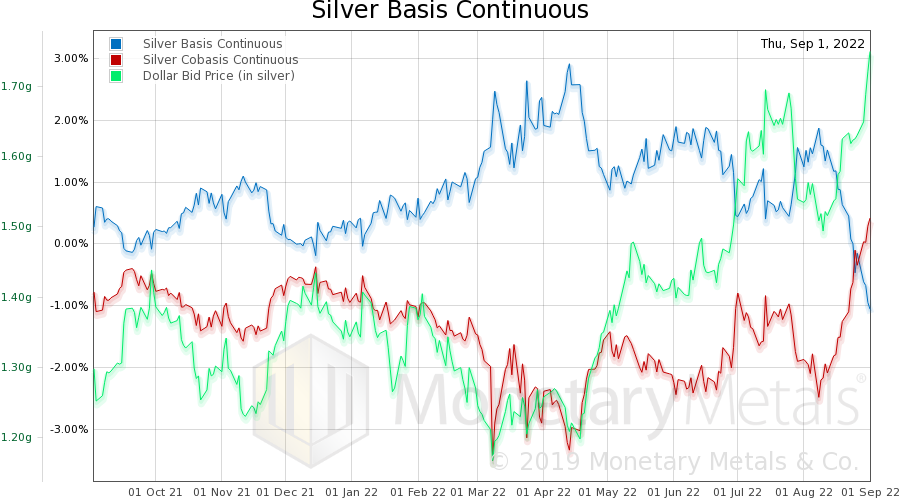
Silver, monthly – more NLBL magicWe see an almost identical perspective over in silver of course. A sea of unchallenged NLBLs and then earlier this year a pop above one which it managed to sustain. There may be another shake out on the horizon but to me this clearly looks like a floor pattern. But ask yourself this – which monthly indicator would have gotten you onto the long side ahead of that NLBL? |
 It’s that dreaded day after Independence Day. The weather is gorgeous and I don’t really feel like trading either. The thought of just phoning it in had occurred to me, but as the new month just rolled over I thought I may as well take another peek at our monthly charts. - Click to enlarge |
Charts by Ninja Trader/ Evil Speculator
Chart and image captions by PT
This article was penned by the Mole and appeared originally at the Evil Speculator
Full story here Are you the author?
Tags: newslettersent,silver,The Stock Market