Triangle Thrust and Reversal
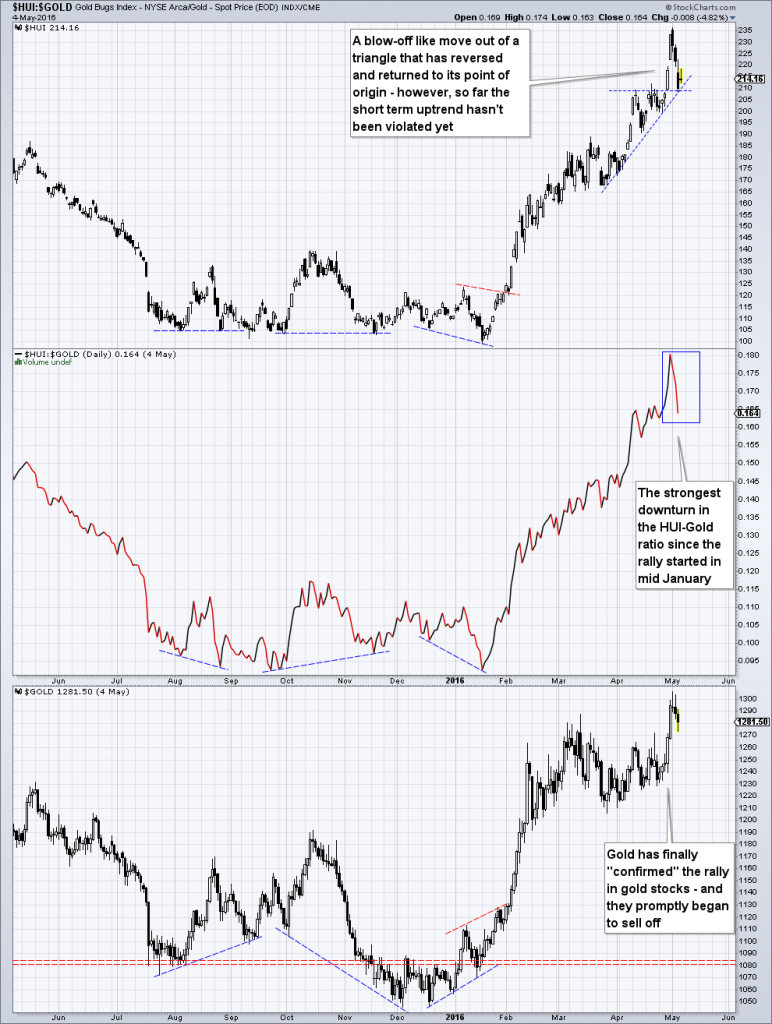
In mid April, we discussed weekly resistance levels in the HUI Index. Given the recent almost blow-off like move in the index and its subsequent reversal, we decided to provide a brief update on the situation. First, here is a daily chart comparing the HUI, the HUI-gold ratio and gold:
| After building another triangle, the HUI has delivered an upside thrust in the direction of the preceding trend. This is quite normal, and so is the subsequent move back to its origin. Three things are noteworthy here: 1. in terms of the HUI-gold ratio, the recent decline is already the strongest of the entire rally since the January low; 2. the downturn hasn’t violated the short term uptrend line just yet; 3. the peak was put in exactly on the day on which gold confirmed the rally in the HUI by breaking out to a new high for the move as well |
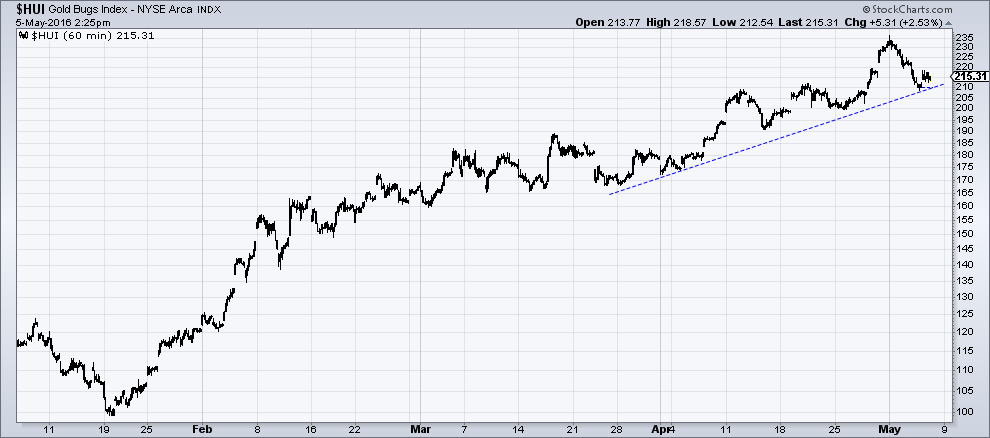
HUI – an hourly chart of the rally since mid January. So far, the short term uptrend remains intactLooking at an hourly chart of the HUI, one can also clearly see that the short term uptrend line remains intact so far – at the time of writing anyway (this may already have changed by the time you read this). Moreover, the thrust higher and the subsequent pullback actually look quite normal in the context of recent activity. Similar patterns have occurred throughout the rally to date. |
Of course the index is very close to said support trend line, and given the upcoming payrolls report and the by now very stretched speculative net long position in gold futures (approx. 250 K contracts net), it is quite possible that this support will fall. However, as long as it remains intact, a resumption of the blow-off move definitely remains possible as well – it it were to happen, it would likely target the 260 level on the HUI, the next major lateral resistance level.
A Look at a Past Rally and Correction
Given that the index has become very overbought (along with the entire commodities complex) one has to take the correction potential seriously, even if a long term bull market is indeed underway. However, we want to stress that one shouldn’t get carried away by this potential either – not only does an imminent resumption of the rally remain perfectly possible on technical grounds, but a bigger correction certainly wouldn’t alter the longer term prospects.
One has to be cautious, but at the same time one must avoid getting “bucked off” by short term market volatility and potentially lose positions one later wishes one had kept. So what, if anything, one wants to do about this depends very much on one’s trading/ investment horizon, personal risk tolerance, and so forth. We only want to discuss the various possibilities and associated probabilities here.
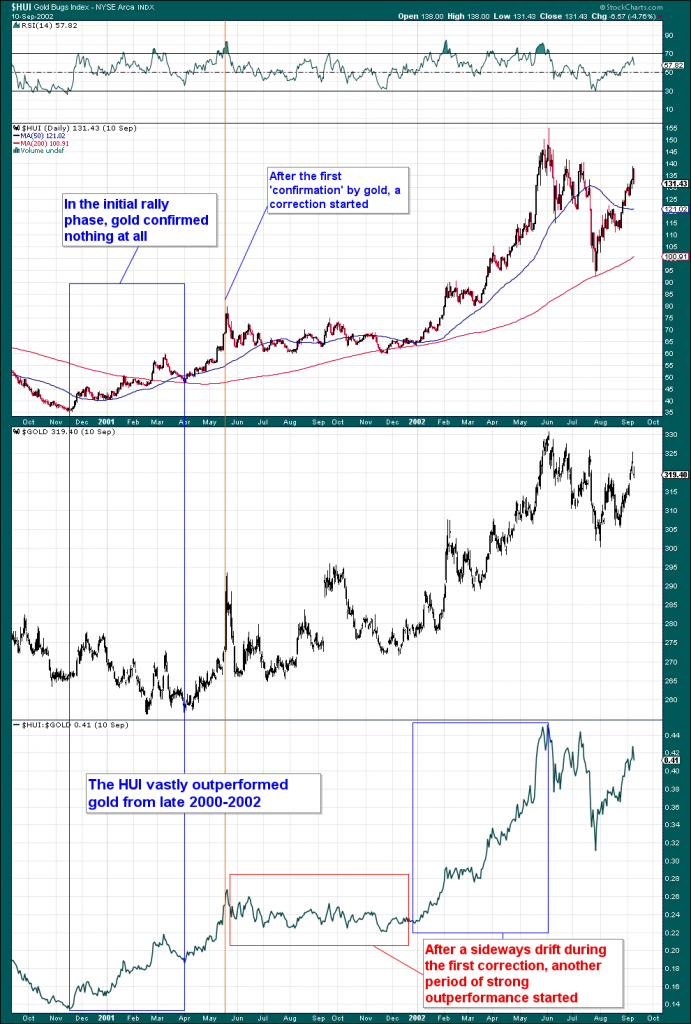
A strong rally in gold stocks started in November 2000 – the first significant correction began only after the gold price confirmed it by rising to a new high for the move (see the red vertical line). The extended sideways correction that followed looks like a fairly calm period on this long term chart, but it was actually quite volatile and involved large percentage moves. It also provided a great opportunity to buy for an even bigger rally leg that started in late 2001 – click to enlarge.One reason why this is a good moment to provide an update is the fact that something eerily similar has happened in the past. Below we reproduce a chart we have shown on previous occasions – it depicts the HUI, gold and the HUI-gold ratio from 2000 – 2002. The point that is of particular interest here is the time when gold finally “confirmed” the strong rally in the HUI in May of 2001. |
Conclusion
Given that gold has just technically “confirmed” the rally in both the HUI and silver, one has to be alive to the possibility that the (by now long-awaited) correction in the gold sector is finally beginning. If that happens, we will provide an update discussing support levels and potential entry points derived from them.
On the other hand, should the rally resume in the short term, it seems highly likely that strong resistance at the 260 level will stop it and that a correction will start from there. The more overbought the sector becomes prior to a correction, the deeper and more long-lasting it will probably turn out to be.
We would nevertheless try to avoid getting shaken out of long term “core positions”, unless fundamental and technical conditions begin to suggest that it is necessary to reconsider the long term bullish stance.
Charts by: StockCharts
Full story here Are you the author? Previous post See more for Next post
Tags: newslettersent,Precious Metals,The Stock Market


