Eugen von Böhm Bawerk
My articles My siteAbout meMy videosMy books
Follow on:TwitterFacebookGoogle +
One of the most reliable indicators of an imminent recession through recent history has been the yield curve. Whenever longer dated rates falls below shorter dated ones, a recession is not far off. Some would even say that yield curve inversion, or backwardation, help cause the economic contraction.
To understand how this can be we first need to understand what GDP really is. Contrary to popular belief, GDP only has an indirect relation to material prosperity. Broken down to its core component, GDP is simply a measure of money spent on goods and services during a specified period, usually a year or a quarter.
However, since money itself is a very fleeting concept we need to dig deeper to fully understand the relation between the slope of the yield curve and GDP. The core of money is its function as the generally accepted medium of exchange, but today that is much more than the cash in your wallet. For example, the base money, provided by the central bank, consist of currency in circulation and banks reserves held at the central bank.
From these central bank reserves the commercial banking system can leverage up, through fractional reserve lending practice, several times over. It is important to note that broader money supply measures, such as M2, is merely a reflection of banks leverage on top of base money. As a bank makes a loan to a borrower the bank creates fund which can be used as means of payments to whatever the borrower wants to spend the newly acquired money on. Obviously, these money claims will in turn create new deposits, which can be used to create new loanable funds and so on ad infinitum.
| In addition, money is not consumed during the transaction as goods and services do, it merely changes hands and can thus be used several times within the specified period of time used to measure GDP. Velocity is thus an expression of household and businesses spending patterns.
If aggregate demand is total money spent on goods and services, aggregate demand equals GDP. However, if aggregate demand (AD) is an expression of money flowing throughout the economic system we can write; |
|
| This relationship is essentially the Quantity Theory of Money developed by the School of Salamanca and later re-discovered by Ludwig von Mises and Irving Fisher in the 20th century.
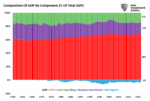
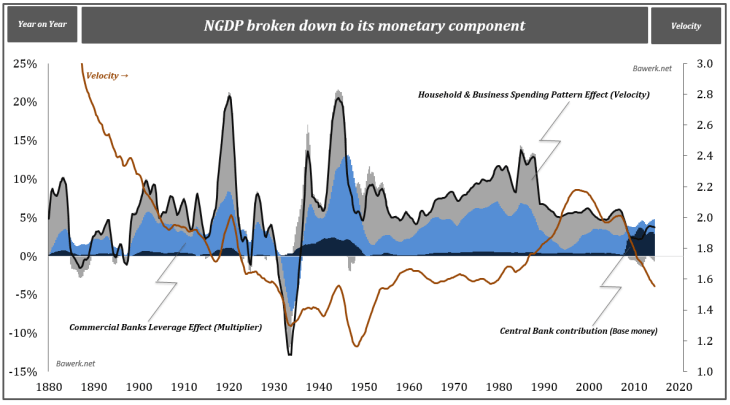
From this equation we can express GDP growth derived purely from the underlying monetary components. The first chart show how central- and commercial banks together with household and businesses “create” GDP growth. |
 One of the most reliable indicators of an imminent recession through recent history has been the yield curve. Whenever longer dated rates falls below shorter dated ones, a recession is not far off. Some would even say that yield curve inversion, or backwardation, help cause the economic contraction. - Click to enlarge |
| It is interesting to note from the chart above how both the Great Depression and the Great Financial Crisis were both driven by commercial banking deleveraging and increased demand for cash balances by households and businesses. The major difference between the two periods is obviously the massive intervention by the Federal Reserve in the latter period to maintain nominal GDP growth. Keep in mind that GDP properly defined have nothing to do with real prosperity. No, GDP is nothing more than a very broad measure of inflation, defined as an expansion of the money supply. The only link between GDP and real prosperity comes through prices paid for goods and services. GDP growth is inflation, but to the extent prices does not increase correspondingly, there must have been an increase in production of goods and services. In that sense, GDP correlates with prosperity, but there are no causal link between the two concepts. When Keynesians say they are right in the sense that spending by the government can increase inflation through a forced increase in velocity. Deficit spending, funded by the central bank (QE) will be even ‘better’ as its increases both the supply of money and its velocity. | |
| But we digress, the question we try to address is basically the link between GDP/inflation and the yield curve? Going back to the identity above and the chart we see that the two most important components in the GDP calculation is commercial bank leverage (the money multiplier) and spending patterns as expressed through household and business purchases (velocity) and this the former is directly affected by the yield curve while the latter indirectly.
Noting that commercial banks borrow short and lend long, a process that create additional deposits which can be used for further lending, it is obvious that short rates must be lower than longer dated rates for the bank to make a profit. As the yield curve flattens, banks net interest margin falls and they start to curtail lending which lowers inflation and by extension price pressure, which help bring the yield curve even lower until it eventually inverts. At this point banks’ balance sheets shrinks as loans get repaid while new ones trickle to a halt. The recession (measured by GDP) ensues shortly. We will be the first to admit that yield curve inversion is not the only factor causing recessions, but through the credit channel it can be an important contributor. Depending on the importance of the credit channel, the Federal Reserve, by pegging the short term rate at zero, have essentially removed one recessionary market mechanism that used to efficiently clear excesses within the financial system. While stability obsessed Keynesians on a quest to the permanent boom regard this as a positive development, the rest of us obviously understand that false stability breeds instability. The Soviet Union had only one recession after all; the one in 1991 which collapsed an empire. The misallocations that had perverted that particular system never got corrected, as a market based system would do on a regular basis. Instead, the distributional perversion lingered on for decades until the whole edifice imploded on itself. In other words, the longer a system disallow corrections the more fragile it becomes. When central banks stop short corrections through their market manipulative shenanigans instability grows exponentially as one misallocations leads to the next. That said, we still believe there will be a recession in the US soon, yield curve inversion or not, (presented here and here) as inventory excesses need to be liquidated at some point. However, if the financial system see no reason to scale back, funding for working capital / inventories may be present for longer than usual. The shale oil boom is a perfect case in point. |
 One of the most reliable indicators of an imminent recession through recent history has been the yield curve. Whenever longer dated rates falls below shorter dated ones, a recession is not far off. Some would even say that yield curve inversion, or backwardation, help cause the economic contraction. - Click to enlarge |
| As can be seen from the chart above, the yield curve inversion have a perfect track record when it comes to predicting recessions, mainly because it, to some extent, causes the recession through a reduction in the money multiplier and inflation (which defines GDP through nominal aggregate demand). However, when the short-end is pegged to zero it is impossible for longer dated rates to fall below shorter dated, and banks net interest margin will remain positive.
To substantiate our inventory liquidation theory we look at where the yield curve would stand if the FOMC had followed a so-called Taylor rule, which defines the Fed Fund rate as presented in the Humphrey-Hawkins Full Employment Act. We use the following for our Taylor Rule calculation |
|
| The 2 per cent PCE goal is “set in stone” as any deviation from that magical number would obviously lead to unprecedented catastrophe, but the 4.5 per cent unemployment “target” is generously applied as the non-recession average unemployment rate has been 5.8 per cent since 1948.
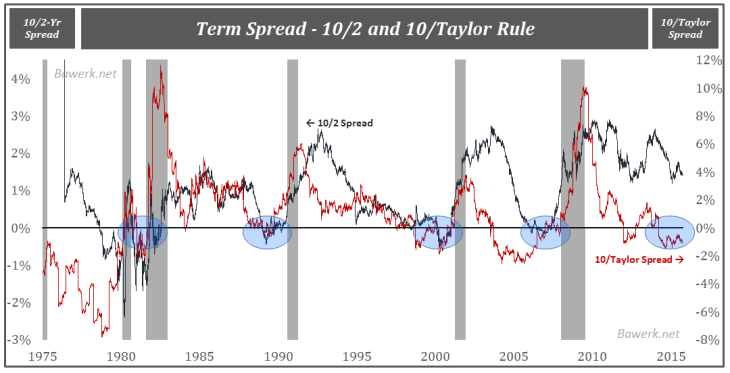
Calculating the term spread from the Taylor rule give us an idea of where the yield curve would be if the Fed had actually followed its own rule. A prudent FOMC, following the congressional mandate they always use as an excuse to not look at asset bubbles, would have pushed the yield curve deep into negative territory by now. In the chart below we plot the difference between the actual Fed Fund rate and the Taylor rule. When the area between the two are red it means actual target rates are below the Taylor rule. While we are no big fan of the arbitrarily set Taylor rule, it has proven to provide a warning sign in times when the FOMC ignore it for longer periods. In the late 1970s and 2000s the result was obvious for all to see. Financial crisis, misallocations and subsequent capital reallocation (recession) were necessary. Today the FOMC is doing the exact same mistake again. The red area in the chart are growing ever larger as bond, stock, EM and who knows what are priced to perfection. |
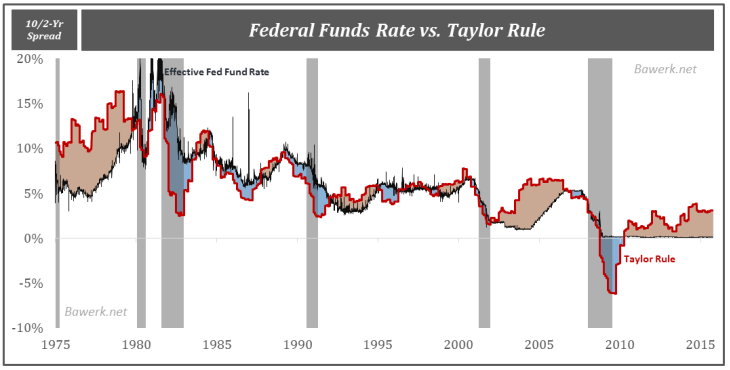 One of the most reliable indicators of an imminent recession through recent history has been the yield curve. Whenever longer dated rates falls below shorter dated ones, a recession is not far off. Some would even say that yield curve inversion, or backwardation, help cause the economic contraction. - Click to enlarge |
It is clear to us that the FOMC in its quest to maintain stability is breeding instability and that previous attempts at the same failed miserably with dire consequences for society. We are sure it is only a matter for time before it happens again.
Tags: Economics,Federal Funds Rate,Regulation