Swiss industrial production is rather insensitive to price changes and to the recent slowing of global demand thanks to the concentration on pharmaceuticals and luxury products.
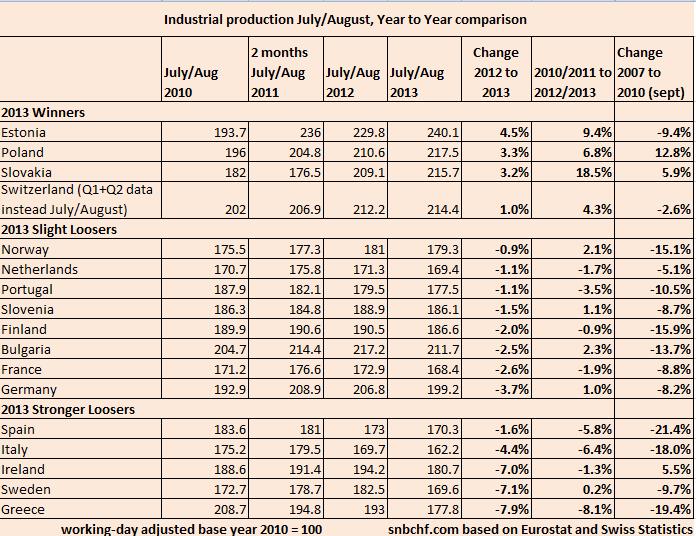
Based on Eurostat’s industrial production for July and August , we compared the values from 2010 to 2013 for these two summer months. This aggregated two-months comparison is commonly used because data for one single month is often subject to fluctuations. We added the data from Swiss Statistics. Since only quarterly data is available we added the first and the second quarter of the years 2010 to 2013, available here.
The results are as follows:
The base year is 2010 with an annual average value of 100; hence, the two-month comparison should give 200. Due to summer holidays, many countries produce less in July/August, therefore the values are often far under 200. However, this phenomenon occurs every year. For Switzerland we used the quarterly data for the first and second quarter, base year 2010. Finally we added the change of industrial production between September 2007 and September 2010.
We corrected a calculation mistake for Swiss production. 1
The data gives the following insights:
Switzerland:
- Swiss industrial production is rather insensitive to price changes and to the slowing of global demand. The reason is the nature of goods, for example, luxury goods and pharmaceuticals.
- Structural flexibility helped to reduce labor and production in the less competitive machinery sector, but created new jobs in pharmaceutical, watches or luxury goods.
- Switzerland uses the Ricardian comparative advantage and concentrates on its strengths: namely production for wealthy customers that – thanks to central banks’ cheap money – become richer and richer even if the global economy slows.
- Demand from the United States (keyword “Obamacare”) sustained Swiss pharmaceutical and chemical output despite the European crisis and the slowing in emerging markets.
- Between 2010 and 2012, the Swiss machinery sector struggled with the “strong franc” and could not expand. The EUR/CHF floor, however, has helped to increase its competitiveness.
Winners:
- Countries with cheap labor like Estonia, Poland and Slovakia continue to outpace the rest of Europe.
Slight Losers:
- Germany has lost customers in emerging markets, industrial production has slowed considerably since 2012. German production in 2012/2013 is still higher than in 2010/2011.
- France has weaker production in 2013 than in 2012, but also weaker than in the previous years.
- The August data showed a rebound for Germany, especially in capital goods. Capital goods are most important, they indicate that firms are ready to invest again.
Stronger Losers:
- Bad data in the European periphery continued: production in Greece and Ireland fell again by 7-8% compared to 2012.
- Italian industrial production is weakening more than Spanish, while production in Portugal and Slovenia has stabilized.
2013 Losers:
- Sweden was considered as a replacement for Switzerland after the EUR/CHF peg introduction. However traders and quantitative algorithms ignore the nature of Swedish production and associate Sweden more with the United States and technology, therefore the SEK is still strong, while NOK has depreciated.
However, Swedish exports rather focus on European customers. A 7% reduction in Swedish production from 2012 to 2013 should finally be reflected in the EUR/SEK and even more in the NOK/SEK exchange rates.
As the following graph shows, the financial crisis did not affect Switzerland a lot. Thanks to continuous internal demand and demand from emerging markets, Swiss production could recover quickly.
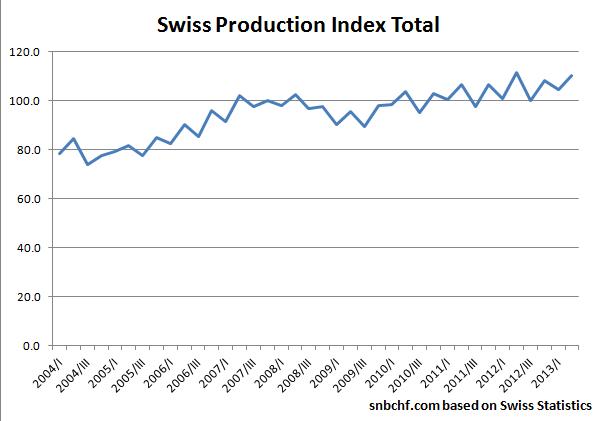
data source Swiss Statistics
- we coincidentally compared Q3/2012 instead Q2/2012 with the 2013 data [↩]
Tags: Greece,industrial production,Ireland,Italy,Italy Industrial Production,Norwegian Krone,Obamacare,SEK,Spain,Switzerland


