


George Dorgan
My articles My siteAbout meMy videosMy books
Follow on:LinkedINTwitterSeeking Alpha
CFA SocietyEconomicBlogs
The weighted average of country’s currency relative to index or basket of other major currencies adjusted for inflation. We explain the Real Effective Exchange Rate for the Swiss Franc, the Yen and the Chinese Renmimbi.
See more recent details for the Swiss Franc inside the post “Is CHF overvalued?”
The Real Effective Exchange Rate – REER
The weighted average of a country’s currency relative to an index or basket of other major currencies adjusted for the effects of inflation. The weights are determined by comparing the relative trade balances, in terms of one country’s currency, with each other country within the index.
Source Investopedia, Read more
The main three adjustments are hence:
- Valuation against multiple currencies contained in the index/basket
- Adjustment for inflation effects, usually by producer price index (similar as in the purchasing power parity).
- The choice of a base year when one assumes that the valuation was correct.
The choice of the basket
The most common basket used is a trade-weighted basket, typically the export-weighted basket. The important point is the competition in the global market: Hence the export decides. For Switzerland this export-weighted basket consists of the following trading partners:

Swiss Exports By Country - Click to enlarge
The euro members, Germany, Italy, France and Spain, Austria, the Netherlands and some of the “Other Europe” add up to a total of a 45% Euro share. The following is the export-weighted exchange rate compared with the GDP-weighted exchange rate of the Swiss franc according to UBS, compared with the long-term trend. The long-term trend mirrors the stronger Swiss competitiveness thanks lower taxes, better infrastructure, human capital, details here.
Real Effective Exchange Rate UBS GDP Trade

Real exchange rate: export-weighted vs. GDP-weighted - Click to enlarge
Pictet determines a 0.4% long-run trend increase per year for the CHF.

The weighted average of country's currency relative to index or basket of other major currencies adjusted for inflation. We explain the Real Effective Exchange Rate for the Franc, the Yen and Renmimbi - Click to enlarge
The RIETI approach
Recently the Japanese RIETI introduced a different approach. It shows the export weights by industry, here in the example of the Japanese yen. Since end 2011, however, the REER of the yen has weakened considerably.

Export-weighted Exchange Rate by Industry JPY - Click to enlarge
Different views on the real effective exchange rate
As opposed to UBS’s longterm chart, the SNB tries to suggest that the export-weighted exchange rate of the franc must remain constant over time.

SNB real effective exchange rate CHF October 2012 - Click to enlarge
The newest numbers and also an archive can be found inside the SNB’s bi-weekly IMF data. Based on the 1999 base year (=100), the October 2012 value is 111.5, lower than the latest figures in the UBS and the SNB graph of the month of August.
Real Export-weighted CHF October 2012 - Click to enlarge
The December 2012 value was 111.6, the one of November 2013 111.4, in November 2014 it was 110.5.
Effectively the Swiss franc appreciation from around 96 to 114 seems to be similar to the one of the Swedish Krona and the Norwegian Krone until 2012, but as opposed to the SNB, the Swedish Riksbank is happy with the SEK exchange rate.
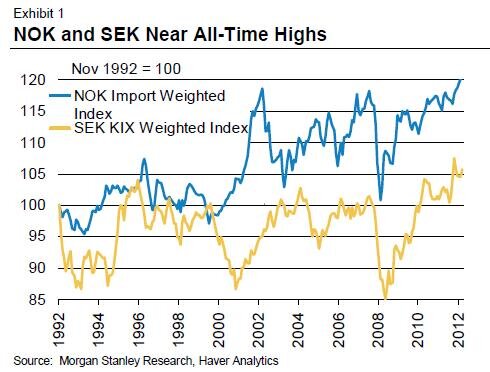
SEK NOK Real Effective Exchange Rate (source JP Morgan) - Click to enlarge
Which currency has revalued the most since 2007?
The following interesting graph from the main Swiss economic research institute KOF shows that by September 2012 the real effective exchange rate of the Swiss franc had risen by 19% against the 2007 levels, but the one of the Chinese Yuan (CNY) by 25% and the one of the Japanese Yen by 23%. On the other hand the UK, the US and the euro zone have seen a depreciation of their currencies. Inflation is represented by the word “real” inside the “real effective exchange rate”.
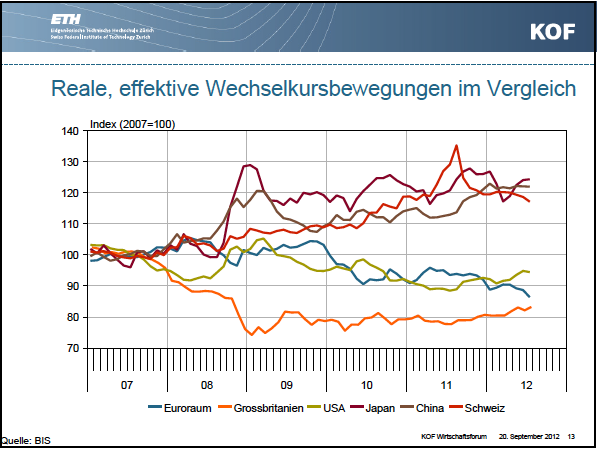
KOF overvalued currencies - Click to enlarge
Hence CHF, CNY and JPY have revalued against the dollar by around 30% by 2012 and against sterling more than 45%. The reasons:
- A very strong rise of CHF and JPY and low inflation (CHF) or deflation (JPY).
- Rising inflation in China and despite of that, a big yuan appreciation .
Paul Krugman shows in “An issue that has passed” the same results:

China Current Account and Real Exchange Rate - Click to enlarge
During the food inflation in 2011, the Chinese government let the Renmembi revalue maybe too quickly from 6.8 to 6.4 per USD.
Very Long-Term: beyond seven to ten years
Having a weak or a strong currency depends on a country production factors, on its competitive advantage and on savings rates.
We argue that a country that provides cheap labor should have weak currency (e.g. China or India), the ones with a high savings rate, a strong capital basis and strong trade balances rather a stronger currency (e.g. Germany, Japan, Switzerland, but potentially also China). Since the US or the UK have weak trade balances and a low savings rate, their currencies, must depreciate in the very long-term.
Similarly a currency of a country with high savings, must appreciate with the time (more details about saving rates here).

The weighted average of country's currency relative to index or basket of other major currencies adjusted for inflation. We explain the Real Effective Exchange Rate for the Franc, the Yen and Renmimbi - Click to enlarge
Certainly these countries do not like an exaggerated rapid increase of the FX rate, therefore the Swiss introduced a (for us, temporary) peg.
A strong capital basis helps to expand foreign investments and to achieve a strong foreign investment position and gains on these positions. More details about this theory see here.
Joseph or Credit Cycles: FX Rates move in seven year phases
For a certain period, often up to seven or more years, so-called “Joseph cycles” or credit cycles, or as Austrian economists call it “boom and bust cycles”, monetary policy or rational expectations of investors and ordinary people can create bubbles, like the real estate bubble in the United States, Spain, UK and Ireland between 2002 and 2007. The effect on FX rates were that the euro and pound got very expensive and were able to overlay the very-long term tendencies above, e.g. that the British pound must depreciate over the very long-term.
Certain countries did not participate in these irrational behaviors, especially German, Switzerland and Japan. Mostly not because these countries were smart enough, but because they lived another real estate bubble in the 1990s. During this period the franc was undervalued against the long-term trend, the yen even strongly undervalued.
The following graph from Citi’s Englander shows that the current commodity cycle favors commodity currencies like the Aussie and depressed the yen, the pound and the dollar, because these countries were still in a deleveraging phase.
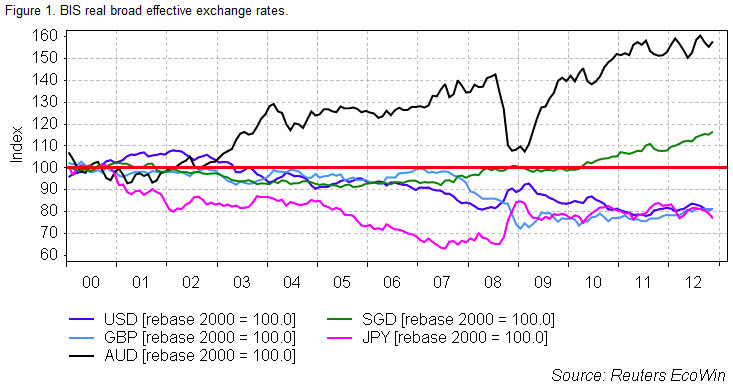
More about Joseph cycles here.
See also:
The best data source for real effective exchange is the Bank of International Settlements (BIS)
See more recent details for the Swiss Franc inside the post “Is CHF overvalued?”
Our page on purchasing power parity gives more insights in particular on two aspects:
1) The base year from which a REER calculation starts
2) A multiplication factor that represents inflation and their differences among countries. This inflation factor could be developments in consumer prices, producer prices, unit labor costs or export prices.


1 comment
1 ping
nancyjohn2010
2015-01-16 at 08:15 (UTC 2) Link to this comment
Forex trading is a zero sum game. For every long there is also a short
<a href=”http://forex-matter.blogspot.com/2011/06/forex-dealing-with-your-losses.html”>Forex trading losses</a>
Guest Commentary: Outlook on SNB Monetary Policy Assessment Statement | Forex Trading Hot
2012-12-13 at 23:24 (UTC 2) Link to this comment
[…] that thanks to deflation and cheaper production prices, in purchasing power terms and for the real effective exchange rate, the franc is not overvalued any […]