


Read More »


 On Swiss National Bank
  Main SNB Background Info


 Yen Jumps on Rate Hike Speculation
27 Nov 2024
 The Dollar’s Surge Continues
14 Nov 2024
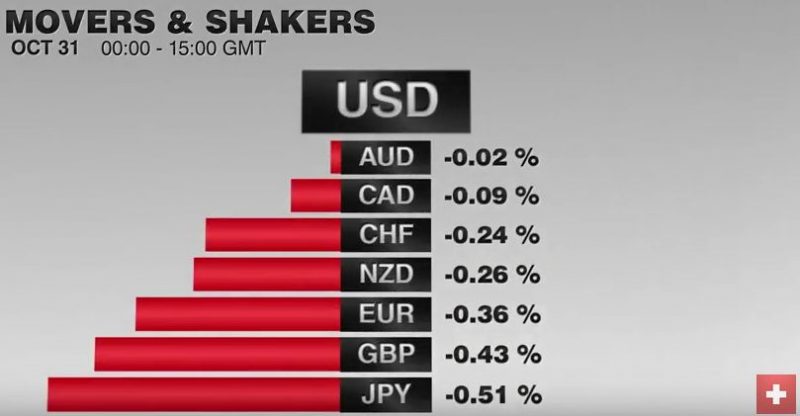
 US Job Report may Offer Little Relief ahead of Next Week’s US Election and Meetings by Half of the G10 Central Banks
1 Nov 2024
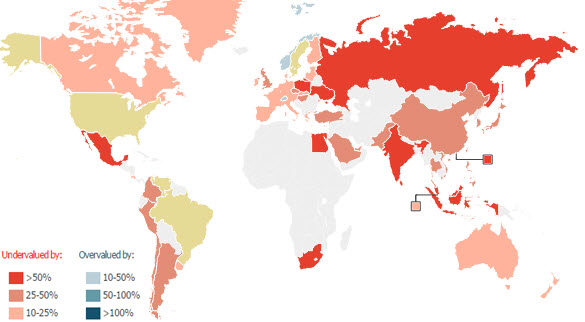
 Ueda Lifts Yen, Stocks Slump, Gilts Under Pressure Post-Budget
31 Oct 2024
 Eurozone Growth Surprises, Lifts Euro, while UK Budget is Awaited
30 Oct 2024
 Continued Backing Up of US Rates Extend the Greenback’s Gains
23 Oct 2024
 Today’s Employment Report is Important, but Fed Sees Another Before the Next FOMC Meeting
4 Oct 2024
 Bailey Weighs on Sterling
3 Oct 2024
 Powell’s Lack of Urgency Helps the Dollar Correct Higher
1 Oct 2024
 European Currencies Start Week Softer, while the Dollar Bloc is Firm
23 Sep 2024
 Stocks Higher, Dollar Lower: Post-Fed
19 Sep 2024
 Atlanta Fed GDP Tracker Says US Economy is Expanding at 3% Clip for 3rd Quarter in Past 4, and the Fed is Going to Do What?
18 Sep 2024
 Corrective Forces Weigh on G10 Currencies, with the Euro Threatening its Largest Loss in Two Months
28 Aug 2024
 USD is Trading Mostly Firmer, but Yen and Swiss Franc Show Resilience
26 Aug 2024
 Data Thursday but Markets Unimpressed
15 Aug 2024
 Is the US CPI Anti-Climactic?
14 Aug 2024
 Are Risk Appetites Recovering?
13 Aug 2024
 Subdued Market Compared to a Week Ago: Is the Dramatic Position Unwinding Over?
12 Aug 2024
 Equity Meltdown Continues as Attention turns to the US Employment Report
2 Aug 2024
 Euro Trades Quietly Ahead of ECB Meeting
18 Jul 2024
