


Who is Incrementum?Incrementum AG is an owner-managed and fully licensed asset manager & wealth manager based in the Principality of Liechtenstein. Our business focus is the management of investment funds that we believe to be unique. |
 |
Our ConvictionDue to structural over-indebtedness and the resulting addiction to low/negative real interest rates, we believe that the traditional approach to financial markets and asset management is no longer beneficial for investors.
Therefore, at Incrementum we evaluate all our investments not only from the perspective of the global economy but also in the context of the current state of the global monetary regime. This analysis produces what we consider a truly holistic view of the state of financial markets.
|
Financial markets have become highly dependent on central bank policies. Grasping the consequences of the interplay between monetary inflation and deflation is crucial for prudent investors.
We believe that the Austrian School of Economics provides us with an appropriate intellectual foundation for our investment assessment and decisions, especially in this demanding financial and economic environment.
Ronald-Peter Stöferle, Mark J. Valek
|
Partners of the In GOLD we TRUST 2016 Report |
 Partners of the In GOLD we TRUST 2016 Report - Click to enlarge |
Gold Price Target for June 2018: USD 2,300► In 2008 (when gold traded at USD 800) we first called for a long-term price target of USD 2,300 ► The gold price reached a (nominal) all-time high of USD 1,920 in September 2011 ► Contrary to our expectations, then a correction started which evolved into a full-blown bear market in 2013 ► While most other gold analysts became bearish on gold, we continued to stand by our thesis that gold is still in a secular bull market ► In June 2015 we set our price target of USD 2,300 for June 2018 |
Gold in USD since 1999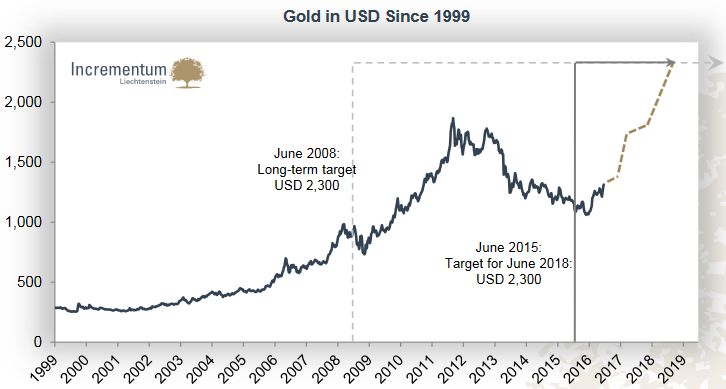 Slide 4 - Click to enlarge |
Extensive Indebtedness Has Made the System Crave for Growth (and/or Price Inflation)► Structural over-indebtedness all around the globe: Debt levels have increased by about 40% since the financial crisis, a trend that has spilled into emerging markets as well (especially China) ► True reform and spending cuts appear illusory and massive tax increases as counterproductive–to service this debt more growth (and/or price inflation) has to be generated at any cost |
Private and Public Debt as a Ratio of GDP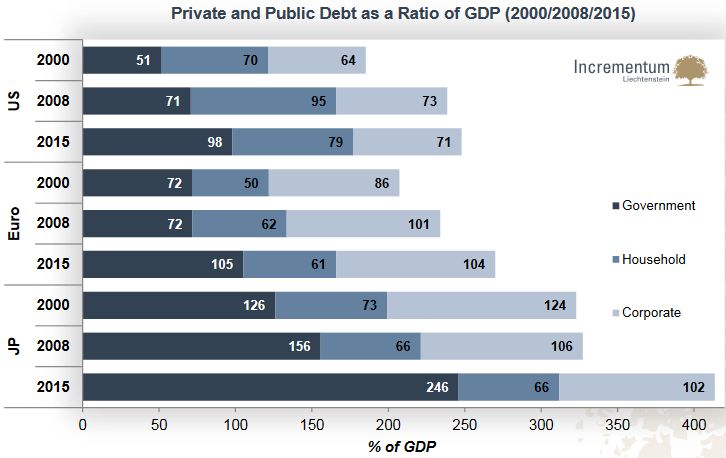 Slide 5 - Click to enlarge |
To Stimulate Growth Central Banks Have Gone All-In► With monetary experiments, central banks have been engaging into an all-or-nothing gamble, hoping it will eventually bring about the long promised self-supporting and sustainable recovery ► The central banks‘ leverage ratios and the sizes of the balance sheets relative to GDP have enormously risen in the aftermath of the 2008 financial crisis ► The Bank of Japan (BoJ) has taken this insanity several steps further than their peers have managed; the ECB has been comparably conservative, but is currently doing its best to catch up |
Expansion of Central Bank Balance Sheets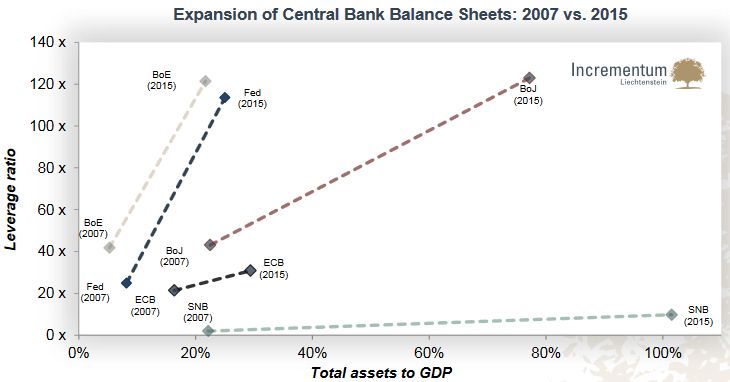 Slide 6 - Click to enlarge |
However, Can Central Banks Heal the Economy?3 Worldviews in the Post-Lehman Economy1. Believers in the system► The Keynesian economic policy in the post-Lehman world is in principle correct and necessary
► The economy is in a recovery process, financial markets are gradually sounding the “all clear”
► New regulations have lowered systematic risk
► Low/zero gold allocation in the portfolios
The current mainstream economic worldview
2. The Sceptics► Doubts about the sustainability of the extreme economic policy measures that have been taken since 2008
► Pragmatic gold holdings: much accumulation after the crisis, reduction of the position in recent years
► Skeptics could play an important role as marginal buyers in driving the future gold trend Gradually growing group
3. The Critics► Conviction that the monetary architecture is systematically flawed Theoretical foundation is provided i.e. by the Austrian School
► The current economic recovery is neither sustainable nor self-supporting
► Portfolios include system hedge and inflation hedge modules, e.g. gold
|
 |
How to Judge the Current Economic Situation?The believers in the system say:► No large setbacks in economic growth yet in the US since the 2008 financial crisis ► Recovery has been shallow, hence it can last much longer than normal
The critics say:► The current upswing is borne by a giant cushion of air in the form of zero interest rates, QE etc. ► These measures have caused asset prices to rally, which has benefited mainly the wealthy ► The population at large appears to be dissatisfied – populist parties are in vogue
|
US Economic Expansions After World War II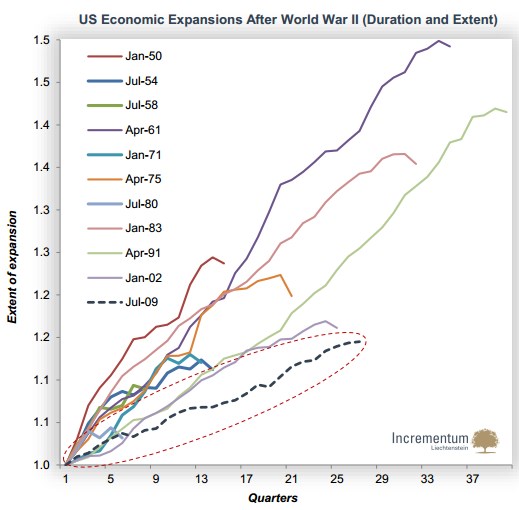 Slide 8 - Click to enlarge |
What If the critics are right and we reach another crisis/recession?► During the past decades monetary policy has always reacted with expansionary measures in times of recession or crisis
► Central bankers now find themselves in a lose-lose situation: – The long-term consequences of low/negative interest rates are disastrous (e.g. aggravation of the real estate and stock market bubbles, potential bankruptcies of pension funds and insurers) – Normalizing interest rates would risk a credit collapse and provoke a recession
|
Federal Funds Rate and Subsequent Crises(see more posts on Federal Funds Rate, )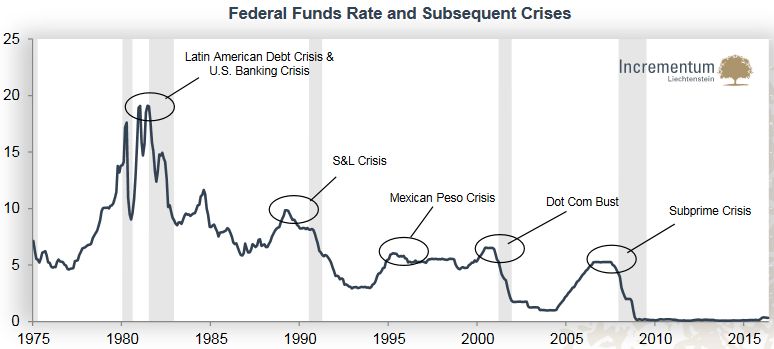 Slide 9 - Click to enlarge |
|
“If you have the power to print money, you’ll do it. Regardless of any ideologies or statements, that you should limit your counterfeit operations to three percent a year as the Friedmanites want to do. Basically you print it. You find reasons for it, you save banks, you save people, whatever, there are lot of reasons to print.”
Murray N. Rothbard
|
 Slide 10, Murray N. Rothbard - Click to enlarge |
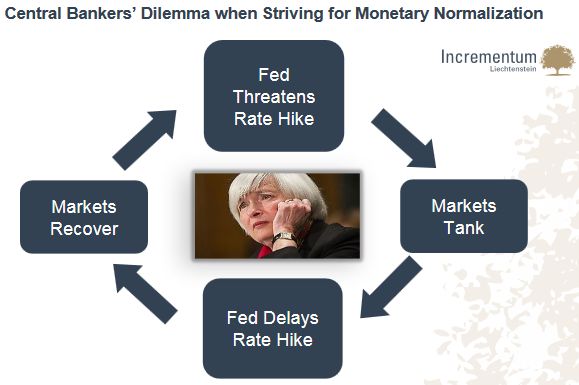
Central Economic Planning Has Proved Not to Work–Can Monetary Central Planning Be Any Different?► Low interest rates have only created the illusion of a healing economy – this would vanish into thin air as soon as interest rates return to a normal level
► Markets have become conditioned to low interest rates – if they are withdrawn, asset prices will plunge
► The current asset bubble is even greater
|
 Slide 11 - Click to enlarge |
5,000 Years of Data Confirm: Interest Rates Have Never Been Lower Than Today► Negative interest rates are one of the last hopes to which policymakers cling–they are a reality in meanwhile 5 currency areas (government bonds valued at more than USD 8 trillion have negative yields to maturity)
► When the centrally planned bubble in bonds finally bursts, it will be abundantly clear how valuable an insurance policy in the form of gold truly is
|
Interest Rates at the Lowest Level Since 5000 Years(see more posts on Interest rates, )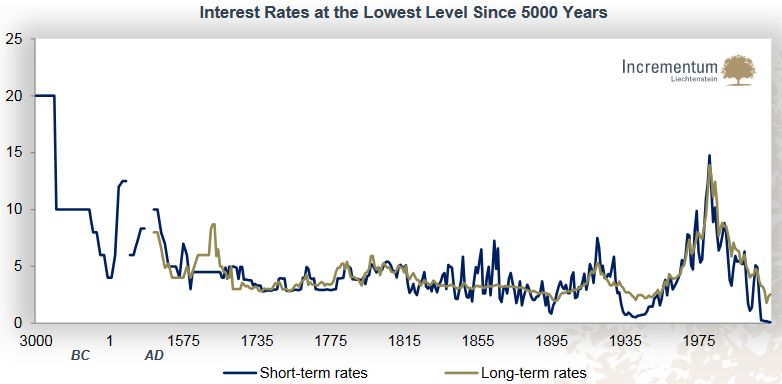 Slide 12 - Click to enlarge |
What if Money Supply Expansion Starts Stuttering?
► This chart impressively illustrates the instability of growth induced by credit expansion
► Since 1959, “total credit market debt” (which is the broadest debt aggregate in the US) has increased by 9,100%, its annualized growth rate amounts to 8.26%–in any decade, outstanding debt has at least doubled
► With a lot of unconventional and radical measures central banks are trying to prevent any credit contraction
► There is no reverse rear in the monetary system – if money supply and credit don‘t continually rise, the system‘s situation is critical
|
Total Credit Market Debt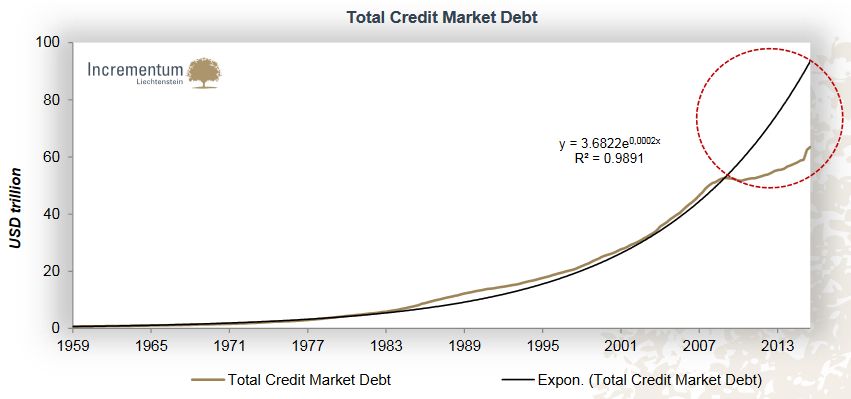 Slide 13 - Click to enlarge |
Gold: The Stable Counterpart to Diluting Currencies► Gold has to be physically mined, its global supply is exceedingly stable – holding it provides insurance against monetary interventionism and an endogenously unstable currency system
► At a price of USD 1,200 per ounce,* the ECB would have bought 4,698 tons of gold in the first quarter of 2016 (which is more than 6 times the value of globally mined gold)
► If the European and Japanese QE programs will be continued as planned, they would be equivalent (assuming prices don’t change) to the value of 39,625 tons of gold in 2016 (~22% of the total stock of gold of 183,000 tons ever mined)
|
Value of Gold Production vs. Volume of ECB and BoJ QE Purchases 2016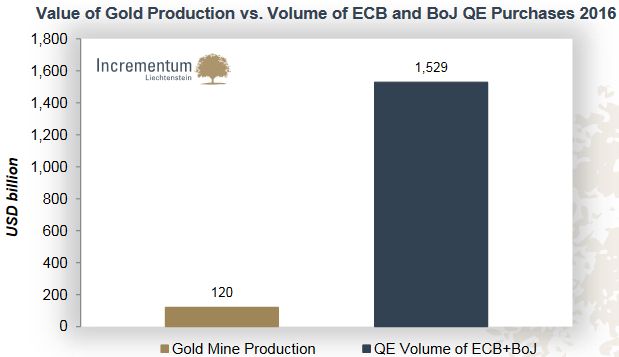 Slide 14 - Click to enlarge |
The Gold Metamorphosis: From an Anchor to a Life Buoy► The end of the gold exchange standard changed gold‘s characteristics as an investment asset: Gold suddenly transformed from a risk – free monetary anchor to an asset fluctuating in terms of the US dollar (and thus supposedly a risky one)
► Ever since, the gold price has been floating higher over the long term on the back of a continually swelling flood of money
|
Gold Price vs. US M2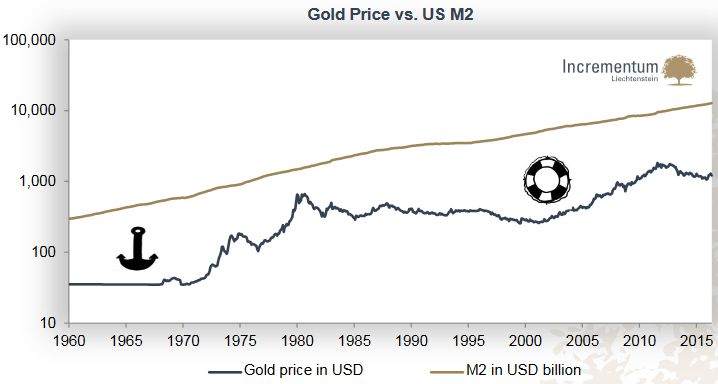 Slide 15 - Click to enlarge |
Whereas Prices Measured in Gold Remain More or Less on a Constant Level in the Long Run…► Gradual erosion of purchasing power since 1971, e.g.:
– Entrance fee for the Disney World Magic Kingdom in Florida: USD 3.50 (1971) vs. USD 110 (today)
– 1 liter (“Maß”) of beer at the Munich Oktoberfest: EUR 0.82 (1950) vs. EUR 10.25 (2015)
|
Ticket price for Disney World vs. Gold/Disney World Ratio, Gold/Oktoberfest Beer Ratio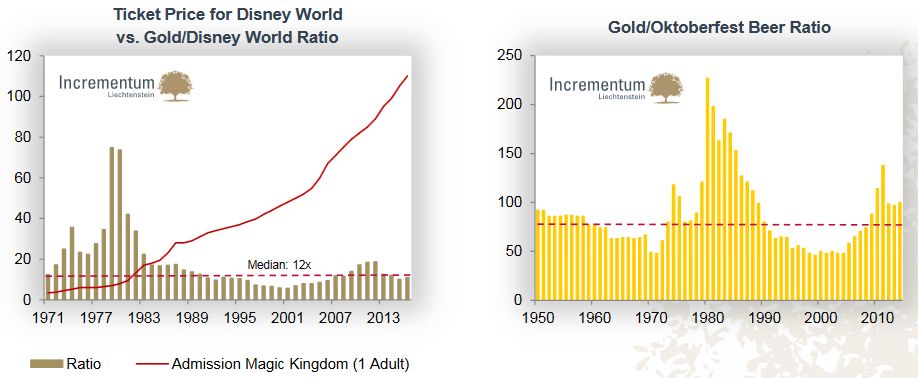 Slide 16 - Click to enlarge |
…Compared to Currencies, Relative Scarcity Makes Gold Rally in the Long Term► The price of gold in terms of the US dollar has increased by the factor of 34
► In the long term the gold price rises against every paper currency
|
Long-term Trend of the Gold Price in Various Currencies(see more posts on gold price, )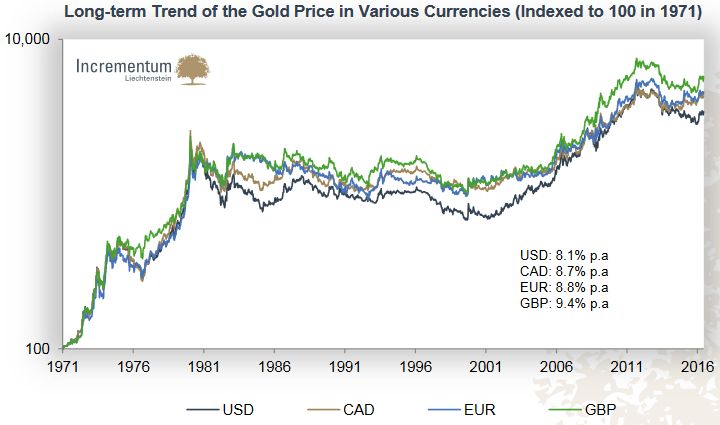 Slide 17 - Click to enlarge |
After 2011 the Gold Price Appears to Have Corrected Too Much► If money supply grows faster than the stock of bullion, the gold price should grow in the long run and vice versa – the bear market of the recent years was a divergence from this pattern
► At a price of USD 1,200 per ounce, the ECB would have bought 4,698 tons of gold in the first quarter of 2016 (which is more than 6 times the value of globally mined gold)
► As hardly any reduction of central banks‘ balance sheets is to be expected, the gold price should rise significantly to catch up
|
Combined Balance Sheet Totals in USD Billion(see more posts on gold price, )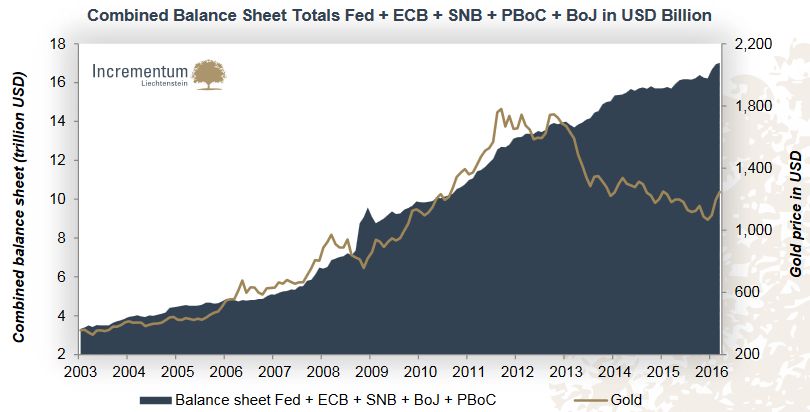 Slide 18 - Click to enlarge |
The Normalization Narrative Made Gold Appear Weaker Than it Actually Was► Instead of using USD or EUR terms, the world gold price expresses the gold price in terms of the trade – weighted exchange rate for the US dollar
► A growing divergence between the world gold price and the USD gold price can be observed, primarily due to prevailing confidence in the US economy‘s recovery and the associated rate hike fantasies, which boosted the US dollar
|
World Gold Price in an Uptrend Since 2014(see more posts on gold price, )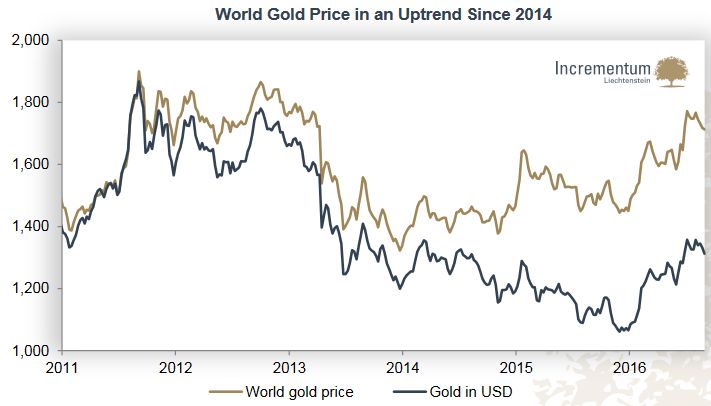 Slide 19 - Click to enlarge |
From a Broader Perspective Gold Appears to Be in a Secular Bull Market► Gold‘s average annual performance since 2001: 10.71%
► Since the beginning of 2016 gold is back in every currency!
|
Performance of Gold Since 2001 in Terms of Various Currencies Slide 20 - Click to enlarge |
The Emotional Roller – Coaster is Turning Upward► In the early stages of a bull market the enthusiasm of investors is usually very subdued, scepticism and disinterest tend to predominate; this changes gradually as the cycle progresses, until euphoria and buying panics predominate near the end of the trend
► Comparing this idealized sentiment cycle to the gold price chart (360 – day moving average), the point of maximum frustration appears to have been reached last year
|
Cycle of Market Emotions, Cycle of Investor Sentiment Applied to the Gold Price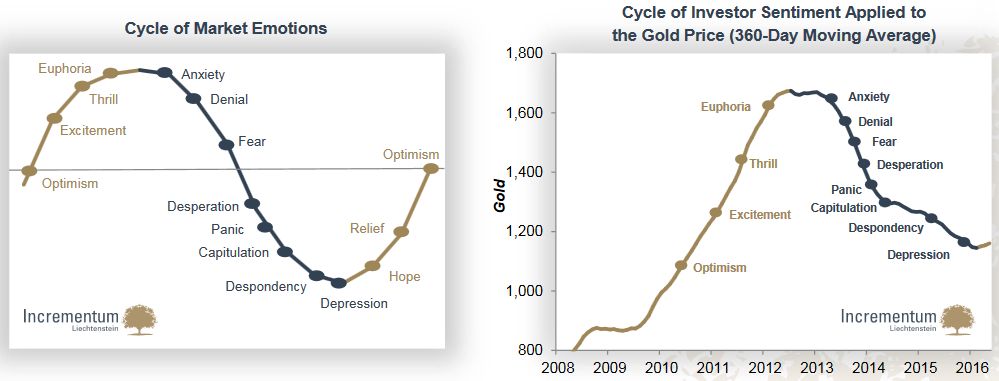 Slide 21 - Click to enlarge |
Crucial Question: Is Money Supply Expansion a Suitable Means for Targeting Consumer Price Inflation?Problem 1:Money supply expansion cannot be exactly regulated
► Fractional – reserve banking: Central banks issue base money, but the bulk of money supply is created by commercial banks via credit creation
► Total money supply is not easy to determine – different central banks apply different measures
► Austrian Money Supply* (AMS) is an “Austrian” alternative to the money supply calculations by central banks
Problem 2:Money supply inflation is not directly proportional to CPI rates – why not?
► Changes in preferences regarding either hoarding or spending money
► Methodological problems associated with measuring price inflation, e.g.:
– Composition of a basked of goods
– Quality adjustments of products
– Consumer price inflation vs. asset price inflation
|
US Austrian Money Supply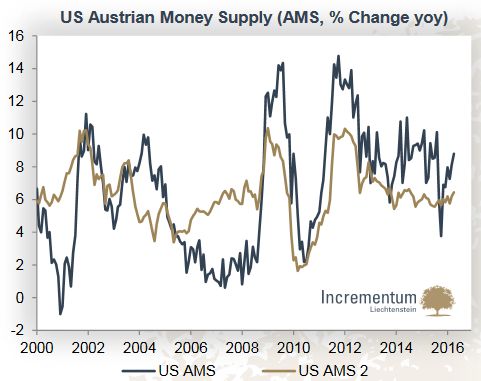 Slide 22 - Click to enlarge |
The Inflation Story since 2009 Has Been a Story of Asset Price Inflation► A debt – saturated household sector doesn’t express additional demand for credit – all the money injected by the central bank has hence been left sloshing around financial markets instead of reaching the “real” economy
► The effect of monetary inflation on the trend in US stock prices is particularly conspicuous: The strong correlation between the Fed’s balance sheet total and the US stock market has been in force for eight years now
|
 |
A Flipside of Asset Price Inflation: Falling Asset Prices Have Already Triggered the Last Two Recessions► Money supply inflation harbors the systemic danger of a subsequent contraction in money supply
► Since loose monetary policy has led to the crisis in the first place, its prospects for enduring success are low
► Problems have merely been postponed: What turned out to be unprofitable hasn‘t been liquidated, but has been kept on artificial life support
► When monetary deflation gets going, it always triggers a chain reaction with highly adverse domino effects: downgrades, which lead to rising financial costs and ultimate defaults, as well as falling asset prices
|
S&P 500 Index and US Recessions(see more posts on S&P 500 Index, )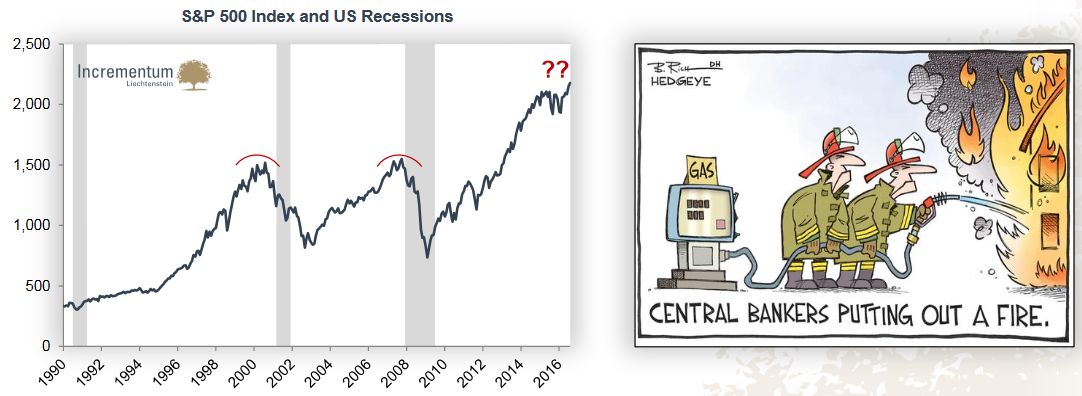 Slide 24 - Click to enlarge |
Hence, Asset Prices Appear Highly Dependent on Perpetual Monetary Pumping► Unconventional monetary policy has resulted in a further inflation of asset prices and has raised the level from which they inevitably will drop
► After the end of QE1 and QE2 the S&P 500 declined and only regained upward momentum once the Fed announced more easing; the end of QE3 was then implemented in a less abrupt manner via “tapering”
|
Fed Balance Sheet Growth Correlates with Asset Price Inflation(see more posts on S&P 500 Index, )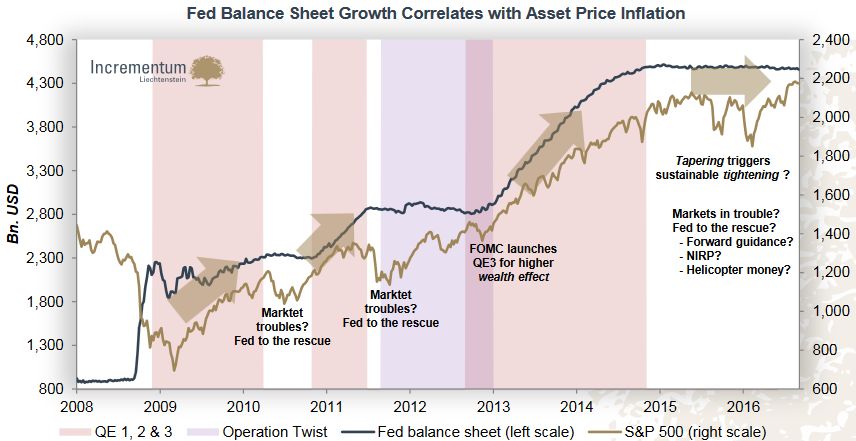 Slide 25 - Click to enlarge |
The Stagnation in the Stock Market Rally Since Last Summer Has Already Caused Stress for a Lot of Loans► Steadily rising asset prices and low interest rates have reduced many investors’ risk awareness
► There is a palpable danger that a bear market could trigger a chain reaction that leads to a recession
► Stagnation in the stock market rally since last summer and dark clouds on the horizon of the US economy – the number of loan delinquencies and charge – offs have rapidly risen
► Similar patterns could be observed on the eve of previous recessions as well
|
Loan Delinquencies and Charge-offs vs. the Federal Funds Rate(see more posts on Federal Funds Rate, ) Slide 26 - Click to enlarge |
QE – Which Puts Pressure on Yields and Flattens the Yield Curve – is Fundamentally Damaging for Banks► Also negative interest rates, which have been introduced in the euro area in June 2014, have contributed to an even more pronounced flattening of the yield curve
|
ECB Balance Sheet vs. Bank Stocks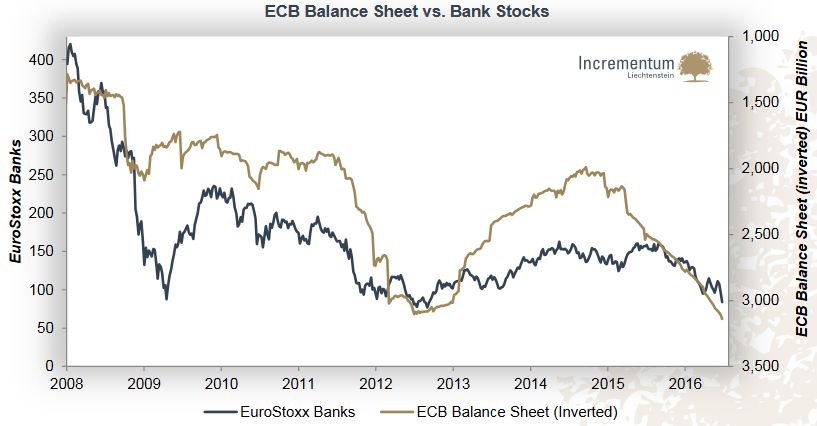 Slide 27 - Click to enlarge |
The Fed Pioneering Monetary Normalization: What If They Fail?► If the Fed fails with the normalization of interest rates, the already crumbling narrative of economic recovery could collapse
► Meanwhile, there are signs for an economic slowdown (or even a recession) in the US – further expansionary measures are hence more likely than that the Fed sticks to the plan of further tightening
► After we saw “peak bullishness” on the US dollar and “peak bearishness” on commodities last year, the sentiments – that depend crucially on the narrative of a healing US economy – have changed
|
Trade-weighted US Dollar Index and the Effective Federal Funds Rate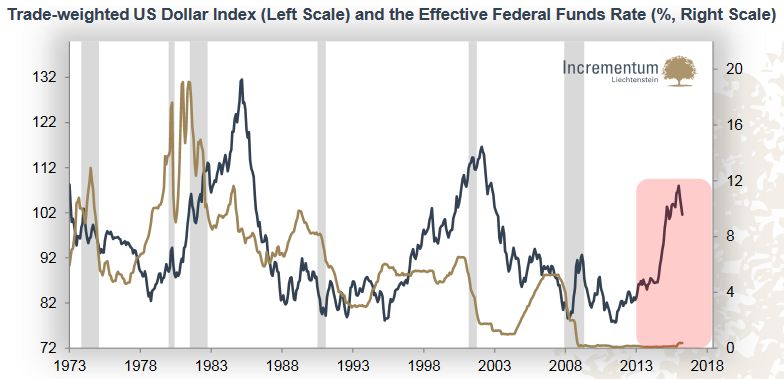 Slide 28 - Click to enlarge |
In Light of the Fundamental Economic Situation, a Monetary Normalization Appears Unrealistic |
 Slide 29 - Click to enlarge |
Is Consumer Price Inflation in the Offing?► The US dollar‘s external value is naturally important for the trend in domestic consumer price inflation in the US: There is a time lag of approximately 5 months before dollar appreciation or depreciation affects the trend in the US price inflation rate
|
US CPI vs. US Dollar Index(see more posts on U.S. Consumer Price Index, )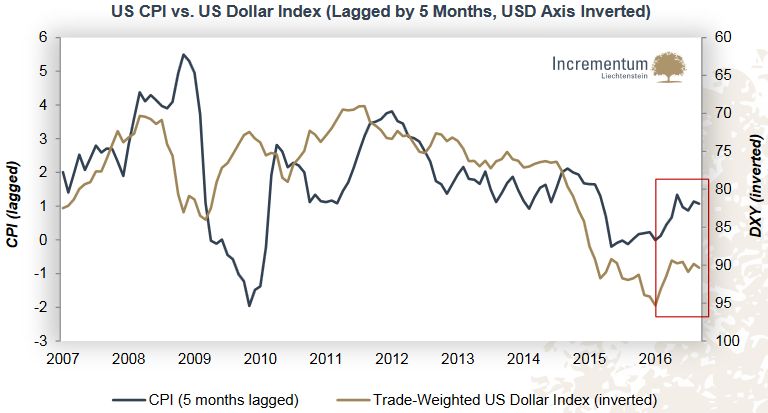 Slide 30 - Click to enlarge |
Since the Beginning of 2016 the Incrementum Inflation Signal Indicates a Full-fledged Inflation Trend► Proprietary signal based on market-derived data as a response to the importance of inflation momentum
► Guide for investment allocations in our funds –
depending on the signal’s message we shift allocations into or out of inflation – sensitive assets (i.e. mining stocks, commodities and energy stocks)
► Shorter reaction than the common inflation statistics
|
Incrementum Inflation Signal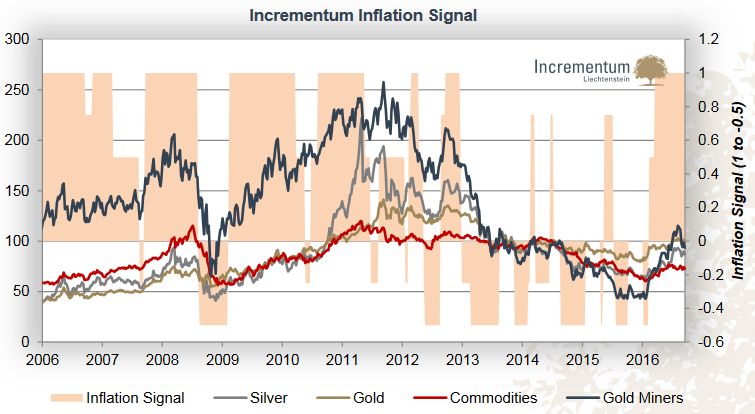 Slide 31 - Click to enlarge |
But There is a Lot of Asset Price Inflation That Could Now Spill Over to Consumer Price Inflation► A commodity price index has been used as a proxy for consumer price inflation (since we are skeptical with respect to the methodology that is commonly used); the S&P 500 has served as a yardstick for asset prices
► Key insight by this ratio: There have been alternating long-term cycles during which either consumer price inflation or asset price inflation predominated
► Similar to the peaks in 1966 and 2000, another change in trend appears to have occurred at the end of 2015
|
S&P Gold Ratio and S&P500 Oil(see more posts on S&P 500, )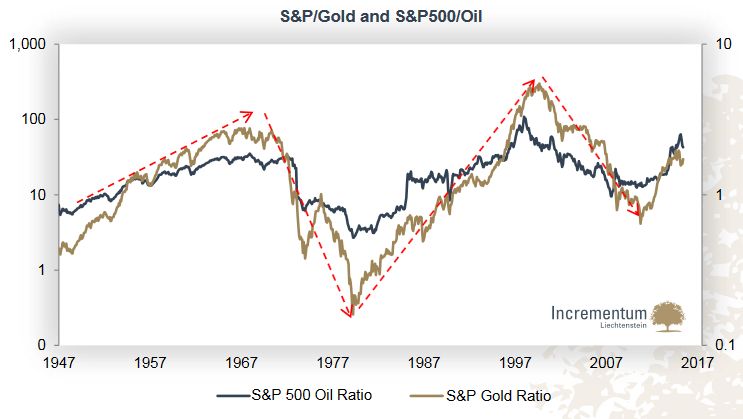 Slide 32 - Click to enlarge |
The New Bull Market in Gold Was Accompanied By an Increase in Price Inflation► Strong negative correlation between the yields on inflation-protected bonds and the gold price
► The market appears to have correctly anticipated the change in the inflation trend
|
Gold Price vs. Yield on 10-year TIPS(see more posts on gold price, )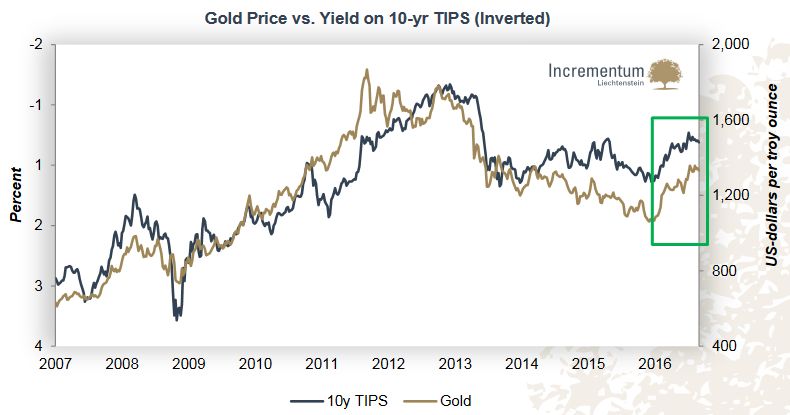 Slide 33 - Click to enlarge |
Will Gold React to a Potential Inflation Boost in the Forthcoming Months?► The oil price is affecting inflation rates due to the “base effect”
► Should the oil price remain at USD 40 or rally to USD 50 or USD 60, it will increase in year-on-year terms in the forthcoming months – the inflation rate will be boosted
|
US CPI Rates (YoY) vs. Gold(see more posts on Gold, U.S. Consumer Price Index, )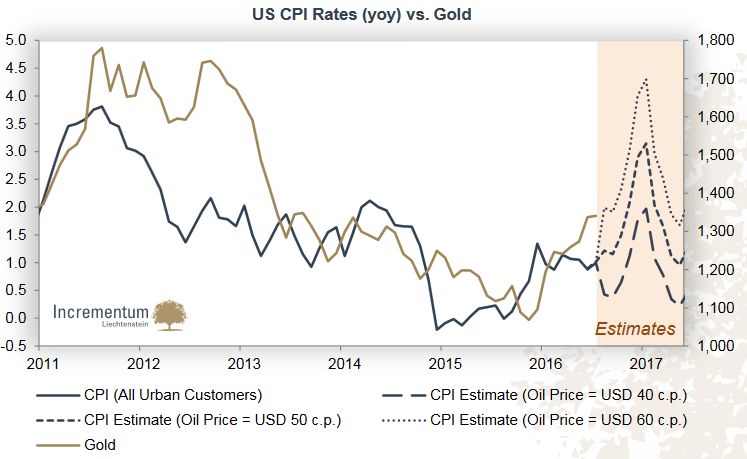 Slide 34 - Click to enlarge |
Generally, Consumer Price Inflation is Also Perceived as Low Due to Window Dressing► Policymakers have an incentive to report low inflation rates (e.g. higher GDP growth can be reported, numerous types of welfare spending as well as the valuation/demand of government bonds depend on current/expected inflation rates)
► Shadow Stats calculates the inflation rate according to the methodology employed in the 1980s
► While official price inflation according to the CPI averaged 2.7% p.a., Shadow Stats calculates an average inflation rate of 7.6% p.a. (see chart 1)
► According to the Shadow Stats data, the cost of living has risen more than 10 – fold since 1980, while the official CPI data indicate only a 138% increase (see chart 2)
|
Official CPI Inflation Rate vs. Shadow Stats Inflation Rate, CPI and Shadow Stats Inflation Index Since 1980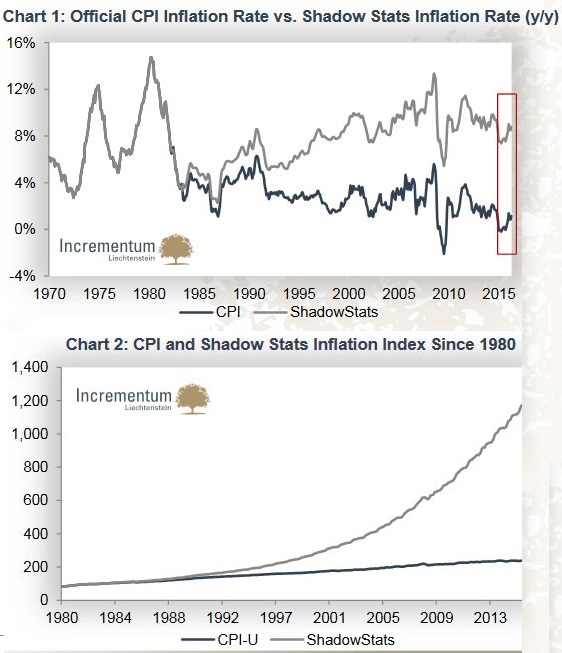 Slide 35 - Click to enlarge |
The Trend in the US Dollar is of Decisive Importance for International Inflation Trends► Systemic instability in recent years: All industrial commodities and practically all fiat currencies have declined massively against the US dollar; crude oil declined by more than 50% within a mere seven months
► Commodities, as an asset class, are an antidote to the US dollar: There is a reciprocity between the price movements, with causality attributable to the US dollar to a greater extent than is generally assumed
► While all other currencies used to be firmly tied to gold as well, they are nowadays tied to the US dollar, which is drifting like a buoy in a continually changing swell
|
US CPI vs. US Dollar Index(see more posts on U.S. Consumer Price Index, )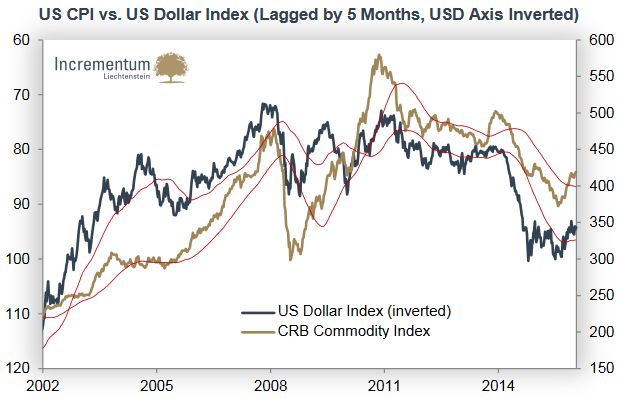 Slide 36 - Click to enlarge |
Gold Is an Antidote to the US Dollar► Negative correlation: Gold tended to do better when the dollar was weakening
► Phases during which the dollar’s exchange rate was getting stronger usually dampened gold’s performance (see the quadrant to the lower right)
► The “alpha” of gold: The intersection of the regression line with the y-axis shows that in a dollar-neutral environment, the gold price tended to increase by an average of approximately 9%
|
Gold Price vs. Trade-Weighted US Dollar Index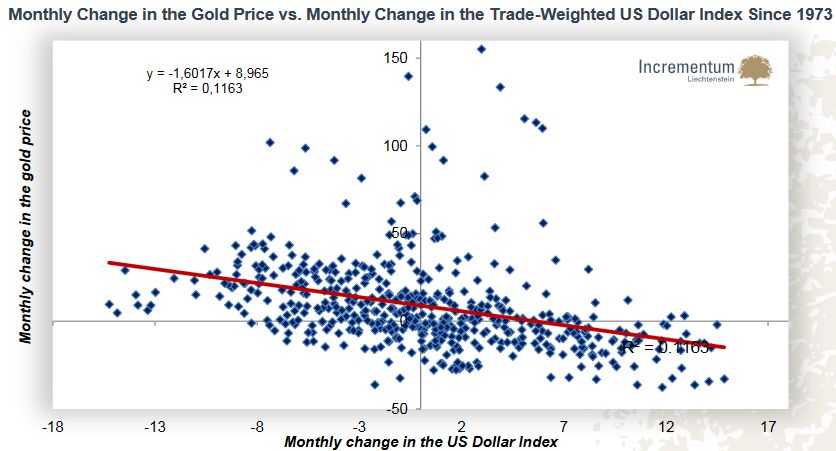 Slide 37 - Click to enlarge |
Dollar Strength and High (or Increasing) Real Interest Rates Are a Thorn in Gold’s Side► Golden circles stand for a rising gold price, white circles for a declining gold price; the larger the radius of the circles, the larger the price move
► Gold posted its largest price gains during the oil crisis of 1973 and 1979, while real interest rates were negative and the dollar‘s performance was subdued
|
Real Interest Rates and the US Dollar Slide 38 - Click to enlarge |
|
“Inflation makes it possible for some people to get rich by speculation and windfall instead of by hard work. It rewards gambling and penalizes thrift. It conceals and encourages waste and inefficiency in production. It finally tends to demoralize the whole community. It promotes speculation, gambling, squandering, luxury, envy, resentment, discontent, corruption, crime, and increasing drift toward more intervention which may end in dictatorship.”
Henry Hazlitt
|
 Henry Hazlitt |
And the Miners?They Have Had a Heck of a Run so Far in 2016
► The miners had, more even than gold, suffered from the disinflationary environment after 2011
► The final low was put in on January 19, 2016; the brief intraday-dip below the level of 100 in mid-January could well turn out to have been one of the greatest bear traps in history
► Right thereafter a stunning uptrend began to take shape, in the course of which the gold mining stocks more than doubled within a few months
|
Gold Bugs Index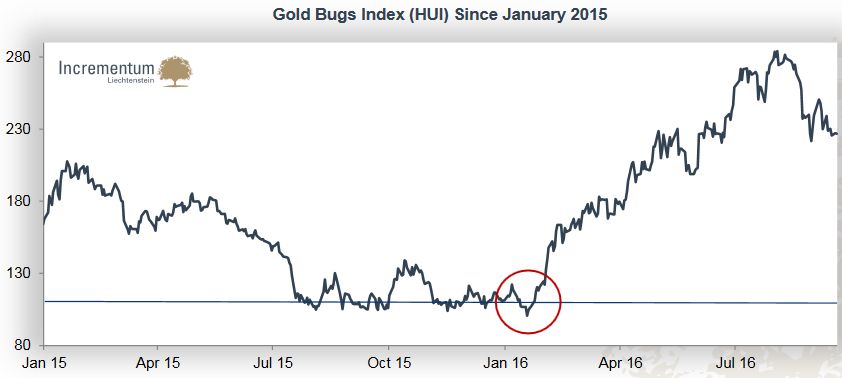 Slide 40 - Click to enlarge |
The Breakout in Mining Stocks Has Marked the End of the Cyclical Bear Market – the Boom Has Just Begun!► Despite the impressive comeback of mining stocks this year, many regard the impulsive move as a “dead cat bounce”
► Compared to previous bull markets in the BGMI, the recent uptrend is still relatively small and short in duration
|
Bull Markets Compared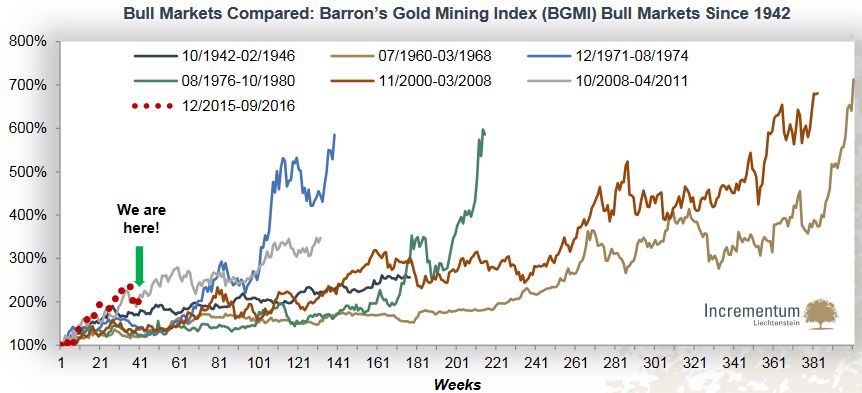 Slide 41 - Click to enlarge |
How Does the Gold Price Perform in Times of Stress?► Negative correlation between gold and the S&P 500
► Times of extreme stress in stocks (incl. “tail risk events”) and/or recessions appear to be sufficient conditions for a rally in the gold price
► Reasons:
– Gold is a safe-haven asset
– Investors anticipate monetary and fiscal stimuli as a response to the crisis and buy gold for inflation protection
|
Comparison of Annual Performance Record, Gold vs. S&P500(see more posts on Gold, S&P 500, )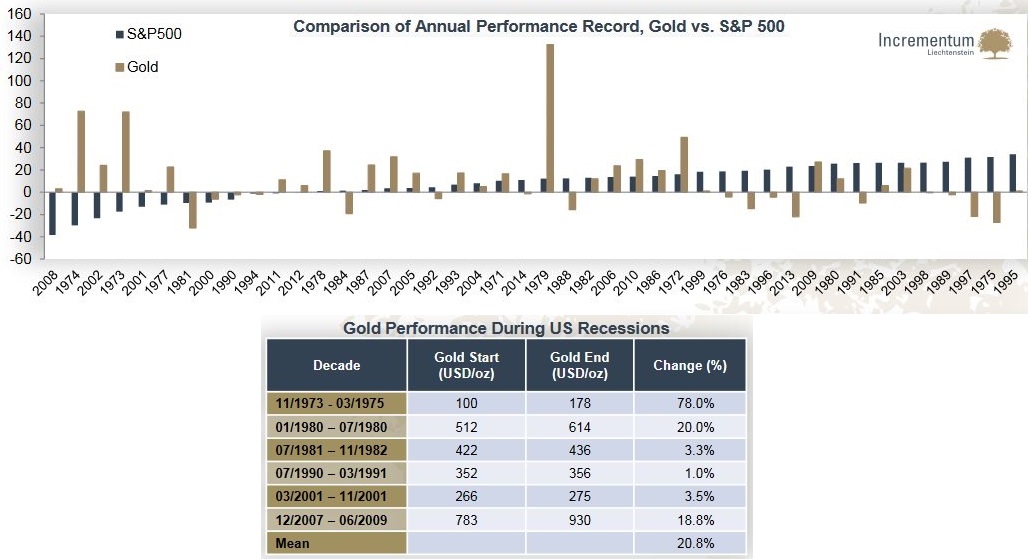 Slide 42 - Click to enlarge |
Gold and the Permanent Portfolio► Harry Browne developed in the beginning of the 1970s a concept of a forecast-free, diversified portfolio that generates long-term stable returns with a reduced volatility and without the risk of major losses: the Permanent Portfolio
► The Permanent Portfolio is equally invested in 4 asset classes: stocks, bond, cash, gold
► Regular rebalancing: A component representing a weighting of more than 35% (less than15%) of the portfolio has to be reduced (increased) back to 25%
► A few months ago Incrementum launched the first European fund that invests according to the principles of the Permanent Portfolio
“It is not our task to predict the future, but rather to be prepared for it.”
Perikles
|
Bonds, Stocks, Gold, Cash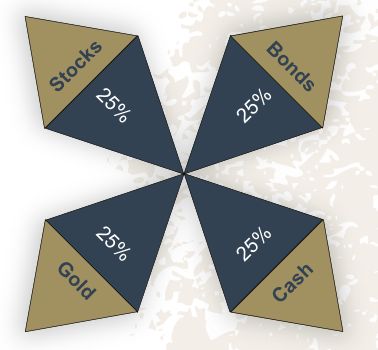 Slide 43 - Click to enlarge |
Excursus: AntifragilityIs Gold Antifragile?► In his book Antifragile: Things That Gain From Disorder (2012) Nassim Nicholas Taleb presents a scheme to classify things according to how they react to exogenous shocks:
– Fragile things suffer
– Robust things remain unchanged
– Antifragile things benefit from volatility, randomness, chaos, uncertainty, instability, unrest, and certain kind of stresses
► The antifragility theory is of course very interesting for investors and particularly for bearish ones – it‘s natural to think of gold in this context, as it‘s a stress/crisis performer
► But is gold really an antifragile investment? Or is gold maybe nothing but a narrative?
► The value of gold rests on its “trust capital”
► Its trust capital rests on its physical durability, the stability of its total stock and on the fact that it has been an enduring means of payment and wealth preservation worldwide throughout history
► Gold is liquid, also in stress situations
► Gold is in a reciprocal relationship with the monetary system
► There are also “black swans” for gold
|
 |
“In the middle of a jolly summer party, sensitive people begin to shiver.”Roland Baader
|
 |
In GOLD we TRUST 2016 in 8 Bullet Points (1/2)1. Growing uncertainty regarding economic and political developments is boosting the gold price
2. Brexit: More economic and monetary stimulus programs to counter the disintegration of the EU should be expected
3. The US economy is softening, the planned normalization of the Fed’s interest rate policy is about to fail; an economic worldview is crumbling
4. If the dollar weakens further and commodity prices continue to increase, rising price inflation and stagflation threaten
|
 |
In GOLD we TRUST 2016 in 8 Bullet Points (2/2)5. Gold investment on the part of institutional investors is about to experience a renaissance in the uncertain low interest rate environment
6. The economic environment is not only positive for gold, but alsoother inflation-sensitive assets, such as silver or mining stocks
7. Gold is back, a new bull market is coming into view
8. Incrementum confirms the long-term price target of USD 2,300 by 2018
|
 |
About Us
About the “In GOLD we TRUST” report

Ronald-Peter Stoferle - Click to enlarge
Ronald-Peter Stöferle, CMT

Mark J. Valek - Click to enlarge
Mark J. Valek, CAIA


