The New Normal and the Old Normal
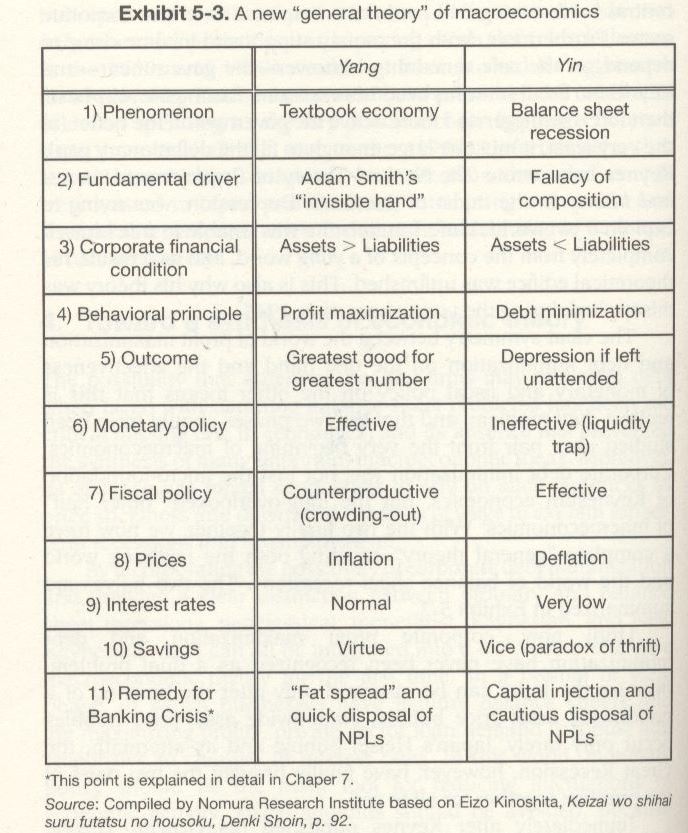
The New Normal, as named by El-Erian and Zerohedge, includes Richard Koo’s balance sheet recession (or “yin” phase) for many developed nations: lower spending and lower borrowing for years and “exceptional monetary policy” for another decade. Originally written in 2013, the concepts contained are still valid in 2014.
The successful investor must understand that others often trade the old normal, but we are in the New Normal World. The old normal is, for example, that monetary expansion leads to more credit and loans. But this is not the case in countries that are in a balance sheet recession.
In the old normal world a carry trade between high-yield and low-yield currencies was possible. At the Euromoney Swiss franc event in March 2013, I had an interesting public dispute with FX Concepts strategist Bob Savage. He told me that the Swiss franc will weaken, similar to the Japanese yen, because it will be a funding currency for the carry trade.
What has actually happened since then is that carry trade currencies have collapsed, the AUD, NZD, INR, BRL, MXN and NOK weakened. Savage explained that Japanese investors will buy foreign bonds from April on, but in reality they sold foreign bonds, while foreigners bought Japanese stocks.
In the New Normal, interest rates in developed nations will converge to zero, investors will prefer to hold the safest currencies. Countries like Spain, France or Italy are in this yin phase, while Germany and Japan have just left it and have returned to the yang phase.
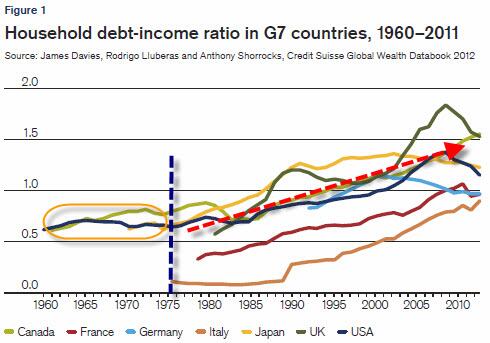
Figure 1 shows how Germany and Japan reduced household debt between 2000 and 2012, while the others increased it until 2007, Canada and Australia even until recently.
 Markets typically play Old Normal and global recovery between October and April, when US spending increases thanks to money printing (e.g. in 2012) or cheap oil prices (e.g. in 2011).
Thanks to lower US and higher German and Japanese growth in spring/summer they play New Normal from May to September.
One symptom of the New Normal is that the Bank of Japan might be obliged to hike interest rates earlier than the Fed; and, almost certainly that the SNB will hike earlier than the ECB.
But we are still some years distant from this moment; time enough to inflate Japanese, German and Swiss wages and inflation, while due to high unemployment/low participation rates, US salaries will not increase. Even worse in Southern Europe or France where salaries should fall according to the ECB.
Why we are more bullish on Japan than on the United States
Zerohedge’s protagonists like Kyle Bass of Hayman Capital think that due to insufficient population growth and high public debt, Japan will default. We are on the opposite side of this view of the New Normal. Rather, we think that Japan will recover far earlier than the U.S.
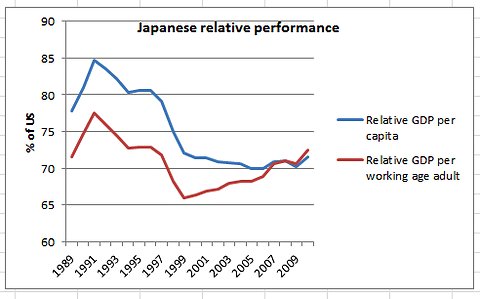
Due to the weak economic condition, the US employment to population ratio has fallen from 64% in 1999 to over 62% in 2007 to 58% in 2011. In the US, the number of pensioners and children rises far more quickly than employees. Japan has shown the same phenomenon between 1991 and 2002, with the crisis the ratio fell from 63% to 58%. But since then it has remained nearly stable, despite the ageing society, Japanese GDP per working age adult strongly increased (see graph).
The deterioration in the U.S. economy coupled with stepped up enforcement efforts at the end of the Bush administration likely caused fewer immigrants to enter the country and more to leave. In a series of recent reports, the Center for Immigration Studies estimated immigration and emigration rates throughout the decade. In general, our prior research found good evidence that the level of new immigration fell at the end of the decade and that out-migration increased. (source)
What effectively helps the U.S. is the immigration of qualified personnel. Mike Shedlock titles “100% of U.S. Employment Growth Since 2000 Went to Immigrants“
With stronger GDP growth – Japanese fertility should increase further from 1.24 in 2005 to 1.41 now. According to World Bank data, Japan is not on the bottom of this list, but South Korea, Hong Kong, Macao, Hungary and Romania with 1.1 or 1.2.
The population pyramid in Japan does not look very different from countries like Germany, still there were warnings that Japanese population could diminish by 30%.
The number of foreigners in Japan is still low with 2.2 million people, 1.5% of the population. Only the financial crisis let the number of foreign workers in Japan decrease for the first time in 50 years. With the tsunami and the period of the strong yen some more left. But now with the weaker yen things might change again.
The following pictures compare the age pyramid in Japan with Germany, they do not look very different:
Social welfare and health care could slow the U.S. more than Japan
source Wikipedia
Similar to France, the US has the issue that fertility is driven by less privileged income groups and by immigrants: in France people with North African origins have more children, while in the US Whites have a birth rate of 1.78, Blacks 1.92 and Hispanic 2.25. Weak American participation and employment to population rates could further slow U.S. fertility and immigration. Research shows that among US immigrants, the less educated ones have more children.
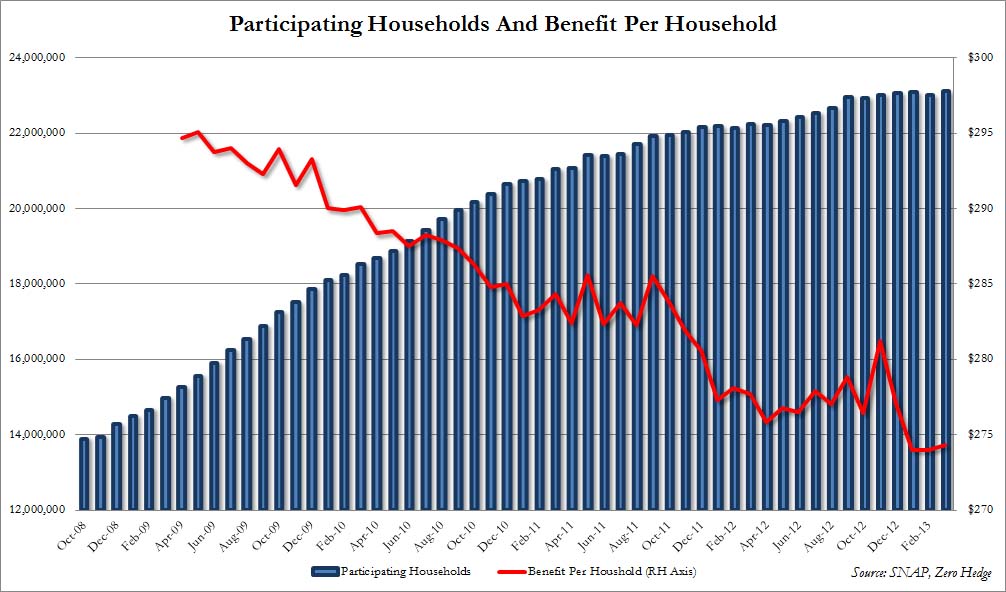
As for “food stamps”(or SNAP) 36% of participants are White, 22% are African-American, 10% are Hispanic, 2% are Asian, 4% are Native American, and 19% are of unknown race or ethnicity (source), compared to 64% Whites (excl. Hispanic whites), 12% African-American and 16% Hispanics that form the US population (source). The “peak White people” has been reached.
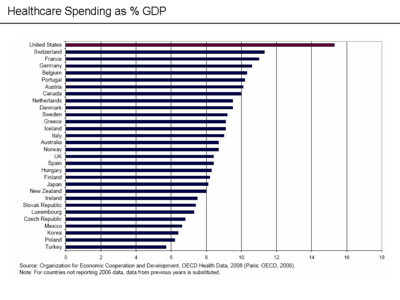
The U.S. spends nearly 15% of GDP for health care, the percentage in Japan is 8%.
Similar to European welfare and potentially “doomed-to-fail” welfare states such as France, Italy or Spain, the increasing welfare costs will counter future growth in the United States.
While these Europeans continued to increase “Total Government Spending to GDP ratios” (e.g. France 56%), the US has managed to reduce it to 34%, one reason is the housing recovery and smaller deficits on Fanny Mae and Freddy Mac. The Japanese value of 40% is somewhere in the middle.
Japan suddenly achieves current account surplus
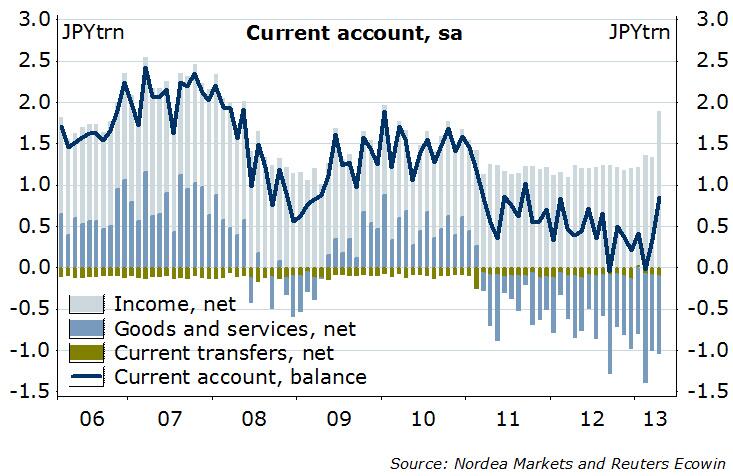
As we expected in our “Move slowly in USD/JPY short positions until September 2013″, written in January 2013, the Japanese current account has moved into positive territory, while the US deficit remains deeply red.
Kyle Bass of Hayman Capital and Axel Merk of Merk Investments expected Japan to default due to the negative current account. But cheap Brent oil prices and stronger Japanese exports helped to achieve a surplus again.
Read also:
Abenomics: Japanese Economy Would Have Recovered Even Without it
Japanese Investors Will Determine Fate of USD/JPY not U.S. Hedge Funds
Why the Yen Is Now Fairly Valued, USD back as Preferred Funding Currency


