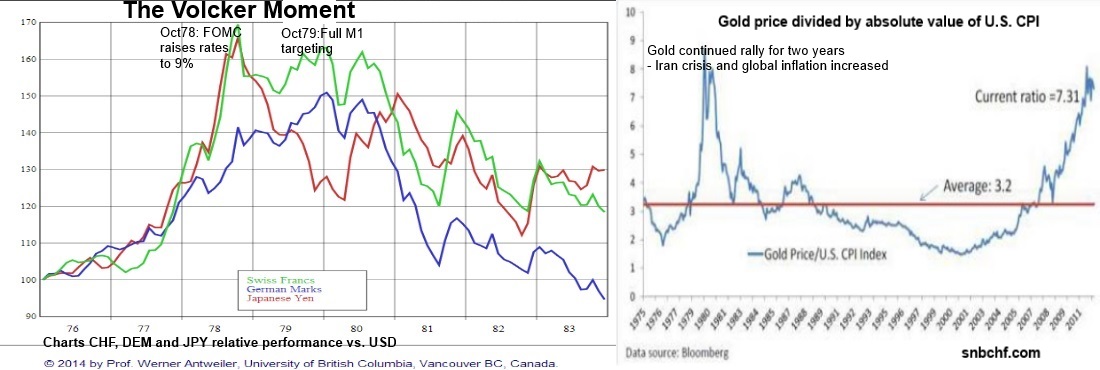
Already in 1978, the FOMC increased the Fed Funds Rate to 9%. In October 1979 the Fed adopted full monetary targets. This policy initially created higher unemployment but later it managed to defeat the price-wage spiral and stagflation. Finally both gold and the Swiss franc weakened.
On October 6, 1979, the Fed, under Paul Volcker’s chairmanship, announced and put into effect a new attempt involving drastically revised operating procedures that had some prominent features in common with monetarist recommendations. In particular, the Fed would try to hit specified monthly targets for the growth rate of M1, with operating procedures that emphasized control over a narrow and controllable monetary aggregate, nonborrowed reserves (i.e., bank reserves minus borrowings from the Fed). The M1 targets were intended to bring inflation down from double-digit levels to unspecified but much lower values.
In retrospect, the events that occurred from October 1979 to September 1982 are widely viewed as the crucial beginning of a necessary and successful attack on inflation that led, eventually, to the worldwide low-inflation environment of the 1990s.
At the time, however, the “experiment” seemed anything but successful to many Americans. Short-term interest rates jumped dramatically in late 1979 under the tightened conditions, and 1980 witnessed a major fall in output in one quarter followed by a major jump in the next, due primarily to the imposition, and then removal, of credit controls. Finally, in 1981 and into the middle of 1982, a sustained period of monetary stringency brought about the deepest recession since the Great Depression of the 1930s and began to bring inflation down, more rapidly than many economists anticipated, toward acceptable values.
Year or Average Over CPI Inflation Dec.–Dec. Fed Funds Rate “Real” Funds Rate M1 Growth Rate Adjusted M1B Growth Unemployment Rate
1960–64 1.2 2.9 1.7 2.8 — 5.7
1965–69 3.9 5.4 1.5 5.0 — 3.8
1970–74 6.7 7.1 0.4 6.1 — 5.4
1975 6.9 5.8 −1.1 4.7 — 8.5
1976 4.9 5.0 0.1 6.7 5.8 7.7
1977 6.7 5.5 −1.2 8.0 7.9 7.1
1978 9.0 7.9 −1.1 8.0 7.2 6.1
1979 13.3 11.2 −2.1 6.9 6.8 5.8
1980 12.5 13.4 0.9 7.0 6.9 7.1
1981 8.9 16.4 7.5 6.9 2.4 7.6
1982 3.8 12.3 8.5 8.7 9.0 9.7
1983 3.8 9.1 5.3 9.8 10.3 9.6
1984 3.9 10.2 6.3 5.8 5.2 7.5
1985–89 3.7 7.8 4.1 7.7 — 6.2
1990–94 3.5 4.9 1.4 7.8 — 6.6
1995–99 2.4 5.4 3.0 −0.4 — 4.9
Volcker managed to reduced US CPI inflation from 14% in 1978 to 3% in 1983. The immediate effect already in 1978, was that the dollar appreciated against CHF, DEM and JPY. Gold continued its ascent for nearly two years because of the Iran crisis and the fact that the price-wage-spiral had become a global phenomenon, even in Germany.
High interest rates in the United States made US treasuries the most interesting investment for conservative investors and crowded out stocks and risky assets. Commodity prices plunged. Latin America, that in the 1970’s initiated a growth path via debt based on Keynesian theories, did not receive enough income from commodities and were constrained to pay back debt at high interest rates. Growth in Latin America broke down.
For the Swiss, high U.S. interest rates, lower inflation and weak global growth meant that the cap on the franc in 1978 was finally successful. But one driver of the weaker franc was the Swiss referendum decision to reduce the number of foreign workers in Switzerland that weakened Swiss GDP for years.
Remark:
In September 2012, Pimco’s El-Erian named QE3 the “reverse Volcker moment”, unlimited easing so that low unemployment is achieved, no matter how high inflation gets.
See more for


