We can hope that August will be quiet. The Federal Reserve, the European Central Bank, and the Bank of Japan do not meet until September. With a snap Italian election on September 25, an Italian political storm may wait for vacationers to return. The volatility of the S&P 500, the VIX, is at three-month lows, and the equivalent measure in the Treasury market (MOVE) has come off sharply from the peak in early July that was above the 2020 extreme.
Investors and businesses continue to wrestle with rising prices on one hand and moderating economies on the other. At the same time, the powerful heat wave affecting much of the world can potentially be a significant disruptive force on economies and supply chains. Also, a new Covid subvariant, while less dangerous, is more contagious and apparently able to circumvent antibodies from the vaccines and earlier illnesses.
Officials in most high-income countries, except Japan, have signaled intentions to bring inflation down in both word and deed. They do not want to push economies into contraction but recognize that the path to the proverbial soft landing has gotten narrower as prices continue to accelerate. The derivative markets are pricing in further tightening this year, but speculation that the rate cycles will carry into next year is fading.
Even though US jobs growth remains robust, and the unemployment rate is at cyclical lows of 3.6%, nearly matching the pre-Covid low of 3.5% (admittedly with a lower participation rate), some economists argue the US is already in a recession. Still, the market expects that the Fed funds target, now 2.50%, will rise another 100 bp before the end of the year. According to the Fed funds futures strip, the market has unwound rate hike expectations for Q1 23 and has begun pricing in a modest risk of a cut by mid-year. The implied yield of the December 2023 Fed funds futures is almost 50 bp below the December 2022 contract.
The ECB delivered its first rate hike in 11 years last month, and for the first time since 2014, the deposit rate is not below zero. The 50 bp move was larger than officials initially tipped, and it seemed to have been a compromise to get a highly discretionary tool to resist widening interest rate differentials. ECB President Lagarde also noted that the euro's decline was a consideration. The exchange rate is not a target, but an input into forecasts, including inflation. The swaps market has nearly discounted a 50 bp hike in September. The deposit rate is expected to be around 1.0% at the end of the year. At the same time, the market recognizes an increased risk that the eurozone will fall into recession. In the July Bloomberg survey, the median assessment is that there is a 45% chance of a recession in the next 12 months, up from 30% in May and June.
It seems politically naive to think that Europe can arm Ukraine and impose what amounts to be historic sanctions, and Russia would not look to retaliate in a constrained manner that stops short of a direct challenge to NATO forces. Moscow is using its oil and gas. The EC says to hope for the best but prepare for the worst. Russia's success in selling energy to Asia (especially China and India) will reduce its reliance on Europe, just as Europe seeks to reduce its dependence on Russia.
China's economy contracted by 2.6% quarter-over-quarter in the April-June period as the Covid lockdowns took a toll. However, the June data showed a recovery had begun taking hold and will likely become more pronounced in the coming months. While the zero-Covid policy remains, officials are encouraging more bank lending, including to the hobbled property sector, and allowing local governments to tap into next year's bond quota to boost infrastructure spending.
In the face of protests, regulators appear to be moving to allow a postponement of payments without incurring penalties for housing projects that have not been completed. The property market accounted for about 20% of China's economic activity, and 70% of household wealth was in real estate. However, the excesses have still not been fully dealt with and will likely continue limiting economic prospects.
The rally in commodities has stalled. Two main and interconnected forces seem to be at work. First, the tightening of financial conditions means slower growth and weaker demand. Second, as interest rates rise, the attractiveness of commodities as an investment, not just inputs into production, diminishes. As a result, some industry estimates suggest speculators have divested as much as $150 bln in the commodity futures this year, with more than 10% coming in the first week of July alone.
The CRB Index fell for the second consecutive month, for the first time in nearly two years. September The front-month WTI contract finished July near $98 a barrel after peaking in June at around $118.00. September copper fell almost 32% from the June high through the July low, its lowest level since Q4 20. It bounced since the mid-July low but finished the month 3.6% lower, the fourth consecutive monthly decline. The benchmark iron ore futures had a similar pattern as copper and fell 2.8% in July, its fourth month of losses. Lumber fell by almost 45% from April through mid-June. After a three-week bounce, it rested the lows in late July. . The price of September wheat dropped by 40% from mid-May through late July, when it tested five-month lows. "Beans" still are in the 'teens, but the price of a bushel of soybeans fell from around $16 in early June to almost $13.00 in late July, a nearly 19% decline before finishing the monthly a little below $15. The average price of gasoline in the US has fallen every day since mid-June. It has pulled back by around 15 %.
Equities were crushed in the first part of the year but began the second half on better footing. The MSCI World Index of developed market equities fell by about 16.6% in Q2 and snapped a three-month decline with a gain of 2.5% in July. The S&P 500 fell nearly 16.5% in Q2, its first back-to-back quarterly decline since 2015. It rose almost 9% in July, its best month since November 2020. However, emerging market equities continued to struggle in July. The MSCI Emerging Markets Index dropped nearly 12.5% in Q2, its fourth consecutive quarterly decline. It slipped fractionally in July.
Emerging market currencies were also out of favor. Even the Hong Kong dollar's peg came under attack requiring officials to defend it on more the one occasion. Most emerging market currencies fell against the dollar. There were three exceptions. Two were from Latam (Chilean peso +2.2% and the Brazilian real (+1.6%), and the third was the Indonesian rupiah (~0.45%). Chile's central bank hiked its key rate by 75 bp instead of the 50 bp that had been expected and launched an aggressive intervention plan. Most of the Brazilian real gains took place at the end of July, perhaps linked to the lower than expected CPI which supports ideas that the central bank is nearly done. It is expected to the Selic rate by 50 bp to 13.75% on August 3. That is a 50 bp below what is expected to be the peak. Central European currencies and the Russian rouble (-13.5%) were at the bottom part of the performance table. The Turkish lira fell almost 7%, bringing the year-to-date decline to nearly 26%.
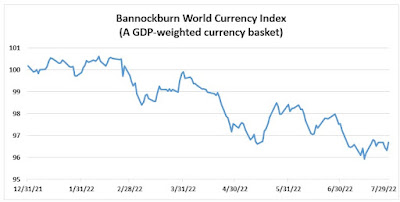
The Bannockburn World Currency Index, a GDP-weighted basket of the 12-largest economies, extended its downtrend through the middle of July when it visited two-year lows. This reflected the broad depreciation of the world's currencies against the dollar. As the greenback lost some luster after the mid-July, the BWCI rose in the last two weeks of the month, and trimmed the month's loss to about 0.8%. The Japanese yen was the best performer, rising 1.8% against the dollar followed closely by the Brazilian real gain of 1.6%. The Australian dollar was not far behind, appreciating 1.25%. Leaving aside the Russian rouble, the euro fell the most, losing 2.5%. It was the second consecutive month of more than a 2.25% drop. The Mexican peso's loss was the most after the euro and it lost half as much.
Dollar: The dollar extended its bull advance and recorded new highs against most of the major currencies in the first half of July. However, weaker real sector data, culminating with a contraction of 0.9% in Q1, saw the greenback stabilize before turning lower against most non-European major currencies. On a trade-weighted basis, the dollar peaked in the middle of July. With the Fed funds rate now in the range of what most Fed officials regard as neutral, the Federal Reserve's tightening campaign is entering a new phase. Even after the contraction in GDP, the Fed Funds futures have a 50 basis point hike fully discounted for the next FOMC meeting (September 20-21). The market is pricing in a little more than a 25% chance of a 75 bp move instead. It has a year-end rate of 3.30%, down about 7.5 bp on the month. At the end of H1, the futures market had anticipated no change in the target rate in H1 23, but at the end of July, the implied yield of the June 2023 Fed funds futures contract was 15 bp below the December 2023 contract. The Fed's Jackson Hole symposium (August 25-27) will be scrutinized for clues into the evolution of the central bank's thinking about the economy. The greenback's appreciation is challenging for exporters and a headwind for translating foreign earnings back into dollars. However, the dollar's strength is part one of the channels identified by Powell through which monetary policy impacts the economy and financial conditions.
Euro: The single currency briefly traded below $1.00 for the first time in 20 years in June. It recovered from the $0.9950 low to almost $1.0280. By the time the ECB surprised many with a 50 bp rate hike on July 21, most of the recovery had already been recorded. ECB President Lagarde was explicit that there was no forward guidance for now and the central bank would act on a meeting-by-meeting basis ("data-dependent"), the swaps market is pricing (~80%) a 50 bp hike at the next meeting on September 8. After that meeting, there will be two more this year, and the market anticipates two quarter-point moves. However, the economic headwinds are growing more intense. Europe's benchmark for natural gas prices rose by 35% in July after surging 65%in June. The shock may be best illustrated by noting that the benchmark price has risen around 20.5-times since July 2019. Brent has increased by about 60%, as has the average price of retail gasoline in the US. Germany is particularly vulnerable to the weaponization of gas by Russia. The US 2-year premium over Germany widened to almost 272 bp in July, the most since mid-2019. Typically, the rate differential peaks ahead of the exchange rate, and it does not look like the differential has peaked. The ECB unveiled a new tool, the "Transmission Protection Instrument," intended to be used in emergencies to resist "unwarranted" divergence of interest rates. However, it does not appear that the widening of spreads spurred by the political uncertainty and the collapse of the Draghi government in Italy meets the test. Italy's election has been brought forward to September 25 from next May.
(July 29 indicative closing prices, previous in parentheses)
Spot: $1.0220 ($1.0485)
Median Bloomberg One-month Forecast $1.0315 ($1.0525)
One-month forward $1.0240 ($1.0505) One-month implied vol 10.2% (9.4%)
Japanese Yen: The assassination of former Prime Minister Abe was a shocking tragedy. It may have been different in other countries, but the capital markets barely reacted. The government had some successes in the capital markets. First, although the yen fell to new 24-year lows against the dollar, volatility has decreased, as officials wanted. Benchmark three-month implied volatility fell from 14% in mid-June to below 11% by the end of July. It is still elevated but near its 100-day moving average (~10.4%). Second, the pullback in global yields helped take the pressure off the 0.25% cap on the 10-year Japanese government bond. After purchasing a record amount of government bonds in June (~JPY16 trillion or roughly $1120 bln), the Bank of Japan did not defend the cap at all. We suspect the exchange rate will enter a new trading range. The lower end of the new range may be around JPY130.00. The upper end of the range may be JPY140.00.
Spot: JPY133.25 (JPY135.70)
Median Bloomberg One-month Forecast JPY134.15 (JPY134.35)
One-month forward JPY133.00 (JPY135.45) One-month implied vol 10.8% (13.0%)
British Pound: The Bank of England delivered four quarter-point hikes this year to lift the bank rate to 1.25%. It will likely accelerate the pace at the August 4 meeting to 50 bp. The market has second thoughts and at the end of July had only a 50% chance of a 50 bp rather than 25 bp hike discounted. The swaps market has discounted another 100 bp in rate hikes before the end of the year (three more meetings). The swaps market sees a terminal rate around 2.75%. The US and UK two-year yields were almost identical at the start of the year, and now the US offers a premium of more than 120 bp. The Tories are picking a new party leader, who will become the next UK prime minister, between the former Chancellor of the Exchequer Sunak and Foreign Minister Truss. The polls give it to Truss, which could mean tax cuts and some review of the Bank of England's mandate. The outcome will be known on September 5. The UK economy appears to be recovering from the soft patch in the Feb-April period. Yet it might not be sufficient to avoid a contraction in output in Q2 after a 0.8% expansion (quarter-over-quarter in Q1). Sterling fell for the sixth month this year, only rising slightly (less than a quarter-of-one-percent) in May. Sterling rose nearly 2.6% against the euro in July, the most in three years. One consideration may have been that the UK premium over Germany (two years) widened 23 bp to almost 145 bp. Short-covering appeared to help sterling recover from the two-year low in mid-July near $1.1760. It finished the month above the 20-day moving average (~$1.20) and the downtrend from early June. Further corrective gains are possible in the coming weeks, but the determining factor may be the greenback's overall performance rather than anything specifically British. We suspect it may be capped in front of $1.24.
Spot: $1.2170 ($1.2180)
Median Bloomberg One-month Forecast $1.2135 ($1.2260)
One-month forward $1.2180 ($1.2190) One-month implied vol 10.1% (10.8%)
Canadian Dollar: The Bank of Canada surprised the market by lifting the overnight target rate by 100 bp on July 13. However, the risk environment was still working against the Canadian dollar, which fell to a new two-year low against the US dollar. Nevertheless, the S&P 500 put the month's low the following day, and the Canadian dollar recovered. The US dollar fell from almost CAD1.3225 to new lows for the month slightly below CAD1.2800. The macroeconomic backdrop is constructive. Canada enjoys a positive terms-of-trade shock, a strong labor market, and robust portfolio inflows (average in the Jan-May period of almost C$20 bln a month, double the pace for the similar year-ago period). Three Bank of Canada meetings are left this year, and the swaps market has discounted almost another 100 bp in hikes. However, as we have seen with Fed expectations, the market expects the Bank of Canada to cut rates in the second half of next year.
Spot: CAD1.2795 (CAD 1.2875)
Median Bloomberg One-month Forecast CAD1.2825 (CAD1.2810)
One-month forward CAD1.2800 (CAD1.2880) One-month implied vol 7.6% (7.6%)
Australian Dollar: The Australian dollar continued the sharp sell-off that began in June from nearly $0.7280 and bottomed in mid-July six cents lower. It recovered half of the losses before the end of the month. A move above the $0.7000 area could signal another half-to-a-cent-and a half gain. The exchange rate is sensitive to the risk appetite, and the correlation with changes in the S&P 500 is above 0.70 for the past 30-days and only slightly lower for the past 60-days. The Aussie is often sensitive to copper prices (0.65 correlation, past 30 days) and gold (0.52). The central bank is expected to hike by 50 bp when it meets on August 3 (75% probability in the cash rate futures market) to 1.85%. It would be the third consecutive 50 bp hike after the cycle was initiated was a quarter-point move in May. The market leans toward another 50 bp move in September, but sentiment is transitioning and reconsidering the central bank's aggressiveness. The expected year-end rate has fallen from 3.50%, as recently as July 21, to 3.0% at month's end.
Spot: $0.6985 ($0.6905)
Median Bloomberg One-Month Forecast $0.6995 ($0.70100)
One-month forward $0.6995 ($0.6910) One-month implied vol 12.0% (12.7%)
Mexican Peso: There seem to be two drivers of the exchange rate now. The first is that the peso tends to weaken when sentiment is risk averse, as reflected in the performance of the S&P 500. The correlation of the changes is more than 0.60 for both the past 30 and 60 sessions. The second force on the exchange rate is the trajectory of US monetary policy, as reflected in the performance of the two-year note. The correlation between the change in the peso and US two-year yields had been gravitating around zero until early June. Although it peaked above 0.60 in June, near 0.45 now, it is higher than in the first five months of the year. With inflation still rising, the central bank is expected to raise its target rate 75 bp to 8.50% when it meets on August 11. The slower pace of Fed hikes expected going forward, as we have discussed, will allow Banxico to do the same. The peso is the only emerging market currency that truly trades 24 hours a day, and given that it is freely accessible, it often serves as a proxy for other emerging market currencies. The peso fell by about 1.25% in July, and the JP Morgan Emerging Market Currency Index fell roughly 2.5%. The peso is slightly higher on the year (~0.75%), while the index is off around 4.2%.
Spot: MXN20.37 (MXN20.11)
Median Bloomberg One-Month Forecast MXN20.32 (MXN20.09)
One-month forward MXN20.48 (MXN20.22) One-month implied vol 11.9% (11.6%)
Chinese Yuan: The Chinese economy appears to be recovering from the Covid-related weakness. The composite PMI has rebounded to its best since May 2021, while the US and eurozone composite PMI readings have fallen below the 50 boom/bust level. This new divergence has seen the Chinese 10-year discount to the US, which peaked in mid-June near 65 bp, moved back to offer a small premium (~10 bp). On the other hand, Chinese stocks underperformed, with the CSI falling by around 7%. Chinese officials are introducing measures to support the property market and encouraging banks to support the sector. In addition, local governments are being encouraged to draw on next year's loan quotas. Chinese officials tolerated a small weakening of the yuan against the dollar but within a broadly sideways range, as the yuan appreciated on a trade-weighted basis. A move above CNY6.80 would be noteworthy. The lower end of the near-term range is around CNY6.68-CNY6.70. We suspect officials are content with broad stability against the greenback.
Spot: CNY6.7445 (CNY6.6995)
Median Bloomberg One-month Forecast CNY6.7475 (CNY6.7175)
One-month forward CNY6.7465 (CNY6.6985) One-month implied vol 5.6% (6.6%)
Full story here Are you the author? Previous post See more for Next post
Tags: Featured,macro,newsletter


