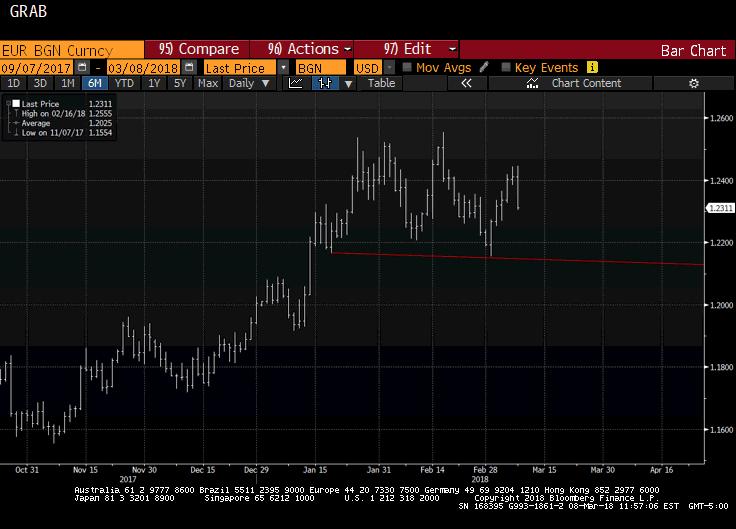
| The euro appears to be potentially carving out a topping pattern. Recall that after correcting lower last September and October, the euro rallied for three months through January before weakening 1.75% in February. That was its biggest decline since February 2017.
The euro’s high print was actually on February 16 near $1.2555, when it posted a key reversal, which is when it makes a new high for the move and then closes below the previous day’s low. The euro was sold to $1.2155 on March 1. It posted an outside up day on March 1 and recovered smartly through today’s high (~$1.2445) a tick or two above yesterday’s high. It has reversed lower again, perhaps encouraged by the realization that the small trimming of next year’s inflation was a dovish signal. To bolster confidence that a high of some importance is in place, it is important that the low from late January (~$1.2165) and the low from March 1 ($1.2155) is convincingly violated. That appears to be the neck line of a potential head and shoulders top. It is also roughly the 38.2% retracement of the euro’s rally since the start of last November. |
EUR/BGN Currency Oct 2017 - Apr 2018 |
If the head and shoulders pattern is valid, it would project toward $1.1750. There is much wood to chop before getting there. The $1.2055 area corresponds to a 50% retracement and the $1.1940 is the 61.8% retracement of the rally that began last November.
The technical indicators are sympathetic to this view. The RSI has been trending lower since late January and did not confirm the marginal new high the euro recorded in mid-February. The MACD also showed this bearish divergence. The recent bounce saw the MACED turn higher, but its rolling over again. The Slow Stochastic is turned up, but the Fast Stochastic has turned lower. The technical indicators of the weekly bar charts are also favor the downside.
Speculators in the futures market have a near-record net long euro position. The record was set at the end of January near 149k contracts. As of last week, they were still net long 138k contracts. The gross longs peaked a bit earlier in January near 262k contracts. As of last week, there was still a 238.3k net long speculative position. The gross shorts are substantial, but around 100k contracts, it is half the size as it was prior to the French elections last April.
Separately, we note the Dollar Index may be forging a bottom, though the pattern is not as clear as the euro. The Dollar Index stalled near the 50% retracement of this month’s losses at near 90.15. The 61.8% retracement is near 90.35, and this needs to be taken out to bolster confidence that a low has been recorded. However, the 91.00 are may be formidable.
Similarly, the dollar appears to have also carved out a head and shoulders bottom against the Swiss franc. The dollar has reached its best levels since January 24 today. The neckline is seen near CHF0.9500, which is also approximately the 38.2% retracement of the decline since last November. If convincingly violated projects toward CHF0.9800, which is beyond the 50% retracement (~CHF0.9610) and the 61.8% retracement (~CHF0.9715).
Are you the author? Previous post See more for Next postTags: #USD,$CHF,$EUR,Great Graphic,newslettersent


