A client sent us the quote below from Michael Oliver of Momentum Structural Analysis and asked for our comments regarding gold and the growth of the M2 money supply:
"...if you are taking profits in gold and putting that into cash Dollars, thinking that’s a good idea, then go to the St. Louis Fed’s site and look at the M2 chart. If you take the size of M2 now (their update as of early this year) and go back to 2020, six years inclusive, the money supply has increased by 45%. So if you think cash is an alternative place to be, think again. No, it’s not yet at Weimar levels in the U.S. (and the Western world in general), but that’s a major and ongoing decay in real value, year by bloody year. Cash is not a place to be."
The important point to note about Oliver’s comment is that he doesn’t provide context to determine whether the recent 45% growth in the money supply is significant. He, like many others, thinks of gold as an inflationary hedge. If we assume inflation is the basis on which to buy or sell gold, then what matters most is the change in the money supply in relation to the change in the economy. As we share below, the money supply grew much quicker than the economy in 2020 and 2021. But since then, it has grown considerably slower. Over the six years Oliver highlights, GDP growth has slightly outpaced the M2 money supply.
If we assume monetary velocity is constant (we elaborate on velocity further below), then the growth in M2 was inflationary in 2020 and 2021, but if anything, it has become disinflationary or deflationary. Think of it this way. If an economy produces 10% more goods and services but the money supply only grows 5%, there is more stuff available to buy, but not proportionally more money to buy it with. Sellers must either lower prices to sell their goods or let their unsold inventory grow. Either way, the price pressure is downward, not upward. Thus, if the reason to hold gold is to protect against inflation, the relative growth of the money supply may have been a valid rationale a few years ago, but it is no longer the case.

What To Watch Today
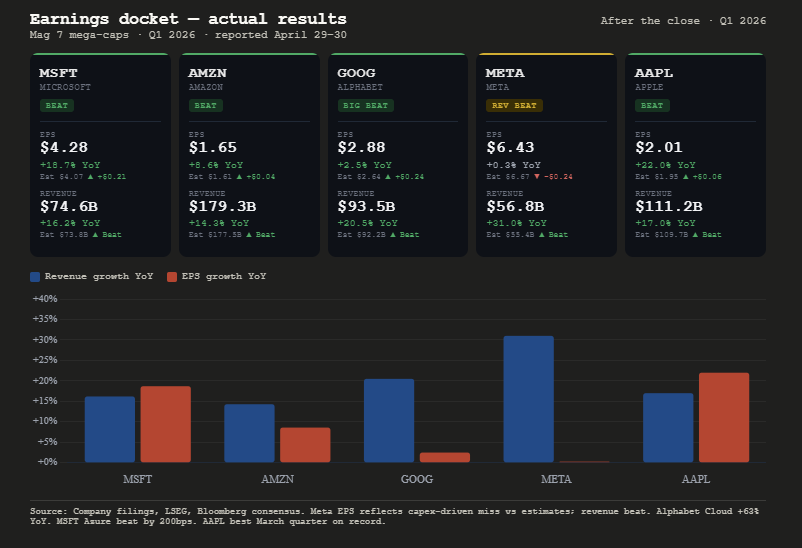
Earnings
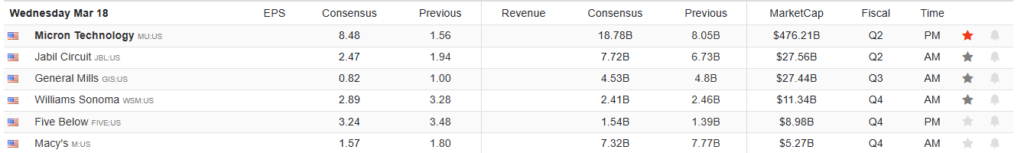
Economy

Market Trading Update
Yesterday, we touched on the more contrarian signal of extreme short positioning in the market. On another topic, I posted a chart over the weekend on the "myth" of missing the 10-best days in the market.

What was most interesting were the comments suggesting that, since you can't "time" the market, all you can do is "hold" on. The problem with that analysis is that it assumes an inability to manage risk and avoid substantial market drawdowns. While we disagree with that premise, there are some caveats to that disagreement.
- We are not discussing "market timing," or being all in or out of the market, on a given day.
- We are discussing how to manage risk to avoid more significant drawdowns over time.
The second point is most important as the "10-Worst Days" almost always coincide with the "10-Best Days." So, yes, while yo uwill mist the 10-best days, as noted above, missing the 10-worst days is far more important to your future returns.

This is why we consistently discuss reducing risk BEFORE drawdowns occur. As noted in "Technical Deterioration: Risk Management Is Key."
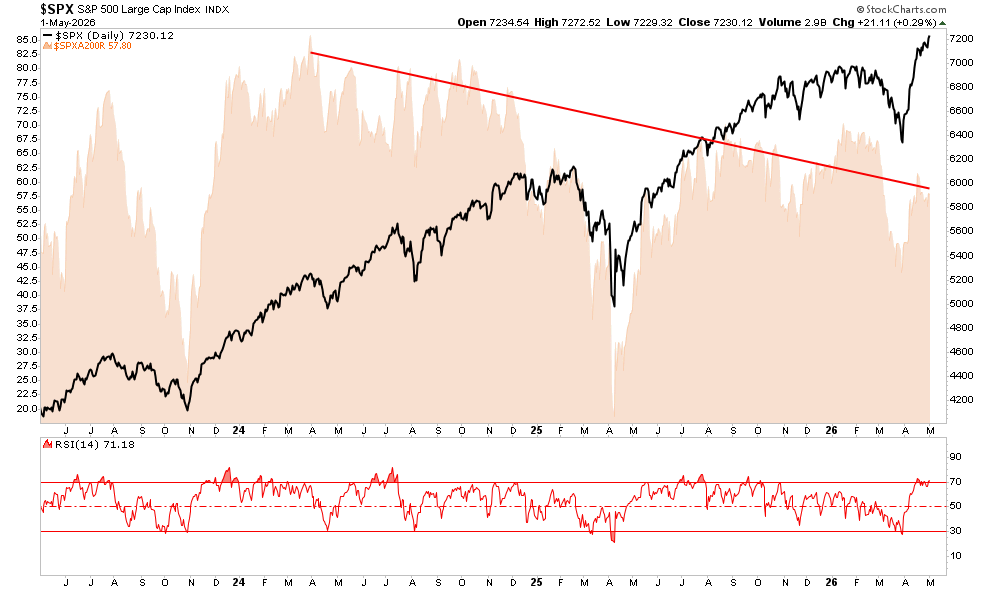
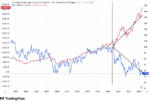
"The weekly chart structure reinforces the bearish case. As shown, with the market trading at the top of its long-term bullish trend, the combined “sell signals” of the short and intermediate-term momentum indicators were last seen in 2022. With the long-term trend supports substantially lower, the risk calculus of equities is shifting away from investors."
That assessment is why we suggested that for long-only portfolios, raising cash to 10–15% of the portfolio and increasing short-term bond holdings can provide a decent hedge against further volatility. That has certainly been the case since that post.
The point here is that while "risk management" will get you out early of a bull market, that is better than the impact of the 10-worst days on your portfolio.
Again, I am not implying, suggesting, or stating that such signals mean going 100% to cash. What I am suggesting is that when “sell signals” are given, that is the time when individuals should perform some basic portfolio risk management, such as:
- Trim back winning positions to original portfolio weights: Investment Rule: Let Winners Run
- Sell positions that simply are not working (if the position was not working in a rising market, it likely won’t in a declining market.) Investment Rule: Cut Losers Short
- Hold the cash raised from these activities until the next buying opportunity occurs. Investment Rule: Buy Low
By using some measures, fundamental or technical, to reduce portfolio risk by taking profits as prices/valuations rise, or vice versa, the long-term results of avoiding periods of severe capital loss will outweigh missed short-term gains.
Small adjustments can have a significant impact over the long run.

Velocity Also Matters
Barely discussed in our opening conversation about the relationship between M2 growth and inflation was the role of monetary velocity. Oliver's opening quote is typical, as many gold-centric, high-inflation forecasters focus heavily on M2 growth while overlooking the velocity of money. What is monetary velocity? Per the St. Louis Fed:
The velocity of money is the frequency at which one unit of currency is used to purchase domestically- produced goods and services within a given time period. In other words, it is the number of times one dollar is spent to buy goods and services per unit of time. If the velocity of money is increasing, then more transactions are occurring between individuals in an economy.
The rate of monetary velocity is a function of the money supply (how much money exists) and economic activity (how often it circulates). Given that we already account for M2 growth when considering inflation, the other key factor, velocity, is largely a function of businesses' and consumers' willingness to spend. Below are a few factors that help determine velocity:
Positive Correlation:
- Interest Rates/ Credit Availability
- Consumer & Business Confidence
- Inflation Expectations
Negative Correlation:
- Savings Rate
- Aging Demographics
- Economic Uncertainty
Thus, when we think about where inflation is heading, we must consider how money is growing and, just as important, the incentives for businesses and consumers to spend or save.

Tweet of the Day

“Want to achieve better long-term success in managing your portfolio? Here are our 15-trading rules for managing market risks.”
Please subscribe to the daily commentary to receive these updates every morning before the opening bell.
If you found this blog useful, please send it to someone else, share it on social media, or contact us to set up a meeting.
The post M2 Money Supply: Is 45% Growth Really Inflationary? appeared first on RIA.
Full story here Are you the author?You Might Also Like
 Middle East Military Conflicts And Stocks
2026-03-04
The question for investors is how the Iranian conflict will affect the stock market. The markets’ initial reaction on Sunday was concern as the S&P 500 fell by over 1%, crude oil rose nearly 10%, and precious metals rallied. Within 12 hours, many of the substantial gains or losses, except oil, were reversed. However, stocks, …
 Transportation Stocks Are At Odds With Truck Sales
2026-01-14
Yesterday’s Commentary noted the recent strength in transportation stocks. For example, the transportation ETF (XTN) has outperformed the S&P 500 by more than 9% over the last 25 trading days. The leading stocks within the ETF over this period include. ARCB (trucking), MATX (shipping), WERN (freight shipping), and FedEx (shipping). Some of the recent gains …
 Year-End Rally Begins
2025-11-29
🔎 At a Glance 💬 Ask a Question Have a question about the markets, your portfolio, or a topic you’d like us to cover in a future newsletter? 📩 Email: [email protected]🐦 Follow & DM on X: @LanceRoberts📰 Subscribe on Substack: @LanceRoberts We read every message and may feature your question in next week’s issue! 🏛️ …
 The K Shaped Economy In One Graph
2025-11-28
Tuesday’s weak Consumer Confidence report was a good reminder of why some economists are calling our economy the K shaped economy. The Conference Board Consumer Confidence Index fell 6.8 points to 88.7 in November, below expectations of 93. Moreover, it sits at levels similar to those of early 2020, when the pandemic shuttered the economy. …
Tags: Featured,newsletter