


The Treasury General Account (TGA) is effectively the US Treasury’s checking account held at the Fed. The changing balance of the TGA affects the financial system's liquidity, thereby influencing broader economic and market activity. For example, when the Treasury raises its TGA balances by issuing more debt and or collecting more tax revenue than it spends, that moves from the banking system into the Fed. The money can no longer be lent out or deployed in markets; thus, liquidity tightens. Conversely, when the Treasury draws down its TGA by spending more than it borrows or collects in tax revenue, that cash flows into the banking system, increasing reserves and liquidity.
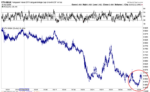
The impact on liquidity from changing TGA balances was most noticeable in 2020. With significant amounts of crisis-related debt issuance, the Treasury built the TGA to nearly $1.8 trillion in mid-2020, then spent it down rapidly, injecting hundreds of billions into the system. Markets surged, and economic activity picked up. That event was an anomaly, but it showed how large shifts in the TGA can impact the economy and markets. Most often, the Treasury increases its TGA ahead of potential debt-ceiling dates. Once those dates have elapsed, the Treasury rapidly runs down the TGA balances.
As we share below, the TGA is now at its highest level since 2020. Bear in mind that part of the recent increase is due to tax revenue from April 15th. That said, the balances were already high before the boost. From an investor's perspective, it's not important why they are doing it; what matters is understanding that when they reverse course, the economy and markets will benefit from a shot of liquidity.
What To Watch Today
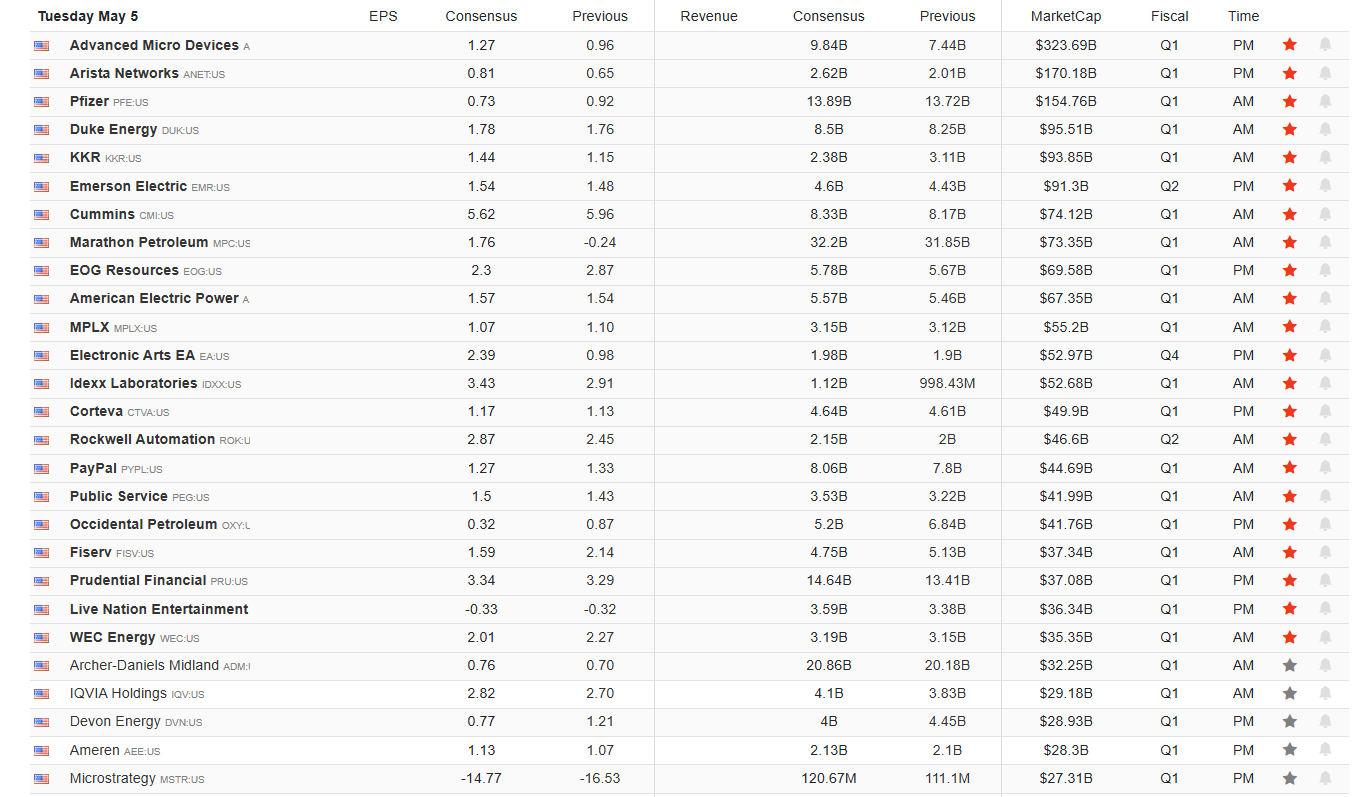
Earnings
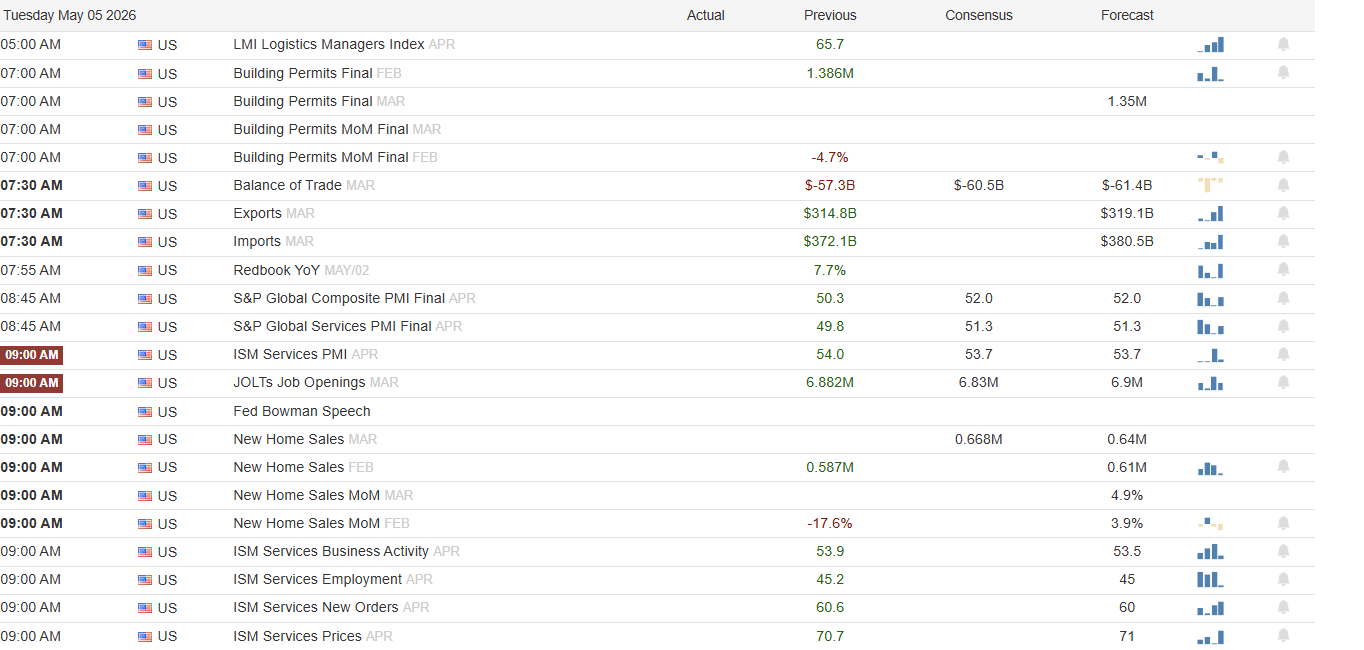
Economy
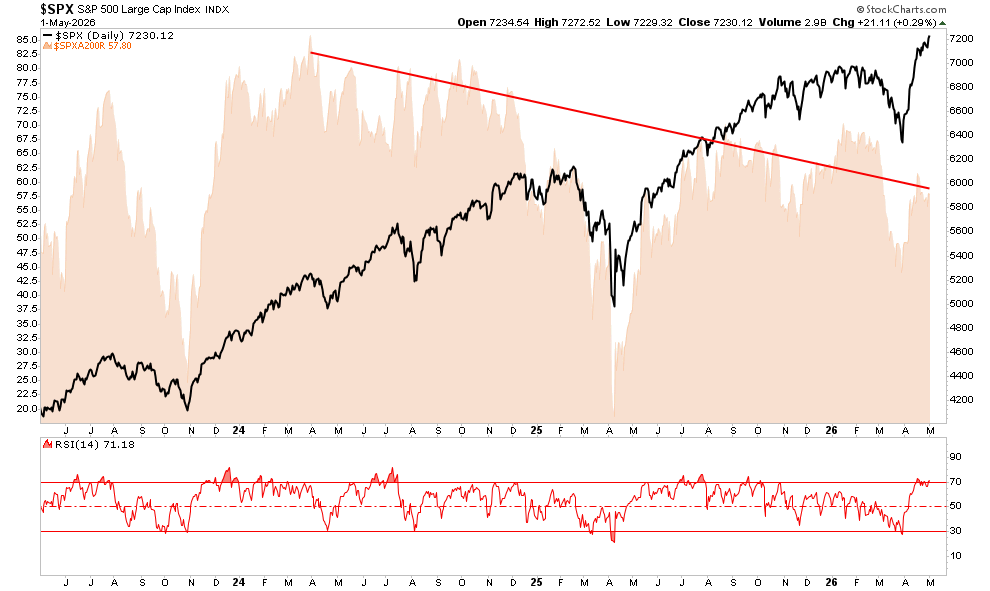
Market Trading Update
Yesterday, we discussed the market's technical backdrop, which remains bullish. Today, I want to discuss why the market trades differently than in the past.
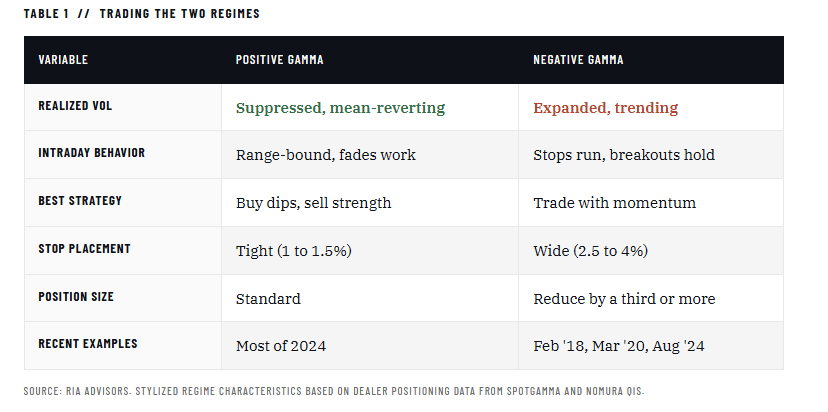
Active traders run into the same problem every cycle. A breakout that should have run for three days reverses on the second print. A pullback that "should" hold the 50-day rips through it on heavy volume. The setup looked identical, but the tape behaved nothing alike. Most of us blame noise or our own discipline. The real culprit is usually dealer gamma.
Options dealers sit on the other side of every contract that gets bought or sold. To stay neutral on direction, they hedge in the underlying. The size and direction of that hedging flow depend on whether dealers are net long gamma or net short gamma. That single distinction reshapes the tape's entire character.
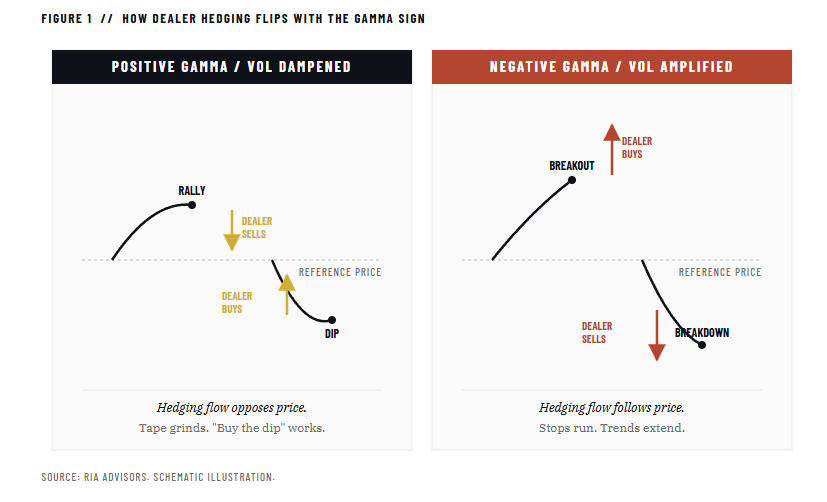
When dealers are long gamma, they sell rallies and buy dips to stay neutral. That dampens moves in both directions. The S&P grinds higher in tight ranges, intraday reversals are common, and "buy the dip" works as if it were a law of physics. That's the regime that frustrated bears for most of 2024. When dealers flip to short gamma, the hedging flow reverses. They buy strength and sell weakness, amplifying every move the market tries to make. Stops get run. Breakouts hold. What looked like a 1% wobble becomes a 3% drawdown by the close. February 2018, March 2020, and August 2024 unwind all fit this profile.
The implication is simple, even if it's rarely applied. Position sizing, stop placement, and even your time of day for execution should shift with the regime. A 1.5% stop is generous on a positive gamma tape and useless on a negative gamma tape. Mean reversion works in one regime and gets you killed in the other.
Most retail traders have never heard of the gamma flip level. SpotGamma, GammaLabs, and the volatility desks at Nomura and Goldman publish gamma exposure estimates regularly, and the data isn't hidden behind a Bloomberg terminal anymore. You don't need to model it yourself. You just need to know which side of the flip the market is sitting on and adjust accordingly.
That's the difference between trading the tape and getting traded by it.

Breadth Is Not As Bad As It Seems
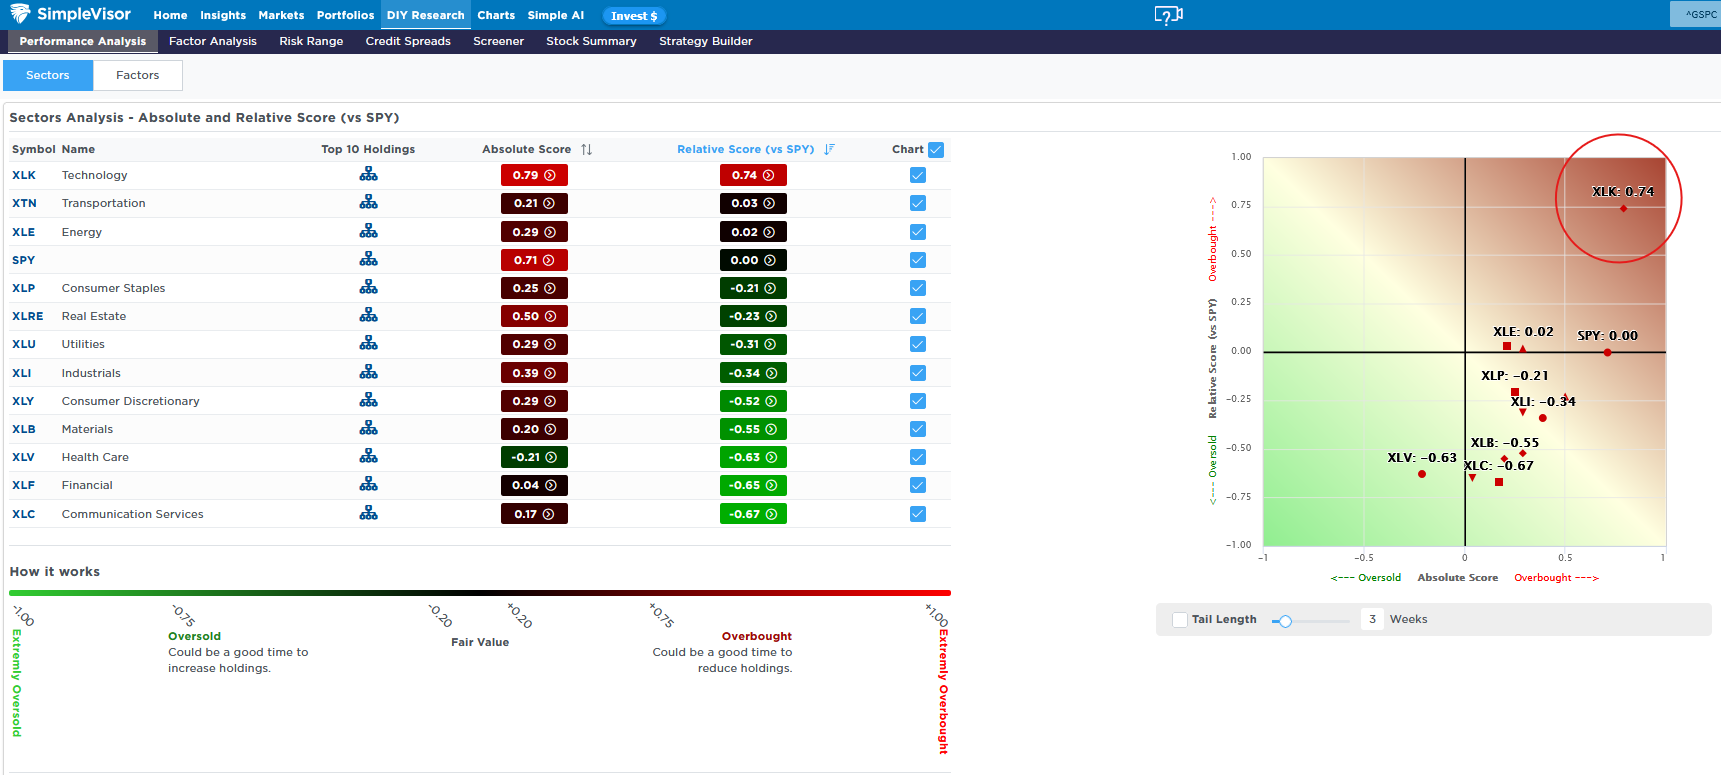
The SimpleVisor absolute-relative analysis continues to indicate poor breadth despite record highs. But is it as bad as it seems?
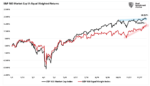
Making a case for bad breadth, the first graph below shows that the technology sector, led by chipmakers, has become very overbought on both a relative and an absolute basis. At the same time, all of the other sectors are either at fair value or oversold relative to the S&P 500. Another sign of poor breadth appears in the factor analysis shown in the second graphic. The large gap between the equal-weighted S&P 500 (RSP) and S&P 500 growth (IVW) indicates that a few companies are outperforming the vast majority of stocks.
Despite the evidence of poor breadth, note that the absolute scores are overbought for all but one sector. The rally is being supported by most stocks, but the chipmakers, specifically those producing CPUs, not GPUs, are leading the way. Without those stocks, the market would still be rallying and potentially near or at record highs. Specific chipmakers, such as Broadcom, Micron, and Intel, have grossly outperformed the market. Going forward, it's quite possible that they correct on a relative basis (underperform) while other technology stocks and sectors drive the market higher.
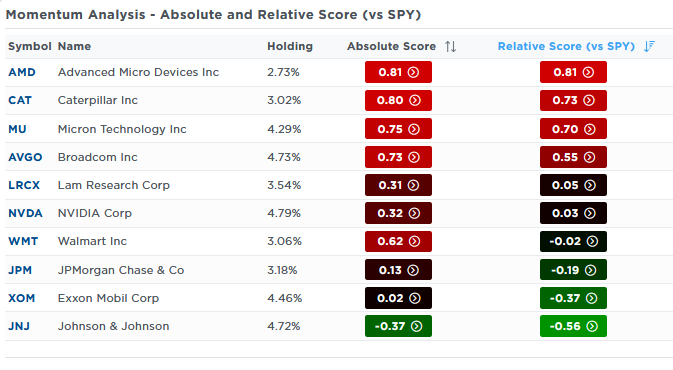
We can see if that thesis occurs via the Momentum factor ETF. The second graphic shows that it is the most overbought factor on both a relative and an absolute basis. The third graphic, breaking down the factor's stocks, shows that outperforming chipmakers, AMD, AVGO, MU, and LRCX, comprise half of the factor's top ten holdings. The SOX semiconductor index, including the big CPU chipmakers, is up 35% over the last 20 trading days. At the same time, the three largest stocks by market cap, MSFT, AAPL, and NVDA, have flat to negative relative scores.

Market Correction Risk: Why Summer Of 2026 Looks Risky
Collapsing breadth. Stretched positioning. The worst seasonal window of the year. The worst year of the political cycle. And a war that won’t end. Market correction risk is stacking up.
The S&P 500 hit a fresh record high last week. The median stock in the index is sitting 13% below its 52-week peak. That divergence is not a footnote or a curiosity. It’s the loudest warning the market has flashed since the dot-com era, and it’s arriving at the worst possible moment on the calendar. Market correction risk is climbing, and this summer it’s stacked on top of three other forces that almost never converge at the same time.
After three decades of watching market cycles play out, I’ve learned that the dangerous moments are those in which everything looks fine on the surface and rotten underneath. That’s exactly where we are right now. The market correction risk we’re staring at into the summer isn’t driven by a single bearish data point. It’s driven by four of them showing up together, and ignoring any of them would be a costly mistake.
Tweet of the Day

“Want to achieve better long-term success in managing your portfolio? Here are our 15-trading rules for managing market risks.”
Please subscribe to the daily commentary to receive these updates every morning before the opening bell.
If you found this blog useful, please send it to someone else, share it on social media, or contact us to set up a meeting.
The post Does The Treasury Hold The Next Market Tailwind? appeared first on RIA.
Full story here Are you the author?You Might Also Like
 Allbirds: Hustling AI To Boost Its Shares
2026-04-17
Allbirds, the sustainable sneaker company, has recently fallen on hard times, with revenue down by more than 50% from its peak. To help right the ship, Allbirds is rebranding itself as NewBird AI. Allbirds closed all of its U.S. stores and sold its intellectual property for $39 million.
2026-03-02
A specter is haunting Wall Street—the specter of the “SaaSpocalypse.” Since the iShares Expanded Tech-Software Sector ETF (IGV) peaked on September 19, 2025, it has fallen roughly 30%. For context, the broad technology indexes like XLK and QQQ are essentially flat over the same period, and the semiconductor ETF (SMH) is up 30%. Between mid-January …
 Nvidia Delivers Perfection But Market Has Concerns
2026-02-27
Yet again, Nvidia delivers another incredible earnings report, reinforcing that the AI investment boom continues. As we show below, they posted annual revenue growth of of 73%, handily beating Wall Street forecasts. Most importantly, strong earnings and robust forward guidance confirm that their customers continue to aggressively expand AI infrastructure. Nvidia delivers the critical computing …
 Rotation Continues As Markets Remain Bullish
2026-01-17
Sector rotation is this weekend’s 2026 Investment Summit. I am presenting at the conference as you are reading this. However, I would be remiss not to share a brief market update as we head into next week. The full newsletter will return next week. That said, U.S. equity markets delivered mixed performance last week. Major …
 2026 Earnings Outlook: Another Year Of Optimism
2026-01-12
The Wall Street consensus forecast for 2026 earnings growth is strong by historical standards. Analysts are giddy and projecting another year of double-digit growth in S&P 500 earnings per share (EPS). FactSet’s most recent data showed an expected 2026 earnings growth rate for the S&P 500 of about 15 percent. That is well above the …
 Minerals, Russia, China & Iran: More On Venezuela
2026-01-07
Yesterday’s Commentary discussed the potential impact of regime change in Venezuela on the energy sector. Today, we extend the analysis and examine other reasons for the invasion. The following theories are based on a Substack commentary from Tracy Shucart, an economist and resources trader. For starters, Tracy makes it clear that oil is not the …
Tags: Featured,newsletter


