| This week the Bureau of Economic Analysis will release updated estimates for Q2 GDP as well as Personal Consumption Expenditures (PCE) and Personal Incomes for July. Accompanying those latter two accounts is the currently preferred inflation standard for the US economy. The PCE Deflator finally hit 2% and in two consecutive months, after revisions, earlier this year. | |
| The inability of consumer prices to maintain that pace is actually related to continuing weakness in the rest of the PCE reports, and therefore spilling out into GDP. Each of these numbers is often individually described as “strong” or “robust”, but together they demonstrate instead quite the opposite condition. If they were actually strong and robust economists would not have become so interested in drug addiction. |
Same Economy Different Continents, Jan 1999 - Jan 2018 |
| What confounds most people is the time component. It doesn’t seem possible that an economy could out of the blue just stop growing, and then remain that way. For ten years Americans have been waiting for recovery from the last “recession”, and for ten years they have been disappointed. It has created this growing rift, institutional mistrust where in the mainstream (however that may be defined) things are always good and yet for too many at the too thick margins of the economy there is no semblance of opportunity.
To the latter, time has been definitive; it’s not coming and never will. For the former, that possibility is just now being recognized, only it has to overcome vast confirmation bias. There is nothing in our history except the Great Depression that suggests ten years (or more) of no growth. Therefore, many people have convinced themselves (economists, policymakers, the media) that it just can’t be possible, or that its end just has to be right over the horizon. |
Missing Modern Money, Dec 1994 - Dec 2006 |
| This error typically has its roots in money. The Fed did QE and QE is always described as money printing, therefore money cannot be the issue. No one ever challenges the right of whoever is rote reciting the formula to show their work. QE is money printing because QE is money printing; trying to rationalize to a self-imposed tautology is not a recipe for success in any discipline. |
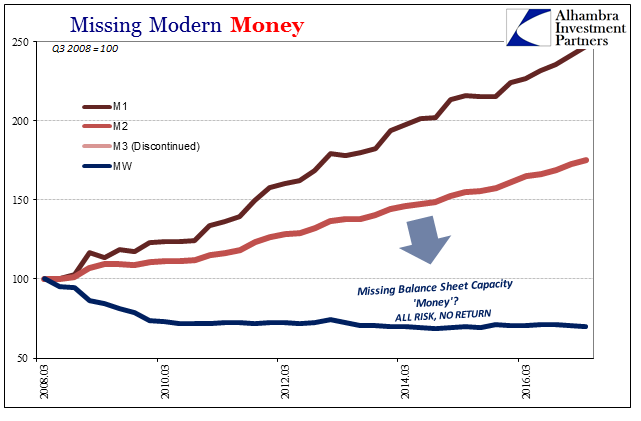
Missing Modern Money, March 2008 - 2016 |
| Yet, we know intuitively that whatever might be wrong started to be wrong ten years ago during an unambiguous monetary event. Even if you think QE is money, the primary output of money through finance hasn’t been the same since that time.
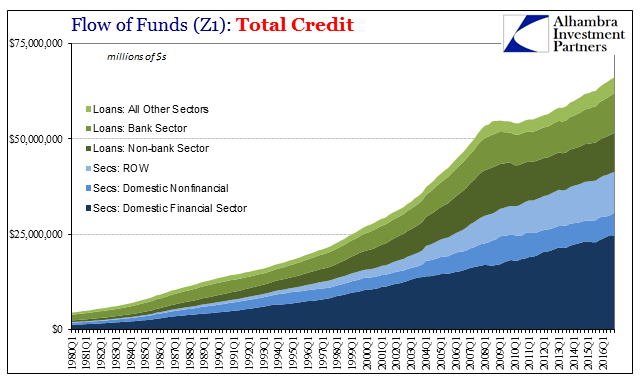
We are speaking about credit. In modern times credit and money are often interchangeable, but strictly speaking debt securities and loans have been the underpinning of economic advance for decades. Starting in 2007, the trajectory of debt and loans changed quite drastically. |
Flow of Funds(Z1): Total Credit, Q1 1980 - 2016 |
| The chart above actually overstates the comeback in US credit. Though the break is clear, parabolic growth giving way to more irregular expansion, a huge part of the increase in US debt-based activity (on the securities side) is nothing more than federal government borrowing. In real economy terms, it is at best an inefficient manner of monetary circulation, and at worst a colossal waste that accomplished next to nothing. |
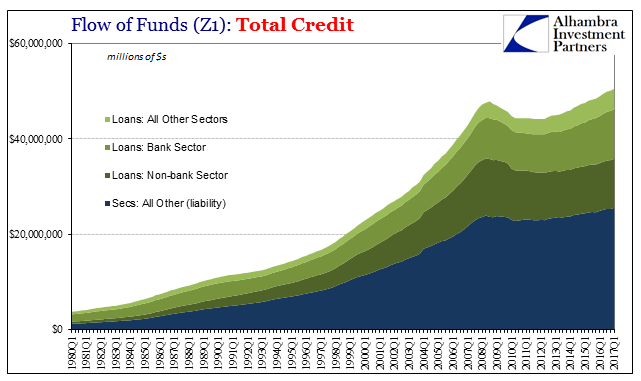
Flow of Funds(Z1): Debt Securities, Q1 1980 - 2017 |
| Taking out the UST’s from the credit market history has the effect of making the lost decade appear that much more lost. As of Q1 2017, the total non-federal government portion of the US credit market added up to $50.5 trillion; in Q3 2008, just before the full panic, it was $47.9 trillion. Like the economy overall, the private credit market is barely more today than when the monetary system really started to break down. |
Flow of Funds(Z1): Total Credit, Q1 1980 - 2017 |
One of the reasons “we” don’t really see it is because we are taught and made to focus inward to the exclusion of everything going on elsewhere. The US economy is a closed system in the orthodox treatment, with only marginal channels, primarily trade, where it is allowed as more complicated. This just isn’t true, but adherence to the idea caused a lot of mistakes in policy and interpretations over the years (especially the last ten).
To Federal Reserve officials in the summer of 2007, they appeared to be a “London phenomenon” and they were, but more importantly they were a dollar problem first. When assessing US conditions, we simply cannot take for granted that what is in London (or Tokyo, Hong Kong, Zurich, etc.) is some overseas matter as they did. The dollar system (really “dollar”) evolved as sort of a hybrid, where the line between domestic “dollars” and offshore “dollars” isn’t easy to find. |
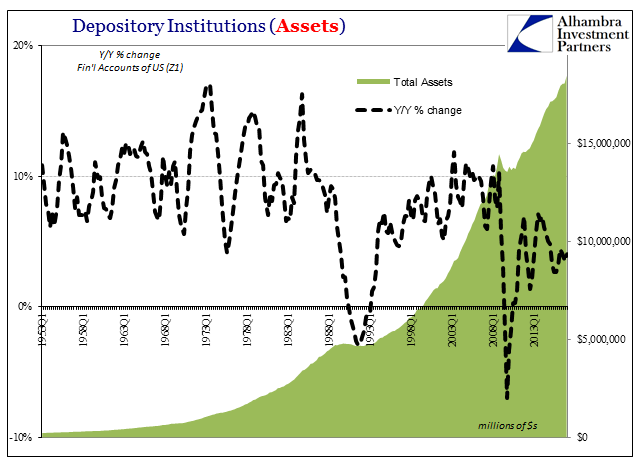
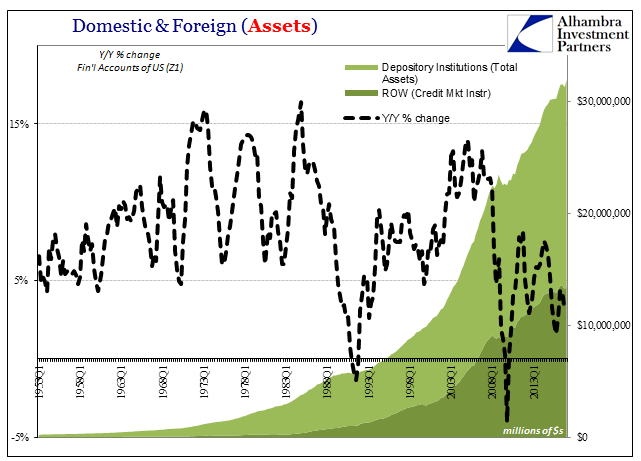
Depository Insitututions (Assets), Q1 1953 - 2013 |
| From a purely domestic perspective, the banking system is growing again and has been since 2010 albeit more slowly. US banks are lending, buying debt securities, and participating in some dealer activities at record levels. But that is not the same as an unbroken trend, nor is it a complete picture of even the US domestic system.
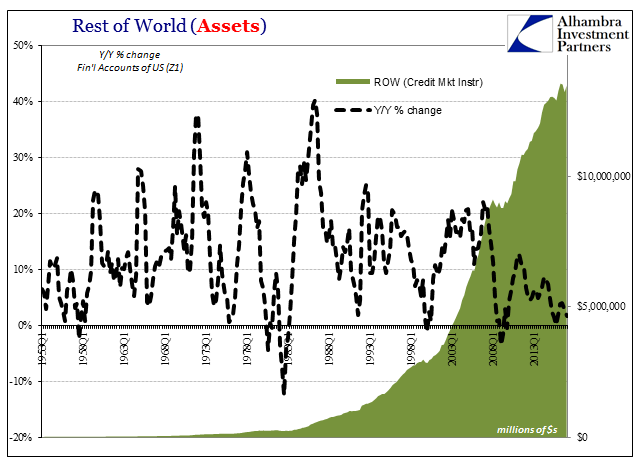
The eurodollar is and has been the free flow of monetary resources across geographic boundaries, constraints that in older days used to be more binding (at least more difficult to traverse). That is what made it the easy replacement for Bretton Woods, having undermined the system from whenever it was in the fifties the eurodollar market began. Thus, if the total of financial assets in all the US banking system was $18.5 trillion in Q1 2017 we should not be surprised if financial credit market assets held by institutions and entities outside the US added up to $13.5 trillion also in Q1. And 45% of that total, $6.1 trillion, is UST’s. |
Rest of World (Assets) , Q1 1953 - 2013 |
| The chart above looks a lot like the one for Depository Institutions if at more of a post-crisis extreme. That’s because the two parts aren’t always two separate parts; they behave similarly if to different degrees because of the vast interconnected nature of eurodollar money.
Since 2007, credit growth from the ROW sector (Rest of World) has further and further decelerated to now come almost to a standstill – and a large portion of that post-crisis growth was until the “rising dollar” in the buying of UST’s (from $2.2 trillion in Q3 2007 to $6.2 trillion in Q2 2014). |
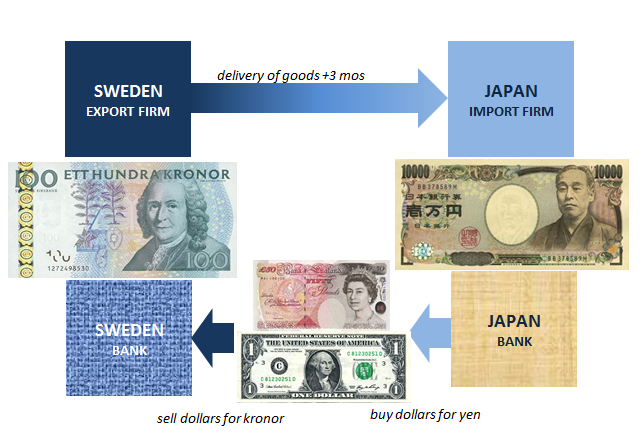
Sweden Export/Japan Import Firms |
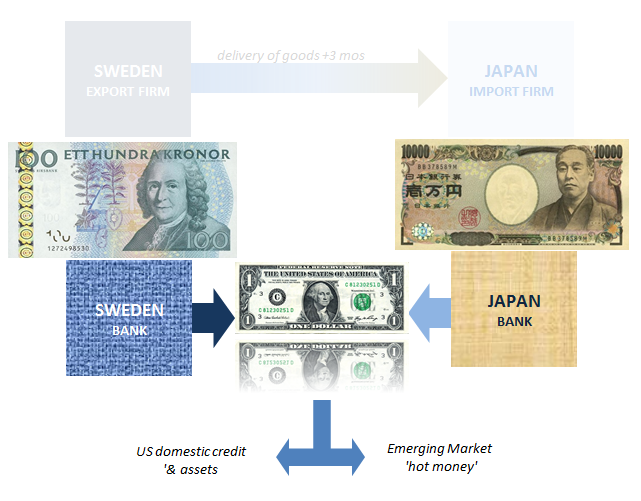
| What changed about the eurodollar system in the 1990’s, what made it a more mature (or insane, depending on your perspective) operation was this inbound approach. Before, eurodollars were far more of a mercantile currency providing global liquidity for international trade, quite a bit of which had nothing whatsoever to do with the United States at any point. Sometime in the nineties, especially after 1995 (RiskMetrics), the eurodollar became more of a complete (and parallel) banking system where banks anywhere else in the world would fund in dollars and then lend them back into the US as some part of the debt bubbles (not only in mortgages). | |
| From that perspective outside the domestic dollar system currency risk is right at the top. It’s not currency risk in the sense of the dollar’s exchange value but rather in the sense of offshore liquidity. Before August 2007, barely anyone paid much attention to liquidity, thus currency risk. A good if not full reason for that was belief that the Fed would and would be able to stand behind the dollar if it ever came to that. |
Sweden bank / Japan bank |
| After August 2007, everyone pays attention to this currency risk all the time; because it has been shown empirically that the Fed cannot stand behind it even when it wishes to (from dollar swaps to QE’s, none of them do much good especially beyond the offshore divide). |
Domestic & Foreign (Assets), Q1 1953 - 2013 |
| The result of too much (relatively speaking) liquidity risk is a domestic credit system that though “achieves” record highs in terms of volume these are new highs in name only (NHINO?). Growth here is below a historical range that stretches back more than sixty years. Things are growing again, but they are not really growing.
This is not merely a banking issue, of course, but the pivot between money and economy. |
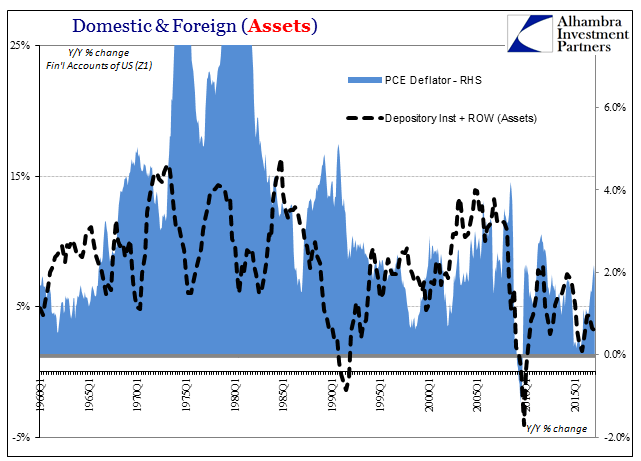
Domestic & Foreign (Assets), Q1 1960-2015 |
| The relationship between credit growth and consumer price inflation isn’t as strong in those early decades, though there is some resemblance and lagged relationship. Redrawing them after 1995, however, and the financialized economy that has prioritized the (international) banking system finds itself following this manner of output quite closely. |
Domestic & Foreign (Assets), Q1 1996-2017 |
In very broad and simple terms, high currency (liquidity) risk = low credit output = low inflation + no recovery. It’s a very different story than the one where QE is money printing. The offshore component is as important, if not more so, than the domestic one.
It is, again, no “London phenomenon” but a monetary deficiency that hasn’t been corrected; instead amplified two more times (2011 & 2015-16) since 2007. It may be that the eurodollar (or “dollar” for all the nuanced definitions of modern balance sheet capacity) is simply unfixable. The longer the US (and global) economy remains connected to the malfunctioning hybrid the more likely for a second lost decade deeply more troubling than the first.
Inflation is not strictly a matter of consumer prices.
Tags: credit,currencies,debt,economy,eurodollar system,Eurodollar University,Federal Reserve,Federal Reserve/Monetary Policy,lending,Markets,Money Supply,newslettersent


