


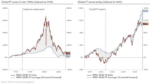
The graph below shows that the US oil rig count has been slightly declining despite much higher oil prices. While many investors may assume that no growth in the number of operating oil rigs implies limited oil production growth, that assumption is not necessarily true. To wit, we share Diamondback Energy’s May 2026 stockholder letter. This note to shareholders describes a strategic pivot they are taking to increase production almost immediately without adding rigs and drilling new wells.
Diamondback’s strategy revolves around its DUC (drilled but uncompleted) well inventory. They have decided to work down its DUC inventories to maintain production at over 520,000 barrels of oil per day, which is 3% above its original 2026 guidance. The rigs already exist and are in place. Thus, the time for completion crews to bring oil to market is much shorter than the time required to drill new wells. To execute, Diamondback plans to run five completion crews consistently through the rest of the year and maintain its current rig count.
Because of our positioning, our preparation, and this price signal, we are bringing incremental barrels to the market immediately.
The bottom line: Diamondback's fast production response can capitalize on high oil prices almost immediately without betting they will remain high for the next 4-6 months, which is how long it takes to see oil being produced from a new rig.

What To Watch Today
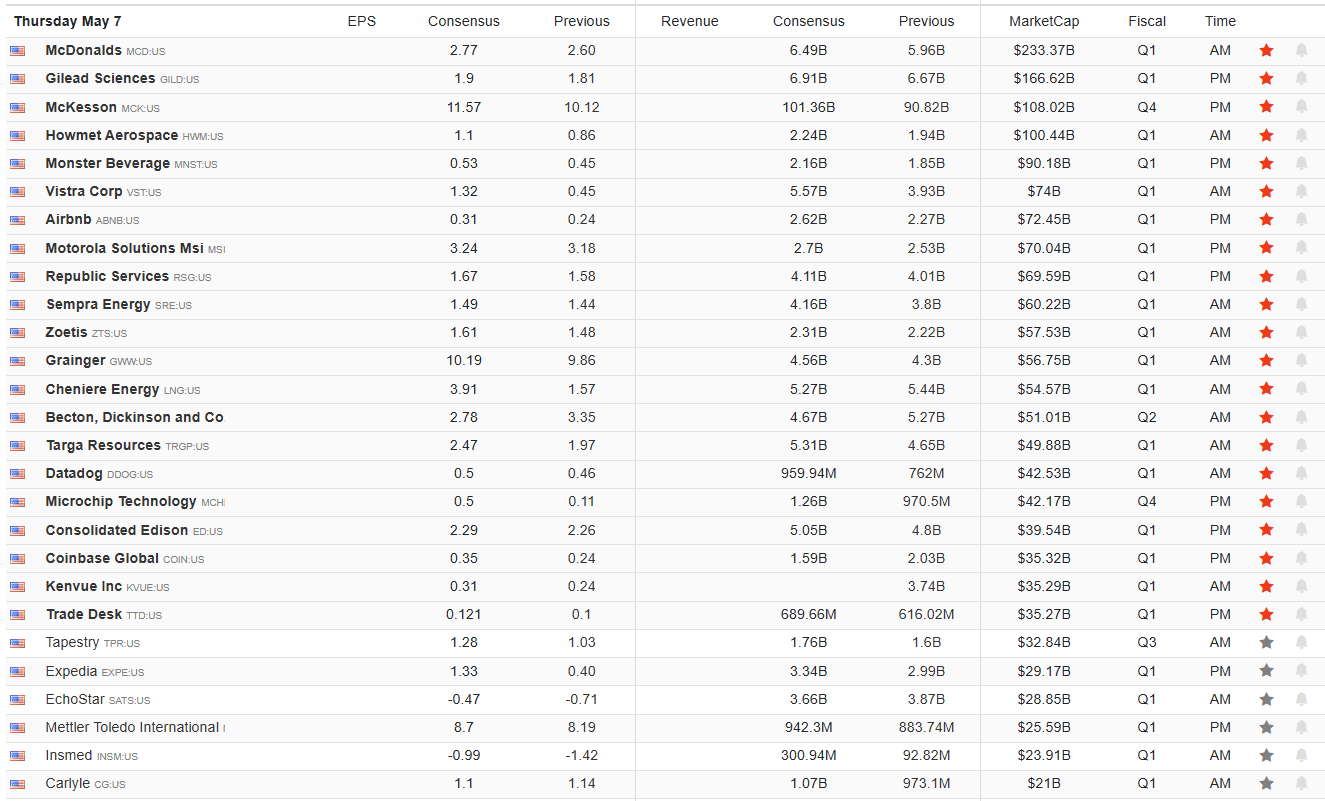
Earnings
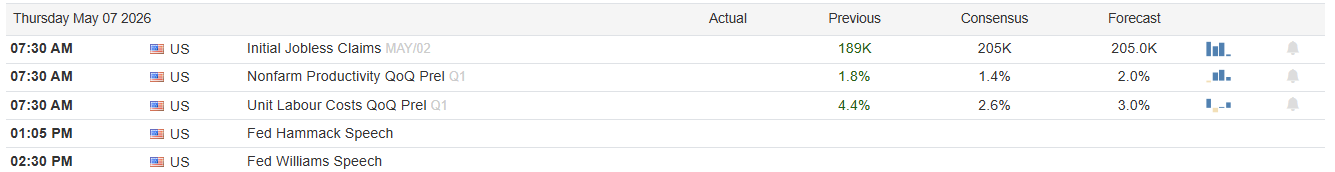
Economy
Market Trading Update
Yesterday, we discussed the sharp upward revisions to earnings estimates that are buoying the stock market against the Iranian crisis backdrop. However, while the market is rallying, the underlying breadth remains a media concern. However, it deserves more analysis.
You have likely seen a lot of commentary discussing how new 52-week lows are climbing in the S&P 500. At the surface, such a reading has pointed to weakness beneath it, historically speaking. Goldman's Ben Snider noted the same from a different angle, leaning into comparisons to the "Dot.com" bubble in 1999. Overall, the chorus has been rising, pointing to narrow breadth, Hindenburg setups, and distribution warnings. While we are certainly paying attention to all of these warning signs, the conclusion may also miss what's actually happening on the tape.
As of midday yesterday, when I wrote this analysis, SPY traded near $732, up roughly 1.1% on the session and sitting at all-time highs. On May 1, the index logged 45 stocks at new 52-week highs against just 13 at new lows. The NYSE printed 578 new highs against 63 lows. By Monday, May 4th, 16 S&P names hit fresh lows even as the broader index held its ground. While that is most definitely a divergence worth noting, it is hardly the kind of internal breakdown that precedes a serious top, and the cumulative advance-decline line on the NYSE just made a new high alongside the index.
Here's where it gets interesting. Look at the actual list. Lululemon. Tractor Supply. Clorox. Brown & Brown. Medtronic. Builders FirstSource. Consumer discretionary is getting squeezed. Staples are cracking, Healthcare is drifting, and Housing-adjacent names are rolling over. What do they all have in common? The consumer. What you don't see is technology, semiconductors, financials, or industrials. The market's actual leadership is intact. The losers are concentrated in a very specific cohort. The cohort with the thinnest pricing power and the most direct exposure to the oil shock, consumer stress, and sticky 3% inflation.

Here's the problem with the dot-com comparison. In 1999, defensives bled as capital abandoned them to chase Cisco, Sun Microsystems, and JDS Uniphase. New lows in staples and healthcare were the tell that risk appetite had gone parabolic. Today, the mechanism is reversed. Defensives are bleeding because oil prices are elevated, 3% inflation remains sticky, and a stubborn dollar mechanically punishes companies that can't pass costs through. That's a margin story driven by macro, not a positioning story driven by mania.

Make no mistake, breadth deterioration matters when it spreads. If the new lows list starts pulling in cyclicals, semis, or banks, I'll be the first one writing the warning piece. We're not there yet. However, we have a sector rotation driven by the Iran conflict's residual oil premium and a Fed that just signaled inflation will remain above target through year-end. That calls for trimming exposure to margin-pressured consumer and staples names. It does not call for selling the index.
We continue to suggest staying long on quality leadership, hedging duration, and keeping a bigger-than-usual cash bucket dry for the day the breadth picture actually cracks. The signal is real. The interpretation circulating on financial Twitter is not.

Ackman's Pershing Square Trades At A Discount
Famed investor Bill Ackman recently brought his private fund, Pershing Square Holdings, to market. Trading under the symbol PSUS, the IPO underperformed Ackman's expectations. PSUS is a closed-end fund, meaning it sells a fixed number of shares in a public offering. Shareholders can exit the fund only by selling their stakes to other investors at the current market price, regardless of the fund's actual asset value.
When you buy or sell a mutual fund, you transact at the fund's NAV. ETFs work similarly, with arbitrageurs ensuring the market price stays close to NAV. Closed-end funds have no such mechanism. They raise a fixed pool of capital in an IPO and trade like a stock from that point forward. The market price can drift from the NAV, and often does. In some cases, closed-end funds can trade at a significant discount to NAV indefinitely.
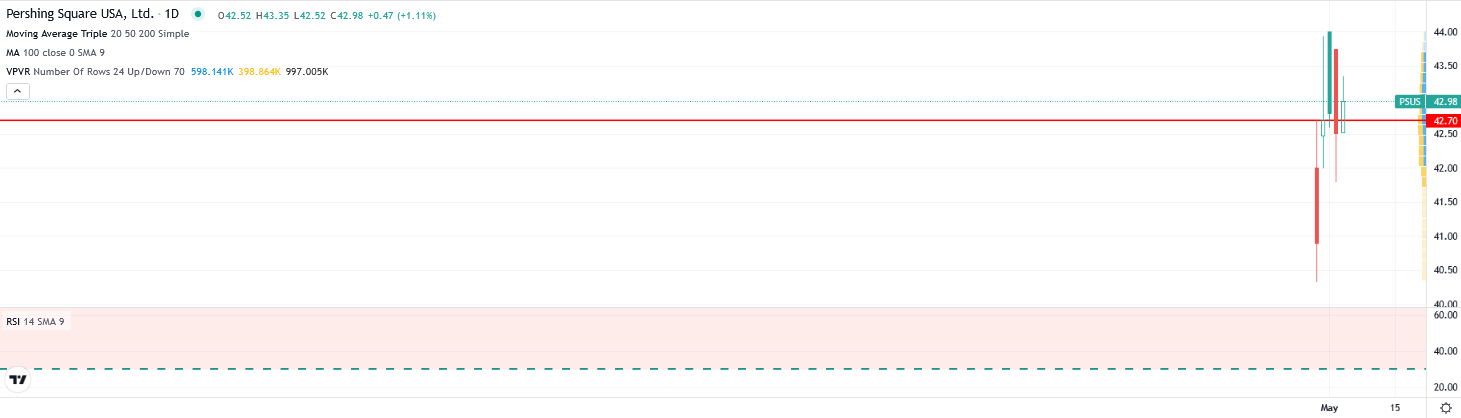
Prior to its IPO, Ackman's PSUS traded around a 30% discount to NAV for years. Simply put, investors could buy $1.00 of Ackman's portfolio for roughly $0.70. At its IPO last week, the discount improved to 16%. Ackman recently said on CNBC that "we look nothing like other closed-end funds," arguing that the quality of the underlying portfolio, the permanent capital structure, and the absence of performance fees distinguish PSUS from typical closed-end funds. The market's response on day one suggests investors aren't fully buying his argument.
The graph below shows that at a current price of $42.98, PSUS trades at 12% discount to its $49 NAV.
Gold Bugs Faulty Thesis: M2 & Inflation
Gold bugs often claim that when more dollars are in circulation, each dollar buys less; prices rise, and gold, as a store of value, helps protect purchasing power from that decline. As a result, they believe that a rising money supply, in and of itself, is inherently inflationary.
The problem with the thesis of gold bugs is two-fold. First, it lacks critical context. Second, it fails to consider another key factor driving inflation: the velocity of money.
A recent note from Michael Oliver of Momentum Structural Analysis drove us to revisit this topic. He explains that the money supply (M2) has grown 45% since 2020. As a result, cash is eroding in real value “year by bloody year,” and that gold remains the essential alternative. It is a compelling narrative. But as we will show, the relationship between money supply growth and inflation is far more nuanced than many gold bugs suggest. Furthermore, having the proper context for M2’s growth is imperative.

Tweet of the Day

“Want to achieve better long-term success in managing your portfolio? Here are our 15-trading rules for managing market risks.”
Please subscribe to the daily commentary to receive these updates every morning before the opening bell.
If you found this blog useful, please send it to someone else, share it on social media, or contact us to set up a meeting.
The post Oil Rig Counts Don’t Tell The Whole Story appeared first on RIA.
Full story here Are you the author?You Might Also Like
 Will Private Credit Cause The Next Financial Crisis?
2026-04-15
Believe it or not, it’s been 18 years since the Global Financial Crisis (GFC). Despite many detailed investigative reports on the events and even the popularity of The Big Short, a box-office hit and bestselling book, the role of subprime mortgages in the near-fatal collapse of the banking system remains a mystery to many investors. …
 Q1 Earnings Season: Buy Or Fade The Rally?
2026-04-11
🔎 At a Glance 🏛️ Market Brief – Stocks Surge On Relief Note: I am traveling home from the UK today, so this week’s missive will be short. Also, I had to write it on Friday before the U.S. markets officially closed. So, any discrepancies will be corrected next week when the full newsletter returns …
 Is A Squeeze In Bonds Coming?
2026-04-06
As sentiment shifts from a Fed rate-cutting forecast to one that now sees a chance of a rate increase, a potentially powerful short squeeze setup might be emerging in the Treasury market. Heading into the Iran conflict, speculative short positions in TLT and Treasury futures were near historically elevated levels, reflecting a broad consensus that …
 Hindenburg Alarm: Another Rotation Or Worse?
2026-02-26
In early November, we sounded the alarm about a recent Hindenburg Omen. Per the Commentary’s summary: Bottom line: market breadth is horrendous and will likely lead to a rotation favoring out-of-favor sectors and stocks. Thus, it’s not surprising that the Hindenburg Omen was triggered. If we continue to see more of these Omens, the threat …
 A No Landing Outcome Is Assumed: Should It Be?
2026-02-19
Quite often, investors describe economic forecasts as a hard landing (recession), a soft landing (weak growth but no recession), or no landing (moderate to strong economic growth). As evidenced by the massive rotation toward economically sensitive sectors like industrials and materials and the significant underperformance of interest-rate-sensitive growth stocks, the no landing, or as it’s …
Tags: Featured,newsletter


