


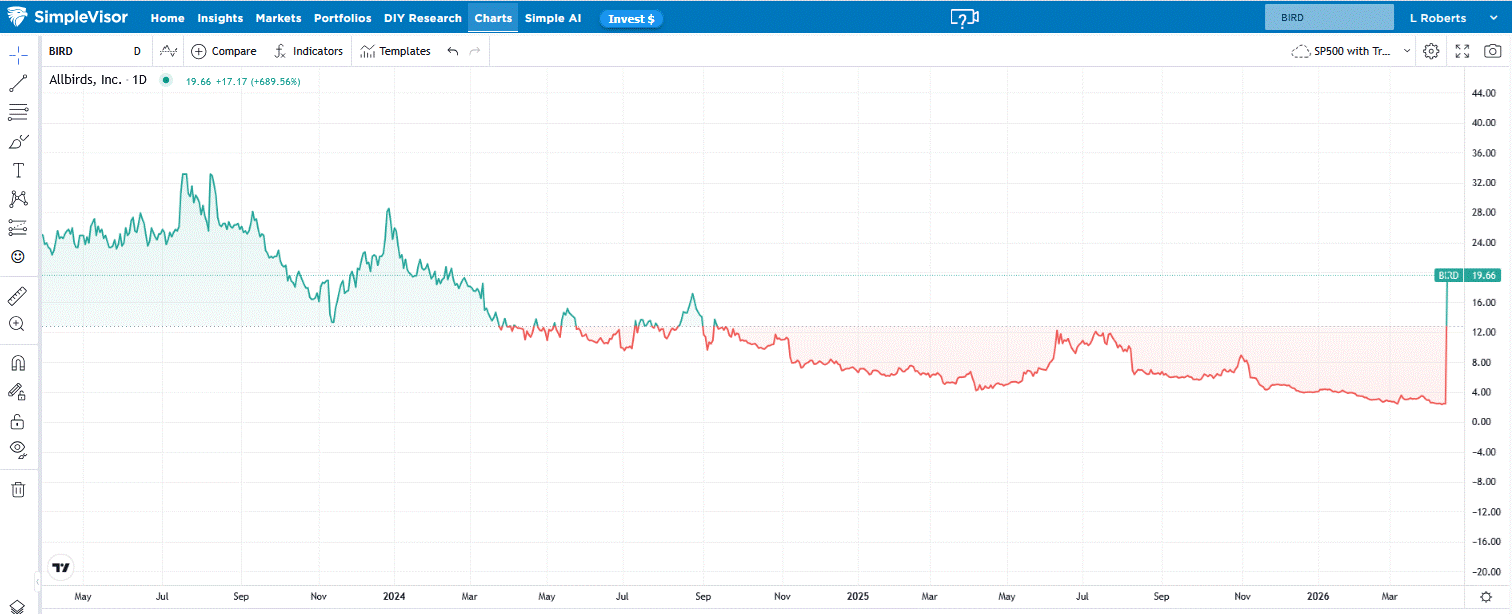
Allbirds, the sustainable sneaker company, has recently fallen on hard times, with revenue down by more than 50% from its peak. To help right the ship, Allbirds is rebranding itself as NewBird AI. Allbirds closed all of its U.S. stores and sold its intellectual property for $39 million. They are also raising $50 million in the effort to morph into an AI computing infrastructure company. It's unclear how $50 million will help them, given that they are going up against companies with trillion-dollar market caps spending hundreds of billions on AI, but its share price, which rose 700% on Wednesday, argues otherwise
In rebranding, Allbirds to NewBird AI, its executives are taking a page straight from the crypto playbook — and before that, the dotcom playbook:
Struggling company - hot narrative - rebrand company – stock price surges.
Remember in 2017 when Long Island Iced Tea became Long Blockchain? The original template was envisioned during the 1998 dotcom boom. For example, Books-A-Million, a regional bookstore chain, announced that it had updated its website, and its stock went from $3 to $47. It did not launch a new business or even pivot to e-commerce. Two weeks later, the stock gave up most of the gains. The underlying business was irrelevant to speculative investors. The words "internet" and “website” drove investors into a frenzy. Today, the word "AI" is magic. It suspends disbelief and sends retail investors into a speculative frenzy despite the lack of evidence that a name change and new direction will materially impact the bottom line.
What To Watch Today
Earnings

Economy
Market Trading Update
Yesterday, we noted the S&P 500 had printed a new all-time high, erasing every point of the Iran-war selloff in just over two weeks, while the Nasdaq extended its winning streak to 11 consecutive sessions, the longest in the index's history. The question now isn't whether the rally was real. It's what historically happens after a move this extreme.
The statistics are hard to ignore. As 3Fourteen Research noted this morning, the S&P 500's 9.8% gain over the last 10 trading days ranks in the 99.7th percentile of all 10-day rolling returns since 1950. Only 20 comparable episodes exist in 76 years of data.

The forward numbers are unambiguously bullish: the average next-12-month return is +19%, with 17 of 20 instances positive. The Nasdaq tells a similar story. Consecutive-session streaks of this magnitude have produced a positive index 12 months later 100% of the time, with an average gain of +26%.

Bottom line: moves this violent to the upside are not tops. They are almost always the early innings of something larger. The mathematical reason is simple. Markets that surge with this kind of force are breaking out of oversold conditions against a backdrop of heavy short interest and defensive positioning. That combination takes time to unwind as underinvested managers chase performance and short books get progressively covered into strength.
That said, a 99.7th-percentile move does not immunize the market against a near-term pullback. History is clear that the path to those +19% and +26% average returns is rarely a straight line. In the 20 prior instances, the majority produced at least one 3-5% drawdown within the subsequent three months before resuming higher. The first pullback off this kind of extreme is usually a buying opportunity, not a topping signal.
The technical picture supports that framing. The 50-DMA never crossed below the 200-DMA during the March selloff. The VIX has collapsed below 20. Breadth is expanding, with the percentage of S&P 500 constituents above their 50-DMA now recovering through 65%. These are not the internals of a market at exhaustion. They are the internals of a market that has just repaired its damage and is starting to trend again.
Near-term, we are watching for the first meaningful dip as the signal to add, not reduce, exposure. A pullback to the 20-DMA would represent roughly a 3% retracement from yesterday's close and align with prior post-breakout consolidations. For now, any retest of prior resistance-turned-support would be an even more attractive entry. We continue to maintain exposure on confirmed strength while keeping stop levels intact beneath the 50-DMA.
The data says don't fade this rally. It also says don't chase it here. Let the market give you the dip, then act.

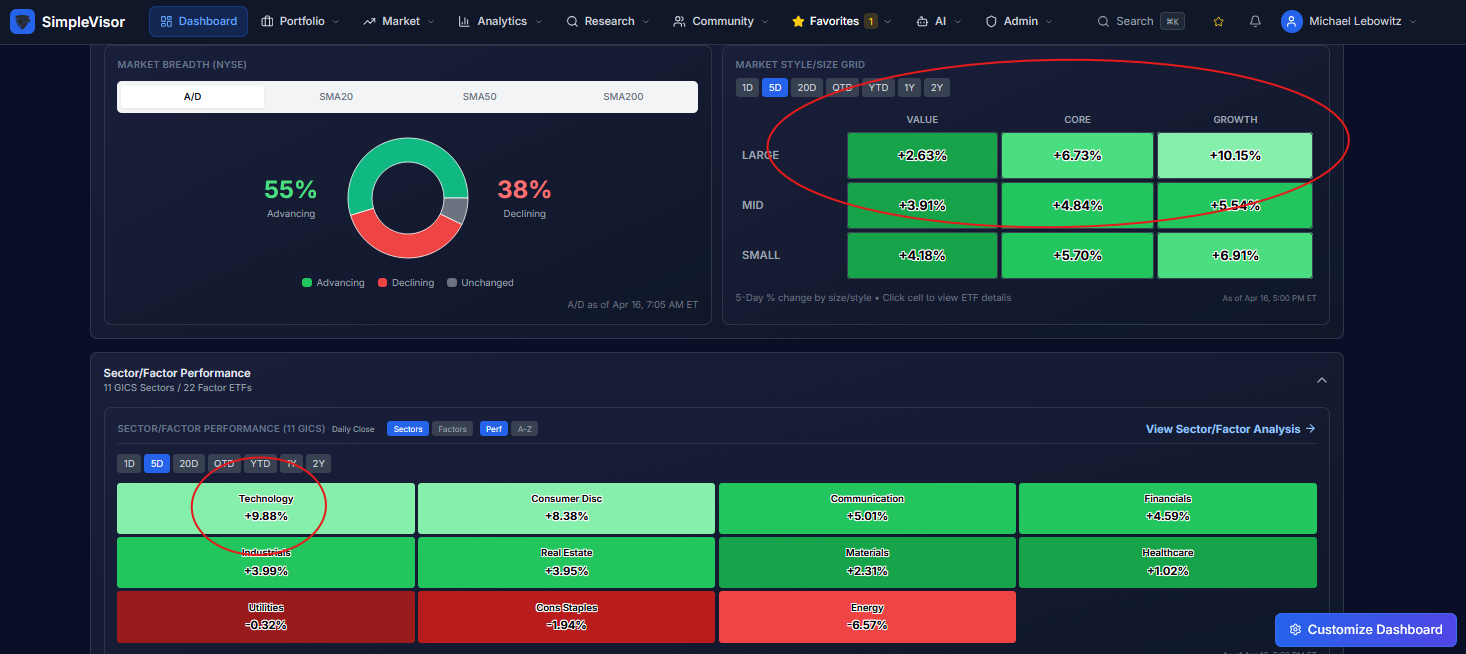
Is Large Cap Growth Back In Vogue?
The first graphic below, from the soon-to-be-released SimpleVisor AI, shows the stark outperformance of large-cap growth stocks over value stocks over the last five days. Further, it shows the technology sector is up nearly 10% over this period, while the former market leaders, staples, and utilities were down, despite the market surge. To help assess whether the value-over-growth trade is dead or just taking a rest, we share some longer-term perspectives in the second graphic.
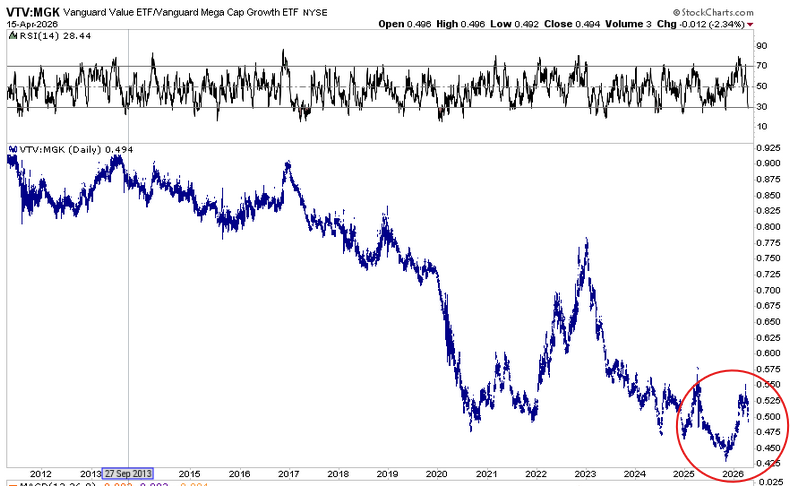
The graph shows the price ratio between the Vanguard large-cap value ETF and the Vanguard mega-cap growth ETF. The trend over the last 15 years has been lower, ie, growth has greatly outperformed value. To the bottom right, we see the nearly 20% outperformance of value over growth, which started in November. The recent outperformance of growth over value has erased about a third of the move. Will the current experience be like the temporary value outperformance during the Liberation Day events, or could it be more sustainable, as we saw in 2022? Before considering our questions, it's worth noting that the real value sector is technology and mega-cap growth, as shown in the third graph.
Poor Breadth
The graphic below, courtesy of Jason Goepfert, shows that when the S&P 500 hits a record high, as it just did, and less than 5% of its stocks are at 52-week highs, the average returns tend to be slightly below average. Moreover, there have been more negative return events when this condition was met than positive. Bear in mind that the bear markets of 1929 and 2000 drag down the results. This raises the question of whether the recent rally is a dead cat bounce with poor breadth or a continuation of the bullish trend existing before the Iranian conflict.

Tweet of the Day

“Want to achieve better long-term success in managing your portfolio? Here are our 15-trading rules for managing market risks.”
Please subscribe to the daily commentary to receive these updates every morning before the opening bell.
If you found this blog useful, please send it to someone else, share it on social media, or contact us to set up a meeting.
The post Allbirds: Hustling AI To Boost Its Shares appeared first on RIA.
Full story here Are you the author?You Might Also Like
 Treasury Bond Yields Don’t Lie: But Wars Don’t Drive Them
2026-03-16
This past weekend, Adam Taggart and I discussed what happens to Treasury bond yields when the United States enters a military conflict. The conventional wisdom is reflexive and tidy. A conflict triggers a flight to safety, money floods into U.S. government bonds, and yields fall. It’s a clean narrative. Unfortunately, it is wrong more than …
 The Passive Aggressive Market: Bogle’s Warning Came True
2026-03-04
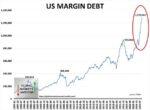
Since the pandemic, the line between passive investing and aggressive speculation has blurred. The current bout of speculative fervor extends beyond financial markets. For instance, we see the same impulse in the explosion of sports betting and the surge in event-betting sites like Kalshi and Polymarket. In the investment arena, margin debt is at record …
 The Energy Sector Is Outpacing Energy Prices
2026-01-29
Over the last year, energy stocks have traded well despite crude oil prices languishing. For instance, over the last six months, XLE, the energy ETF, has risen 14%, while crude oil prices have fallen by 12%. The two largest components of XLE, Exxon and Chevron, which account for 40% of the ETF, are up 30% …
2026-01-26
The year ahead presents both a bullish and bearish case for investors. Will 2026 be another year of above-average returns, or will it be a year of disappointment? The bulls argue that the key ingredients for a sustained rally are in place. A powerful technology cycle, aggressive corporate spending, and supportive policy measures all point …
Tags: Featured,newsletter


