


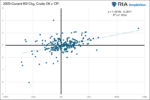
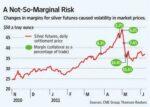
Expected and historical (realized) volatility are sending investors a puzzling signal. Because of the Iran conflict, intense oil price swings, and rising interest rates, the VIX, or implied volatility (what options markets are pricing in as future fear), is elevated. However, actual realized volatility has been much more subdued. That gap between the VIX and realized volatility is wider than historical norms, thus worth examining. The graph below shows the difference between the VIX and realized volatility, measured in standard deviations (Sigma). Currently, the gap is over two sigma’s, a somewhat rare event.
The bearish interpretation is that the VIX is telling the truth and realized volatility is the lie. Options markets are pricing in risks that the equity market has not yet acknowledged. Simply, investors are paying a steep premium for protection against a shock that the market has not priced in. The bearish scenario is the gap closing with realized volatility catching up to implied volatility.
The bullish interpretation is that realized volatility is low because the underlying economy, despite higher oil prices, remains reasonably healthy and corporate earnings are unlikely to be significantly affected. Accordingly, the market is treating the Iranian conflict and surge in oil prices as a temporary disruption rather than a structural shock. Thus, the bullish scenario is that the gap closes not through a realized volatility spike but through a gradual decline in implied volatility as the geopolitical situation stabilizes.
Both interpretations are defensible. When VIX, the market's fear gauge, and actual volatility are telling different stories, paying close attention is warranted.

What To Watch Today
Earnings
- No notable earnings releases
Economy
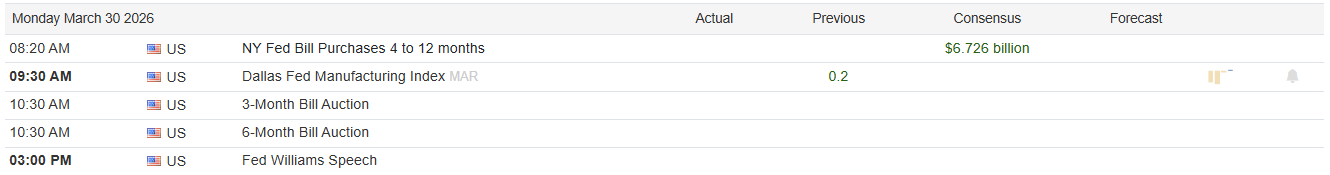
Market Trading Update
The S&P 500 closed Friday at ~6,370, completing a fifth consecutive weekly loss and putting the index 9.0% below January’s all-time high of 7,002, which is on the doorstep of an official correction. As noted above, this past week was a masterclass in false hope.
The technical picture continues to deteriorate across all time frames except the longest. The index is now 4% below its 200-DMA (~6,620), with the 50-DMA, 100-DMA, and 200-DMA all stacked above as resistance. The VIX topped 31, above 30 for the first time since March 2025, a level that historically precedes tactical bounces of 3–8%. The Relative Strength Index (RSI) is firmly oversold, also suggestive of a reflexive bounce. All that is needed in any positive catalyst to spark a buying frenzy.
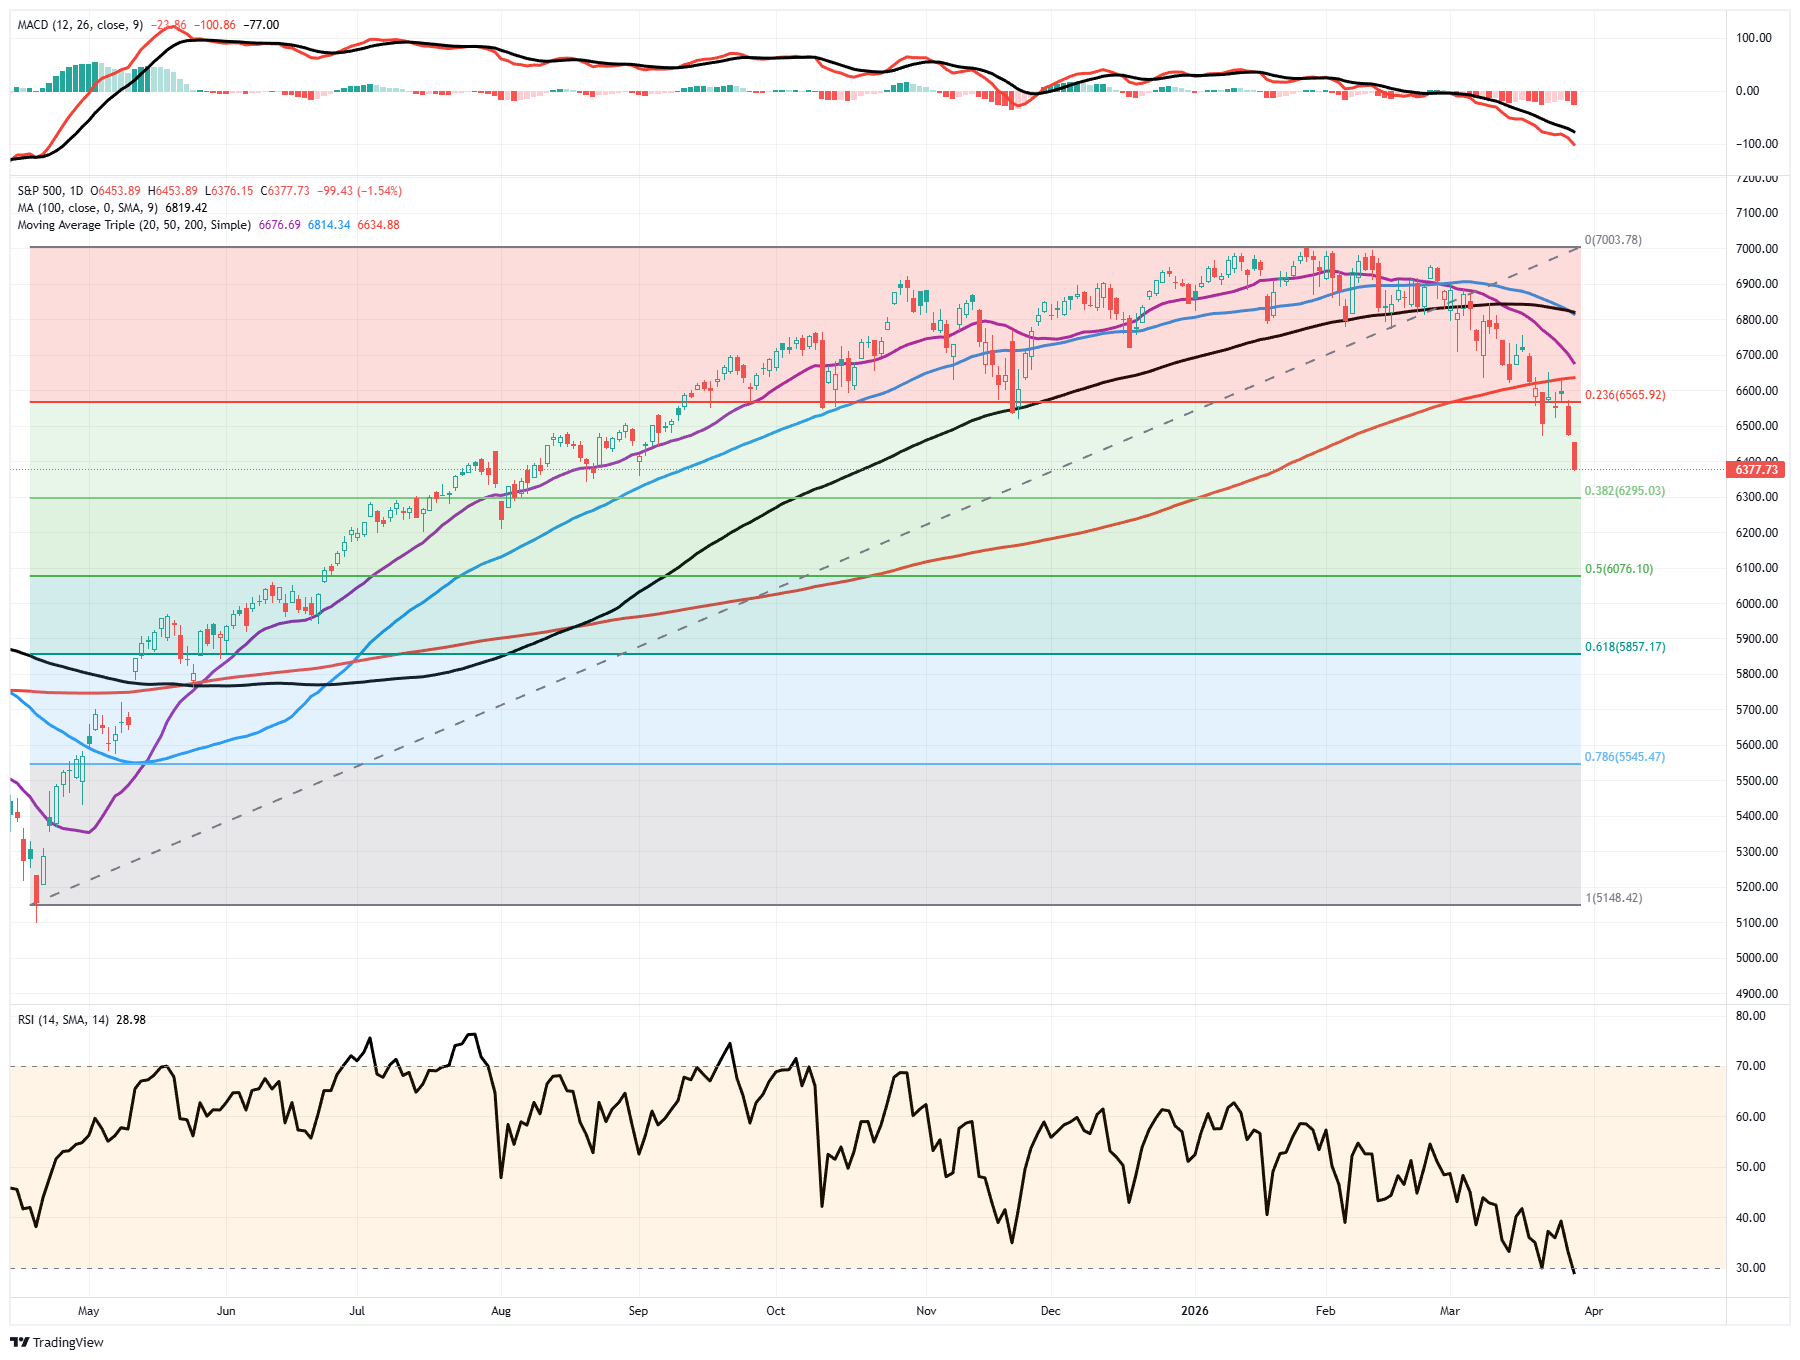
Notably, the MACD remains deeply negative, and every rally attempt this month has been sold within 48 hours. J.P. Morgan captured the paradox: the S&P 500 is down only ~9% despite oil rising 70% and the Fed shifting from pricing two cuts to a 50% probability of a hike, and software falling 20%. As we noted recently, a much larger correction is underway in the market.

Bottom line: We are one bad week from an official 10% correction. The 200-DMA break data we reviewed two weeks ago suggested a 10–15% further drawdown before a durable bottom, and we’re tracking right through that range. Wells Fargo’s worst-case scenario of 6,000 is no longer abstract. With the VIX above 30 and the RSI in oversold territory, the market is building conditions for a tradeable bounce. The emphasis on tradeable, not durable.
Use rallies to reduce risk and rebalance exposures for now. However, start building the shopping list, so you're ready when the market bottom becomes clearer. Consider accumulating quality companies at pre-defined levels (6,300, then 6,000–6,100). At the moment, we don't have the signs of a durable bottom. Oil needs to find a ceiling, and the VIX needs to reverse below 20.
For now, it remains defense over offense. Trade accordingly.


The Week Ahead
Despite the market closure for the Good Friday holiday, the BLS will release its employment report on Friday morning. After reporting a loss of 92k jobs last month, a rebound to +48k is expected. The unemployment rate is expected to tick up by 0.1% to 4.5%. JOLTS on Tuesday and ADP on Wednesday will provide further employment data.
The ISM manufacturing and services surveys should provide some information on how the Iranian conflict is impacting business sentiment. Retail sales for February will be released on Wednesday. As we share below, retail sales have been relatively flat since September. Bear in mind, this measure does not strip out inflation; thus, on a real basis, retail sales are declining at a 2-3% annualized rate. As a reminder, personal consumption accounts for roughtly 70% of GDP.

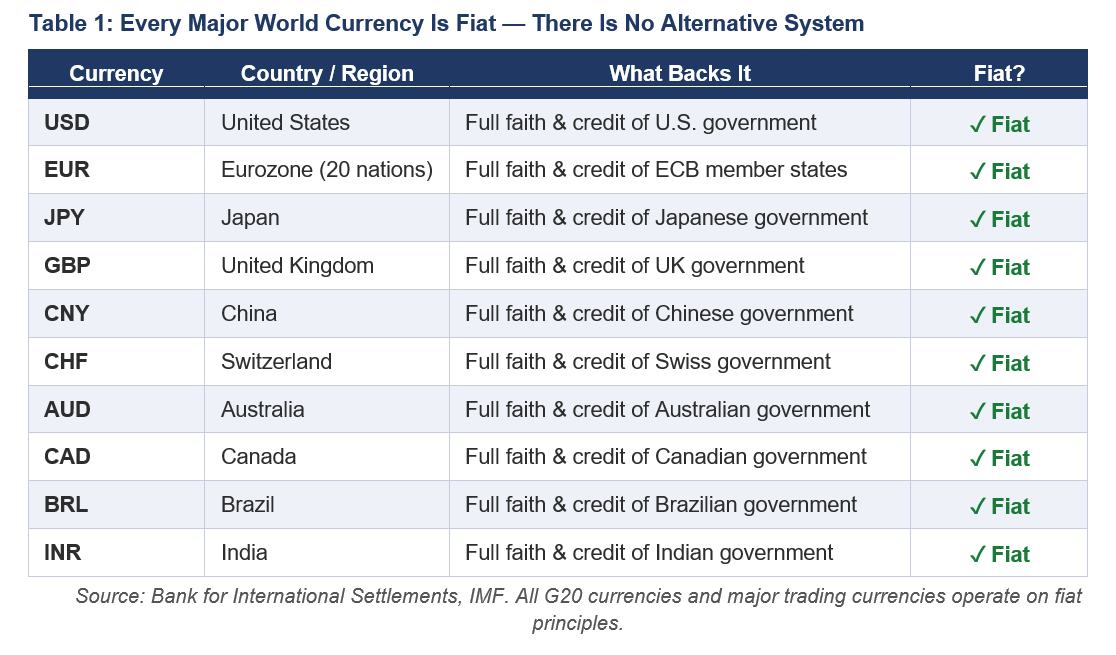
Rubino: Fiat Currencies Are In A Death Spiral
The fiat currency collapse narrative is one of the most emotionally satisfying arguments in all of financial punditry. It feels intellectually rigorous, draws on genuine history, and speaks to deep and legitimate anxieties about government overreach, monetary recklessness, and the long-term consequences of unlimited debt creation. Monetary analyst John Rubino makes the case as well as anyone, warning that the world’s major fiat currencies are entering a “death spiral” driven by insurmountable debt obligations.
But compelling is not the same as correct.
When you stress-test the fiat death spiral thesis against actual evidence, three foundational problems emerge that don’t just weaken the argument; they systematically dismantle it. Let’s work through each one.
Tweet of the Day
“Want to achieve better long-term success in managing your portfolio? Here are our 15-trading rules for managing market risks.”
Please subscribe to the daily commentary to receive these updates every morning before the opening bell.
If you found this blog useful, please send it to someone else, share it on social media, or contact us to set up a meeting.
The post The VIX Is Lying: Or Is It? appeared first on RIA.
Full story here Are you the author?You Might Also Like
 Will Oil Prices Unleash A Wave Of Inflation?
2026-03-06
Bloomberg writes: “Iran War Oil ShockThreatens to Unleash Wave of Global Inflation.” To be fair, the article is not as pessimistic as the title suggests. However, the fear that significantly higher, sustained oil prices will unleash a wave of inflation is gaining popularity and merits discussion. We start with math to address the historical relationship …
 Homesellers Dwarf Homebuyers: Home Prices At Risk
2026-02-25
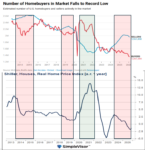
The housing market is experiencing a widening imbalance between homesellers and homebuyers, with listings rising faster than demand. This is contrary to the post-pandemic period of extremely tight inventory and strong demand. Homeowners with ultra-low mortgage rates who were initially hesitant to sell are now increasingly selling. As shown below, the housing market is shifting …
 Are Momentum Strategies Late To The Game?
2026-02-18
Rather than focusing on valuation or fundamentals, momentum strategies use price behavior and relative performance to identify securities that are gaining or losing strength. One would think that, given the massive rotation trade and the resulting gaps in relative performance between various sectors and factors, momentum strategies would be doing well. While some such strategies …
 Stagnation Is Lulling The Fed To Sleep
2026-01-09
The JOLTs data released on Wednesday paint a picture of labor market stagnation. The graph below shows that the number of job openings has fallen to levels similar to those right before the pandemic. While the number of openings seems somewhat stable, layoffs are slowly increasing, while new hires are near a 15-year low. Similarly, …
 Precious Metals Aren’t Predicting Economic Collapse
2026-01-05
In 2025, the prices of precious metals rose sharply, with silver prices recently surging past $80 per ounce. Of course, when precious metals rise, there is always the same group of commentators (mostly paid newsletter writers and physical metal dealers) to declare that a financial breakdown is underway. Articles like those published on ZeroHedge by …
 Nvidia’s Cash Strategy Reflects Regulatory Landscape
2026-01-02
Nvidia’s explosive growth has created a new challenge: how to deploy an unprecedented amount of cash in a world where scale itself has become a regulatory constraint. The chart below, from The Wall Street Journal, illustrates Nvidia’s massive free cash flow growth. However, traditional uses of its cash, such as large acquisitions, are increasingly difficult …
Tags: Featured,newsletter


