Lance Roberts
My articles My offerMy siteAbout meMy videosMy books
Follow on:TwitterSeeking AlphaFacebookAmazon
🔎 At a Glance
- The Business Cycle Narrative & War With Iran
- Market Brief & Technical Review
- From Lance's Desk: Money: The 10 Immutable Laws Of Building Wealth
- Market stats, screens, and risk indicators
🏛️ Market Brief - War With Iran
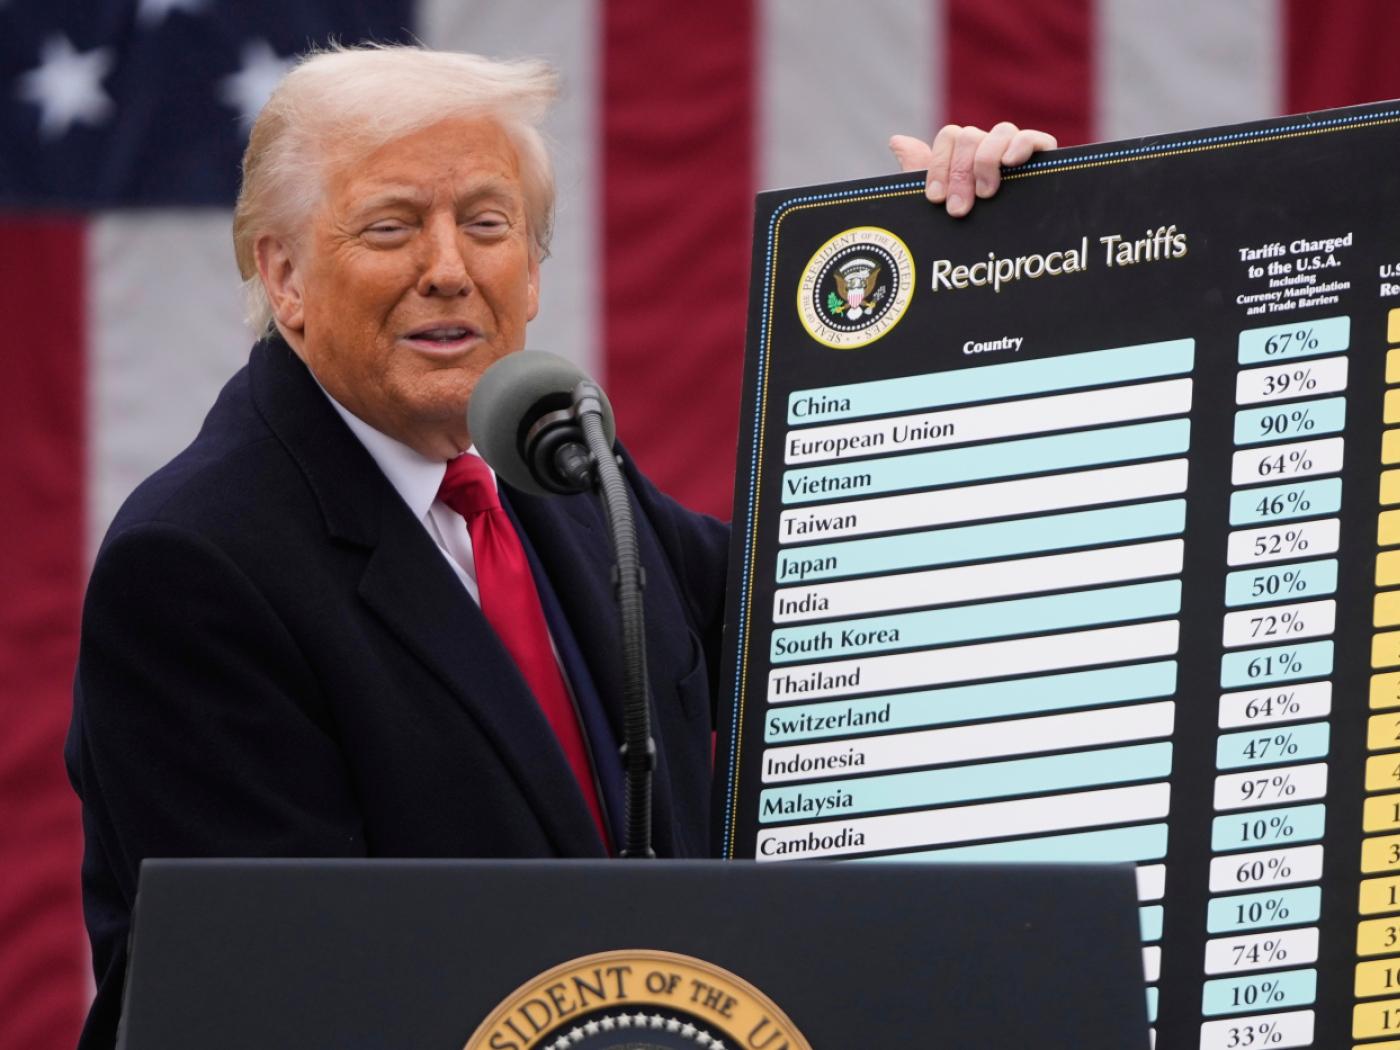
On Friday, the Supreme Court struck down Trump’s signature tariffs. The ruling affects tariffs levied under the International Emergency Economic Powers Act (IEEPA) which includes the so-called reciprocal tariffs at various levels against nations all around the world to address trade imbalances, as well as ones on China, Mexico and Canada ostensibly over flows of fentanyl into the U.S. It doesn’t impact tariffs on products including automobiles, steel, aluminum and copper under a separate authority known as Section 232.
Unsurprisingly, the Administration said it would immediately impose a 10% global tariff under Section 122 of the Trade Act of 1974. As President Trump noted, the Trade Act allows the president to impose tariffs for up to 150 days. During that time, the administration will also investigate using Section 301, which could result in more permanent tariffs. Much uncertainty remains around tariffs, what happens to the tariffs already collected (ie, refunds), and the implications for future trade. We will continue to monitor accordingly.
The other big news this week is rising concerns over Iran. Whenever tensions rise between the US and Iran, the "perpetual purveyors of doom" quickly start posting clips stating that "WWIII is imminent."

Such is unlikely, but let's discuss what is happening and what it means for the markets.
The Iran story the market is pricing right now is less about ideology and more about energy chokepoints and escalation math. In the past two weeks, reporting has centered on a sharper U.S. force posture in the region, including a meaningful buildup of air and naval assets, alongside continued indirect diplomacy and Iranian signaling around the Strait of Hormuz. That mix is why crude has caught a bid: Hormuz is a “single-point-of-failure” for global oil flows, and even temporary disruptions can quickly reprice inflation risk. (However, notice that even with the recent spike, oil prices are still well contained in a downtrend from the previous spike when Russia invaded Ukraine).

However, let's get to the question that investors actually care about: What’s the probability of the U.S. going to war with Iran? From that perspective, the base case remains a combination of coercive pressure (politically) with the possibility of limited strikes. A full-scale invasion remains a very low probability event. The U.S. can credibly execute stand-off strikes against nuclear/missile infrastructure, but a regime-change campaign is a different animal: it would require sustained operations, force protection against proxy retaliation, and an open-ended political end state. That “day after” uncertainty is exactly what recent reporting has highlighted as the central unknown. Russia’s public warning about an “unprecedented escalation” underscores how quickly miscalculation can widen the conflict even if neither side wants a long war.
Furthermore, there are two reasons why the US will want to avoid a prolonged war. First, the U.S. preference set (and public tolerance) tends to favor bounded objectives such as degrading specific capabilities rather than occupation-style commitments. Second, Iran’s most powerful leverage is asymmetric: shipping disruption, missile salvos via proxies, and episodic escalation. Those tools raise costs but also invite punishing retaliation, which historically pushes both sides back toward de-escalation once “deterrence points” are made. Even shipping-risk advisories emphasize distance-from-territorial-waters risk management rather than an assumption of imminent closure.
So, what does that mean for the markets? We have been here before when the US bombed Nuclear facilities in Iran. Then, like now, the "fear mongers" warned it was the beginning of the end. It wasn't. As we discussed then:
The crucial takeaway for investors is that uncertainty creates short-term market volatility. However, a fundamental distinction exists between events that produce short-term market fluctuations and those that modify economic expansion patterns or corporate earnings. Most geopolitical events in most historical situations fall into the first category. The market responds with immediate price movements, but the effects disappear quickly unless the event damages consumer demand, capital expenditures, or earnings potential.
The current situation between the US and Iran likely falls into the first category. That isn’t just speculation. It’s data. The market’s behavior during military conflicts since World War II, including the Cuban Missile Crisis, the first Gulf War, and the Russian invasion of Ukraine, demonstrates a recurring pattern of sharp equity market declines followed by quick recoveries, sometimes within weeks. The market responds to news events by overreacting until investors gain clarity, leading to a market correction.

This is why investors must react logically rather than emotionally to such events.
Which brings us to the market.
📈Technical Backdrop - Technology Gets Tripped Up
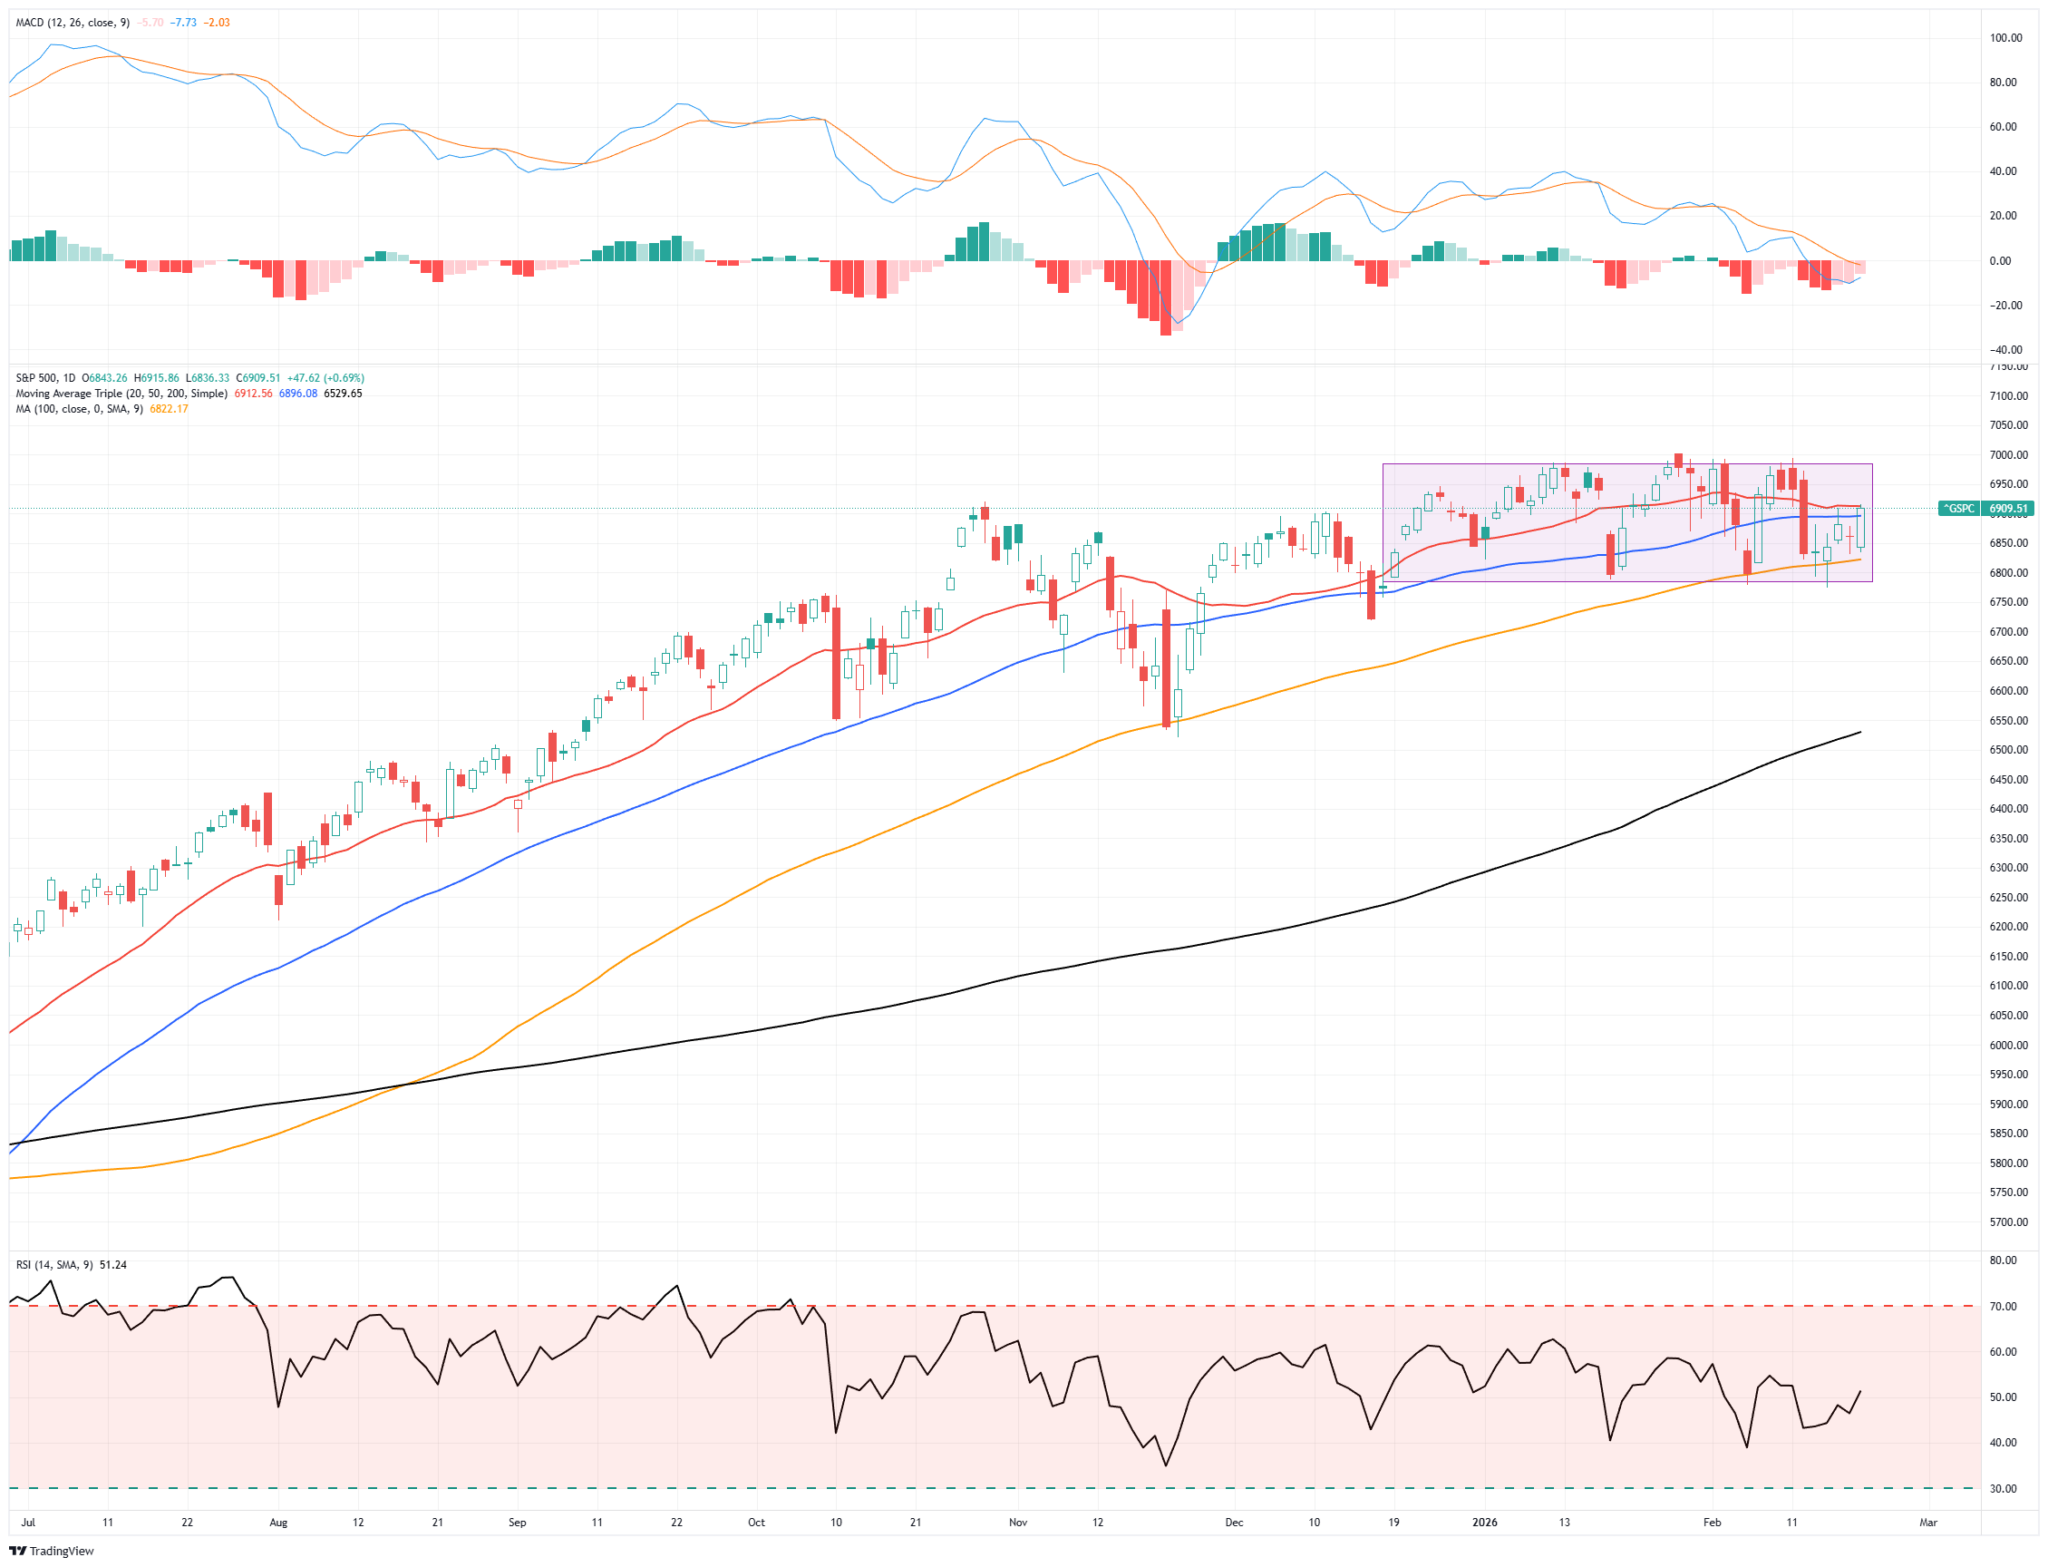
The S&P 500 closed Friday at 6,909, and from a pure trend perspective, the market remains bullish within an ongoing consolidation. Currently, the market is wrestling with overhead resistance defined by the 20- and 50-day moving averages. Notably, every pullback to support levels, the most recent being the 100-day moving average, continues to attract retail buyers. While money flows have improved, which is constructive, the more important issue is whether the market can break out of the recent consolidation to the upside.
Notably, as discussed last Monday, the current "bifurcation" in the market is becoming more pronounced, as shown by the performance gap between the equal-weighted and market-cap-weighted indices. As we discuss in more detail below, those market sectors make up a relatively small portion of the overall index and suggest that their recent outperformance has more than offset the weakness in the Technology sector.

Conversely, technology, finance, communications, and healthcare are either neutral or oversold. That bifurcation between sectors sets the market up for a rather vicious rotation and only needs a catalyst. However, for the broad market index, momentum indicators are also reversing and pushing to levels supportive of a move higher. However, that move higher won't occur until the major market sectors begin to see inflows. Lastly, volatility has been on the rise, which poses a risk of a reflexive setup: systematic strategies have added exposure amid low realized volatility, but even a modest volatility spike could trigger mechanical de-risking.
Bottom line: The bull trend is intact, but the “easy money” phase appears mature. This is a time to rebalance oversized winners, define risk levels, avoid chasing strength, and don't fight the trend, but to protect gains if volatility inevitably returns.
| Level Type | Price Zone | Technical Significance |
|---|---|---|
| Immediate Resistance | 6,950 – 7,000 | Psychological round-number resistance. Repeated failures in this range of previous rallies. |
| Secondary Resistance | 7,100 | First extension target if the market breaks above the current range. |
| Initial Resistance | 6,912 | 20-Day Moving Average (DMA) |
| Intermediate Support | 6,896 | 50-DMA |
| Major Support | 6,750-6,800 | Bottom of the consolidation range. |
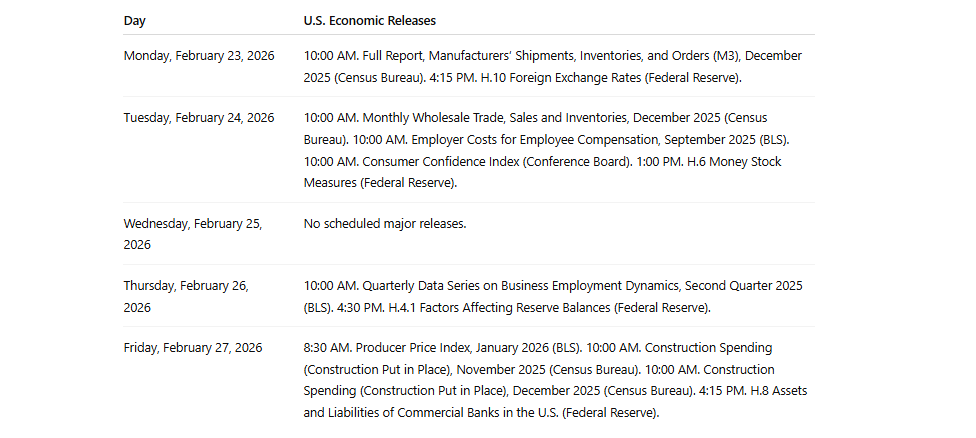
🔑 Key Catalysts Next Week
Traders face two drivers next week. Macro headlines and a dense AI-focused earnings slate. On the macro side, watch Consumer Confidence on Tuesday; a weak print could pressure cyclicals and small caps. A firm print could lift retail, travel, and housing tied names. Tuesday night also brings President Trump’s State of the Union at 9:00 PM ET, where rate, tax, trade, tariff, and energy signals will be the primary focus for the futures market. Furthermore, that speech will either help or hurt the dollar, yields, and sector spreads heading into Wednesday’s open.
Turning to earnings, it will be a busy week that has a higher potential to move markets. Home Depot (HD) reports on Tuesday, focusing on foot traffic, ticket size, and professional demand. For traders, it will be the guidance that sets the tone for the consumer and housing complex. The same focus will be on Lowe’s (LOW) report before the bell on Wednesday.
Wednesday after the close turns into an AI event. Nvidia (NVDA) reports and hosts a 5:00 PM ET call. The markets will be heavily focused on data center revenue, gross margins, supply, and forward commentary, particularly in future capital expenditures and new product initiatives. Salesforce (CRM) will also report after the close. After the beating in SaaS stocks as of late, even a "good" report on AI bookings, seat growth, and margin discipline could lead to a significant share-price pop.
Thursday's after-the-close adds more fuel, as CoreWeave (CRWV) hosts a 5:00 PM ET call that will provide further insight into enterprise capex and AI infrastructure demand.
Need Help With Your Investing Strategy?
Are you looking for comprehensive financial, insurance, and estate planning services? Need a risk-managed portfolio management strategy to grow and protect your savings? Whatever your needs are, we are here to help.

💰 The Business Cycle Narrative
Energy, Materials, and Industrials stocks started 2026 with leadership that looks out of sync with the growth data. Sector performance tells a clear story. Since the start of 2026, Energy, Materials, and Industrials have led the S&P 500 while the broad index has stayed close to flat. We highlighted the divergence last Monday, noting that sector moves relative to the broad market have reached more extreme levels.
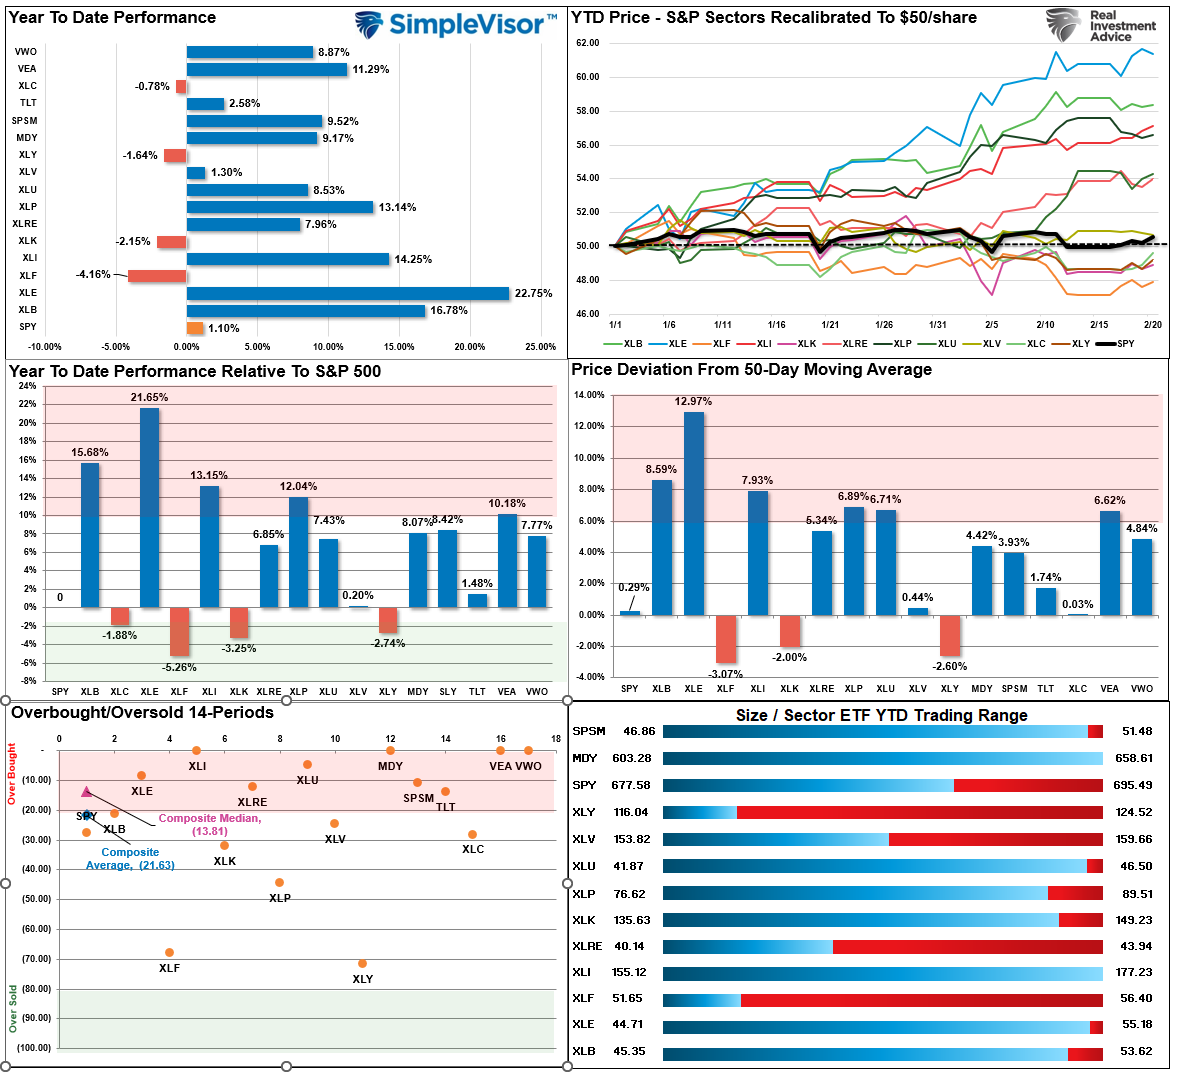
“Despite what seemed like a rough week in the market, it really wasn’t as most sectors and markets, outside of technology, moved into very overbought territory on a short-term basis. Energy, Materials, Industrials, and Staples, or rather “value,” have strongly outperformed every other market and sector this year. These areas are the most overbought, and a rotation back to growth seems increasingly obvious. There are several key takeaways from the analysis below."
- Since the beginning of 2026, Staples (up 15%), Industrials (up 12%), Energy (up 21%), and Materials (up 17%) have vastly outperformed the market as a whole, which is effectively flat YTD.
- The performance differential of those sectors versus the markets, and the deviations from their 50-day moving averages, are at extremes.
- While the overall market has been trading weakly since January, that is only a function of the largest market sectors, by capitalization, underperforming and are now oversold.

The market also sent a second message to investors who have started to pay up for cash flow, dividends, and tangible assets after years of crowding into Mega-cap Technology. Reuters captured the rotation in one line. “Quietly, we’ve seen money move into energy stocks, materials companies, staples, and industrials.” Of course, that rotation came at the expense of Technology stocks.
However, despite the rapid rotation of money within the market, the broad market index remains mostly flat for the year. This is because, as shown below, those market sectors make up a relatively small portion of the overall index: Basic Materials (1.93%), Industrials (8.26%), Energy (3.11%), and Staples (5.76%). In other words, those 4 sectors combined (~19%) are smaller than the Technology sector alone (~29%). In other words, the relative outperformance of those sectors in recent weeks only offset the weakness in the Technology sector.

The key question for investors sits behind the tape: Does the surge in Energy, Materials, and Industrials signal a late-cycle economy? Or does the surge reflect a different driver that sits outside the traditional playbook?
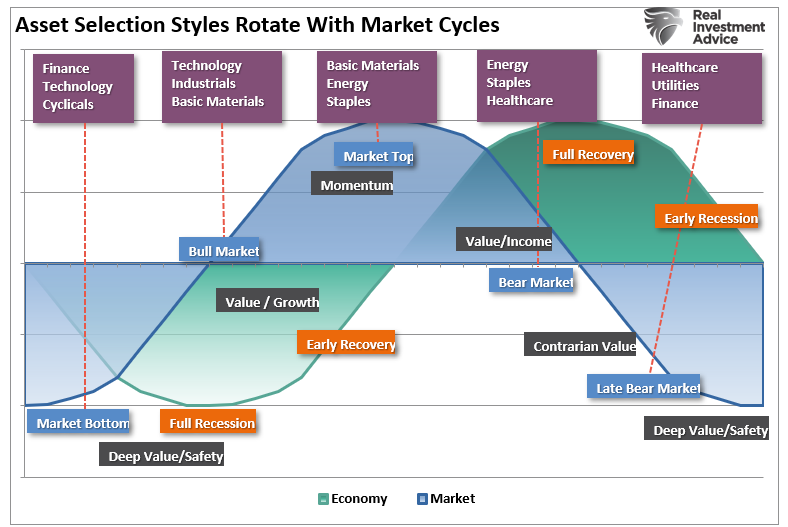
The Traditional Cycle Premise. Early Tech, Late Energy and Materials.
The premise rests on a long history of studying market cycles alongside economic cycles. During early economic expansions, following a recession, lower interest rates and improving demand lift high-beta growth areas of the market, such as Technology. The reason that Technology often leads is that operating leverage rises with increasing sales, and investors are willing to pay higher prices for "long-duration" cash flows as monetary policy is easier.
Conversely, when the economy enters a late-expansion cycle, inflationary pressures rise, spare capacity fades, and pricing power shifts toward commodities, inputs, and capital goods. A peer-reviewed paper in the Financial Planning Association Journal summarized the mapping using long-run data.
“The early cycle sectors are consumer discretionary, financials, and technology. The late cycle sectors are energy, industrials, and materials, which tend to outperform as an economic expansion ages.”
Schwab’s sector framework also aligns with that logic in plain language.
“Industrials often benefit when economic growth raises business confidence.”
That point matters because late-cycle leadership often emerges as management teams begin to approve projects, rebuild inventories, and invest in equipment (ie, capital expenditures). So, the premise holds in the data. Late-cycle leadership often features Energy, Materials, and Industrials, but the harder part involves timing. As shown in the sector versus economic overly, the markets tend to lead the economic cycle as investors anticipate future outcomes.
Of course, markets also rotate for reasons unrelated to the business cycle, which makes the current environment even more difficult to navigate.
The current rotation contains a modern twist. Artificial intelligence spending (CapEx) has pushed demand into grid buildouts, power generation, turbines, switchgear, cooling, metals, chemicals, and construction services. Those capital expenditure levels are enormous.
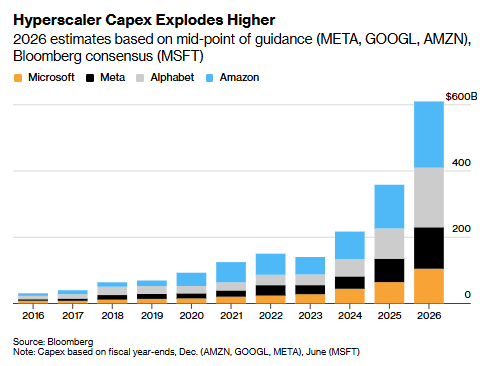
Those expenditures by hyperscalers are the revenue streams for Industrials and Materials, and spill over into Energy through natural gas and liquids. The impact of those expenditures on the business cycle is not small.
As Reuters reported, Siemens' results were a clean case study. CEO Roland Busch said, “Demand for data centres has considerably exceeded our expectations.” Siemens sits in Industrials, yet the driver appears to be Technology demand. The market treats beneficiaries as having business-cycle exposure even when demand stems from a concentrated capital-spending boom.
The Federal Reserve Beige Book commentary also supports the same linkage from a different angle. According to the January 2026 report: “most contacts anticipate that rising data center power demand will boost natural gas demand and support increased drilling activity in the long term.”
It was unsurprising that the latest Manufacturing data also improved marginally, given the semiconductor chip shortage driven by hyperscaler demand. The ISM report showed a return to expansion in January, with the headline PMI at 52.6 and strength across new orders and production. Given that the economy is roughly 70% services and 30% manufacturing, and that services never entered contraction territory, this is why the U.S. avoided a recession. The recent surge in manufacturing will likely be short-lived, but it does support the notion that the economy is growing a bit more strongly.

Add to that the Federal Reserve production data, which reinforced the direction, with January manufacturing output posting the biggest monthly gain in 11 months, and business investment also firmed, with Reuters pointing to an AI-driven boost in core capital goods orders and shipments.
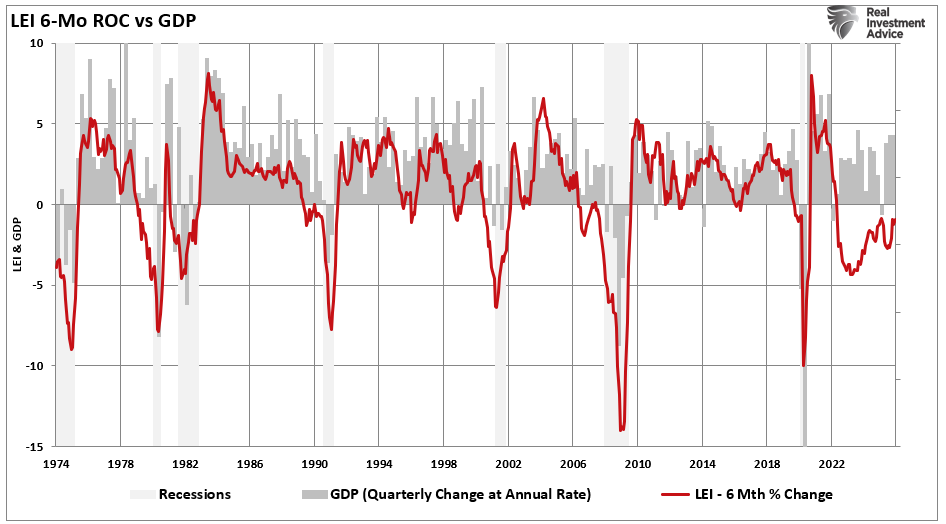
So, yes, those facts certainly support a near-term reacceleration narrative for parts of the industrial economy, which investors have been chasing in recent months. However, the broad leading indicators still warn against complacency.
Is The Late Business Cycle Signal True? Or A Rotation Driven By Valuation and Crowding.
If the late business cycle signal is a warning, it requires more than just sector leadership; it should also show up in leading indicators, earnings revisions, and credit conditions. For example, the Conference Board Leading Economic Indicators still shows a risk of economic slowing. Justyna Zabinska La Monica said,
“Despite real GDP growth hitting 4.4% in Q3 2025, the LEI continues to suggest that the US economy will slow in 2026.”
Employment remains weak after you strip out seasonal adjustments, and credit, particularly consumer-related defaults, are showing signs of late-business-cycle strain.
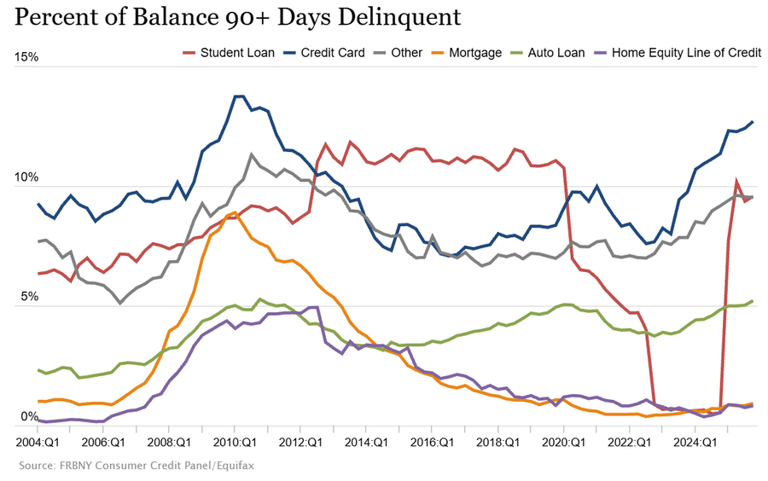
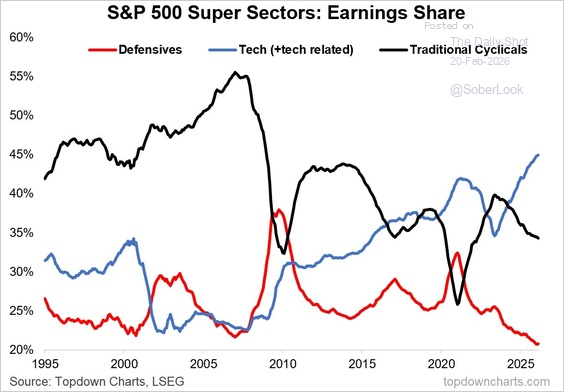
Furthermore, as we discussed last Monday, the market sectors with the greatest outperformance this year are also those with the lowest earnings and revenue growth rates. The chart below shows the share of earnings generated by the three super-sectors: Defensive (Staples), Cyclicals (Materials, Industrials), and Tech (Technology). As noted, investors are piling into sectors where the total share of earnings is declining and selling those that are growing.
So, how do you reconcile the disconnect between the "reflation sector" theme and the market itself? That is a function of market structure. The technology sector became extremely crowded after a multi-year run, pushing valuations to elevated levels, and investor positioning became very one-sided. As we discussed last September, it was only a matter of time before something changed the "narrative," and investors would look for alternatives with lower multiples and stronger near-term cash flows.
Remember last October, when technology stocks came under pressure? The concern was that they weren't spending enough. Now that concern has shifted to the belief that they are spending too much.
With the shift in the current narrative, investors have turned to what are perceived as “cheaper, smaller companies” amid risk aversion in parts of the Technology sector. However, the sectors they are piling into are not actually cheap. Industrials are more expensive than the market, and Energy and Materials are very close to it. Again, these are sectors of the market where earnings and revenue growth rates are substantially lower.

Overall, the business cycle premise remains broadly true relative to history. However, the current business cycle episode also includes a valuation unwind, an AI infrastructure boom that routes Technology demand into Energy, Materials, and Industrials revenue. The question is whether the non-cycle factors can outweigh the late-cycle signals? In that question, Energy, Materials, and Industrials stocks carry six layers of risk.
- First, the macro risk. If growth slows as the LEI suggests, cyclicals face earnings disappointment. A PMI bounce after a weak stretch can sometimes reflect inventory timing, reorder effects, or tariff front-running. ISM itself warned that positive signs were “tempered” by commentary tied to reorder seasonality and tariff-related buying.
- Second, boom-specific risk tied to AI capex. AI spending drives real revenue for beneficiaries, yet concentration risk rises when a small set of buyers sets the marginal demand. If hyperscalers slow spending, then supplier order books reset fast. Reuters also reported lingering doubts on AI returns as investors reassessed massive spending plans.
- Energy adds commodity curve risk. Oil and gas prices swing on geopolitics, OPEC policy, US supply response, and recession risk.
- Materials add China demand risk and dollar risk. Schwab flagged Materials' sensitivity to the global economy and the US dollar.
- Industrials add margin risk through wages, freight, and tariffs. Schwab noted tariffs as a risk to Industrials' profit margins.
- Lastly, there is the risk of investor behavior. Fast sector leadership invites performance chasing. When positioning becomes crowded, as it is now, reversals tend to be violent.
The problem with this entire analysis, as always, is not whether the tide will turn, but only when.
How Investors Should Navigate The Current Market Cycle
Since we never know when market changes will occur, we must return to the basics of portfolio management. For that, we start with our process, rather than predictions or market narratives. Sector rotation works best as risk management, not as a slogan.
- Treat Energy, Materials, and Industrials stocks as cyclical exposure even when the narrative sounds structural. AI infrastructure may last for years. Cyclical drawdowns still happen inside secular trends. Position sizing matters.
- Focus on balance sheet strength and cash return discipline. Energy and Materials firms with low leverage and durable free cash flow withstand commodity drawdowns better than high beta producers. Industrials with pricing power, long cycle backlogs, and service revenue avoid the worst operating leverage outcomes when orders slow.
- Watch leading data, not headlines. Track the Conference Board LEI trend, credit spreads, and earnings revisions. Track ISM new orders and prices paid for inflation pressure. A late-cycle call gains validity when inflation rises, margins compress, and policy tightens into slowing growth. A false signal often shows up as falling commodity prices and weakening orders.
- Avoid binary allocations. A barbell approach fits the current setup. Hold quality exposure across cyclicals benefiting from infrastructure and electrification, and hold defensive, cash-flow resilient exposure for a slowdown scenario. The goal involves surviving both paths.
- Rebalance regularly. When Energy, Materials, and Industrials stocks surge, trim back to target weights. Rebalancing forces discipline and reduces the odds of riding a crowded move into a reversal.
The market message in early 2026 looks less like a clean late-cycle stamp and more like a hybrid. A valuation unwind in crowded Technology, a broadening toward tangible cash flows, and a chase for momentum. The reality is that if the AI infrastructure buildout continues, it will redirect Technology demand to old-economy sectors. Investors who treat the surge as a free pass into cyclical exposure potentially risk learning the wrong lesson. Investors who manage exposure, demand quality, and follow the leading data keep control of outcomes.
Trade accordingly.
🖊️ From Lance’s Desk
This week's #MacroView blog digs into the laws of building money and wealth and the tricks to spend less than you earn.
If you want the E-BOOK version to send to your children, you can download it here.

Also Posted This Week:
- Calm Market Waters Hide Fierce Undercurrents - RIA - by Michael Lebowitz
- Market Sector Review: Extreme Market Bifurcation - RIA - by Lance Roberts
📹 Watch & Listen
A discussion of how the rising risks that the markets are likely due for a more significant pullback in the near future.
Subscribe To Our YouTube Channel To Get Notified Of All Our Videos
📊 Market Statistics & Analysis
Weekly technical overview across key sectors, risk indicators, and market internals

💸 Market & Sector X-Ray: Pullback To Support
Despite what seemed like a rough week in the market, it really wasn't as most sectors and markets, outside of technology, remain in more overbought territory on a short-term basis. Energy, Materials, Industrials, and Staples, or rather "value," have strongly outperformed every other market and sector this year. These areas are the most overbought, and a rotation back to growth seems increasingly obvious.
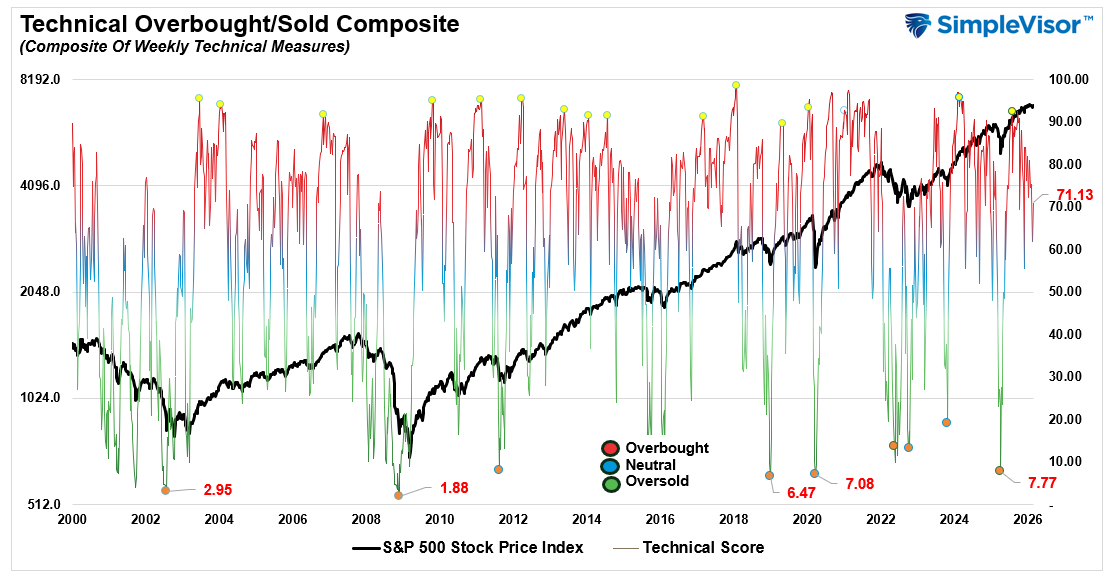
📐 Technical Composite: 71.13 – A Bounce Up, But Deterioration Remains
The overall technical condition remains bullish, but has weakened over the last month as relative strength and momentum have edged lower. While not bearish, some further weakness early next week would be unsurprising as we wrap up February. I suspect we will get a better entry point for a rally as we get into March. However, as noted above, this weakness is very selective and is driven by Technology, Communications, and Financials. The next market rally will likely be driven by a rotation into these areas.
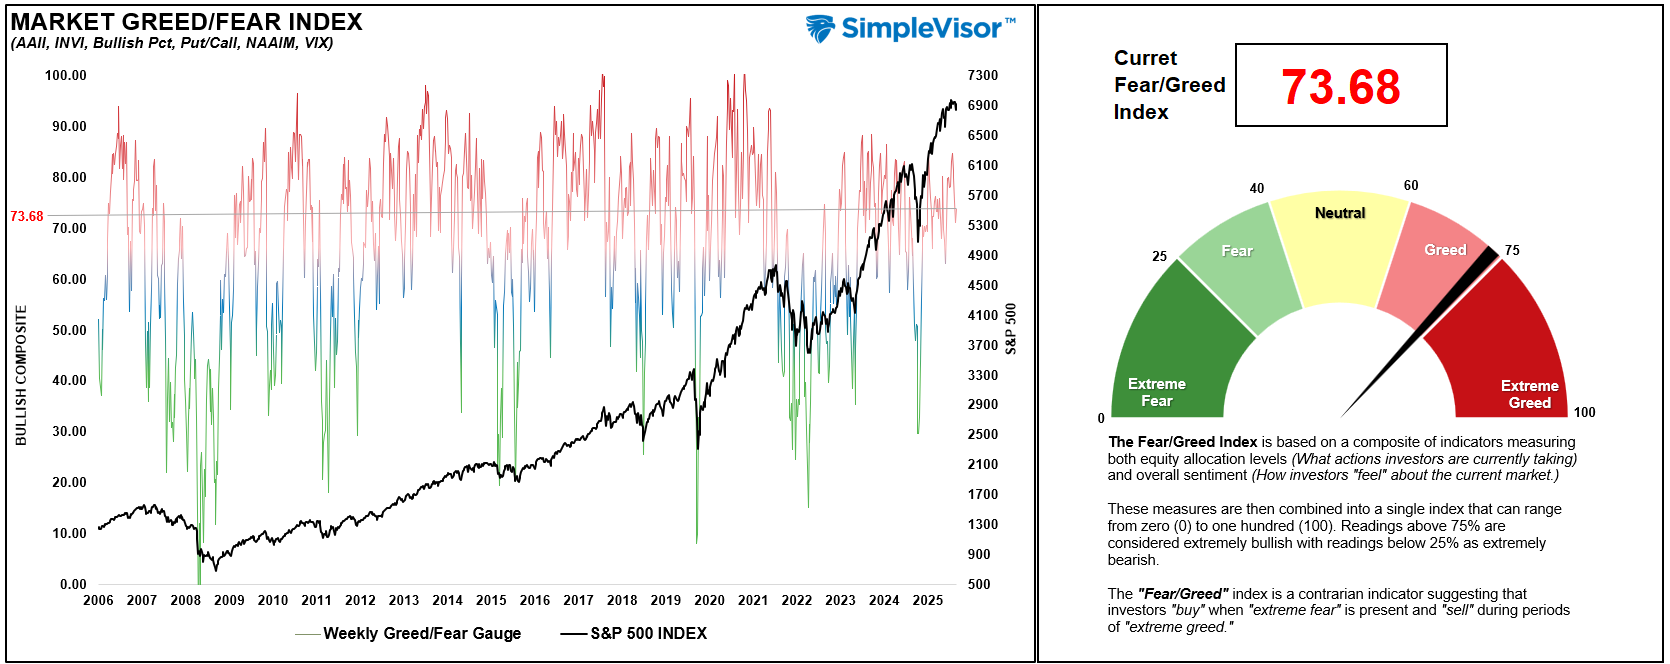
🤑 Fear/Greed Index: 73.68 – Greed Remains (In Certain Sectors)
Positioning in equities remained strong this week, driven by continued strength in Materials, Industrials, Staples, and Energy as noted above. Overall, retail investors continue to remain aggressively invested, while professional managers slightly reduced net exposure this past week. We could see further sloppy trading and one-sided positioning again next week.
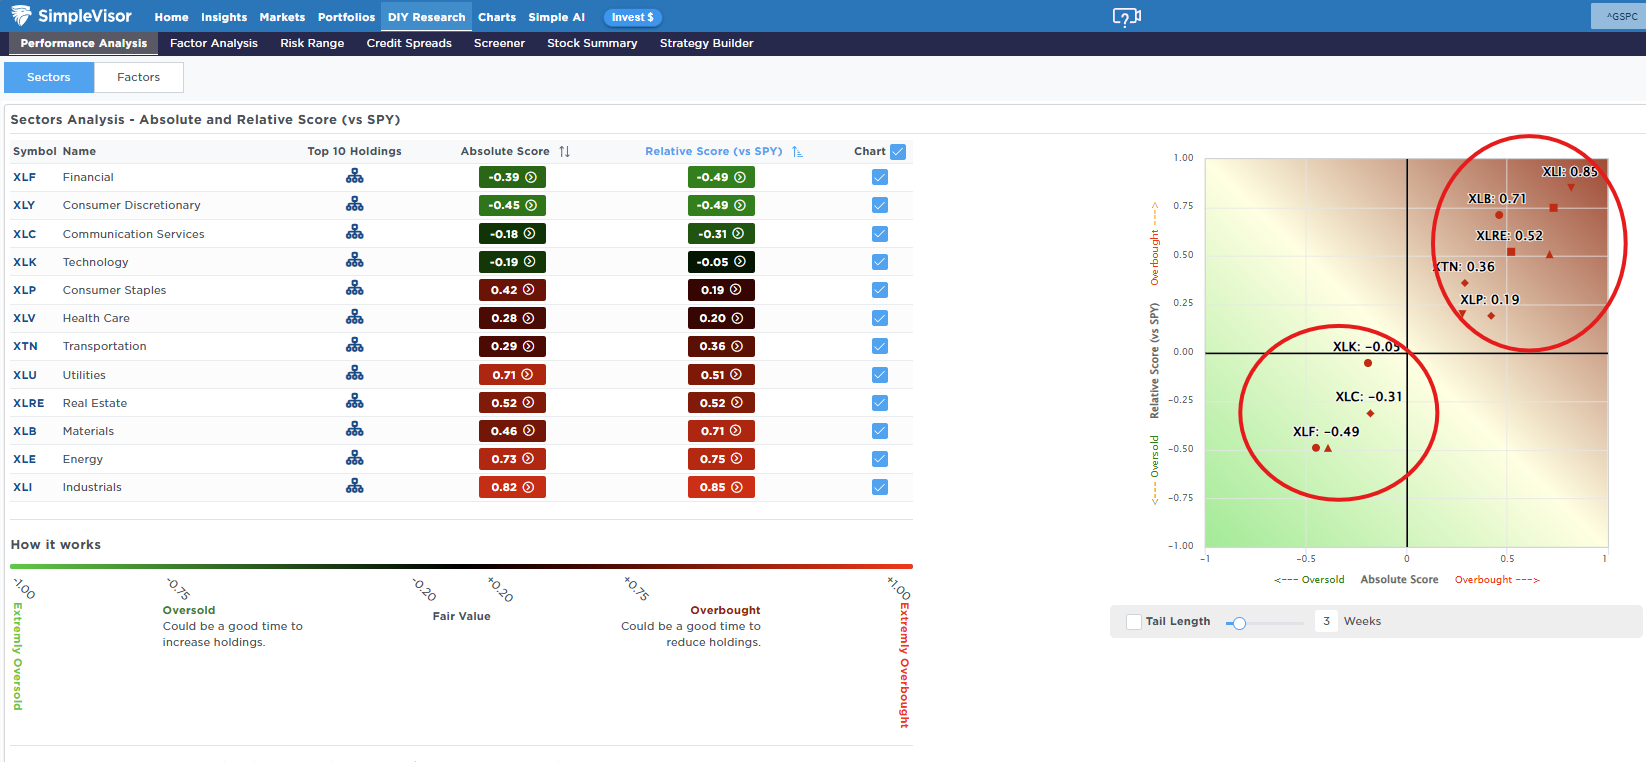
🔁 Relative Sector Performance
As we noted last week, the "bifurcation" in market-sector performance is pretty telling. Financials, Discretionary, Services, and Technology (the largest sectors of the S&P 500) are the most oversold, while Industrials, Energy, Materials, and Real Estate are the most overbought.
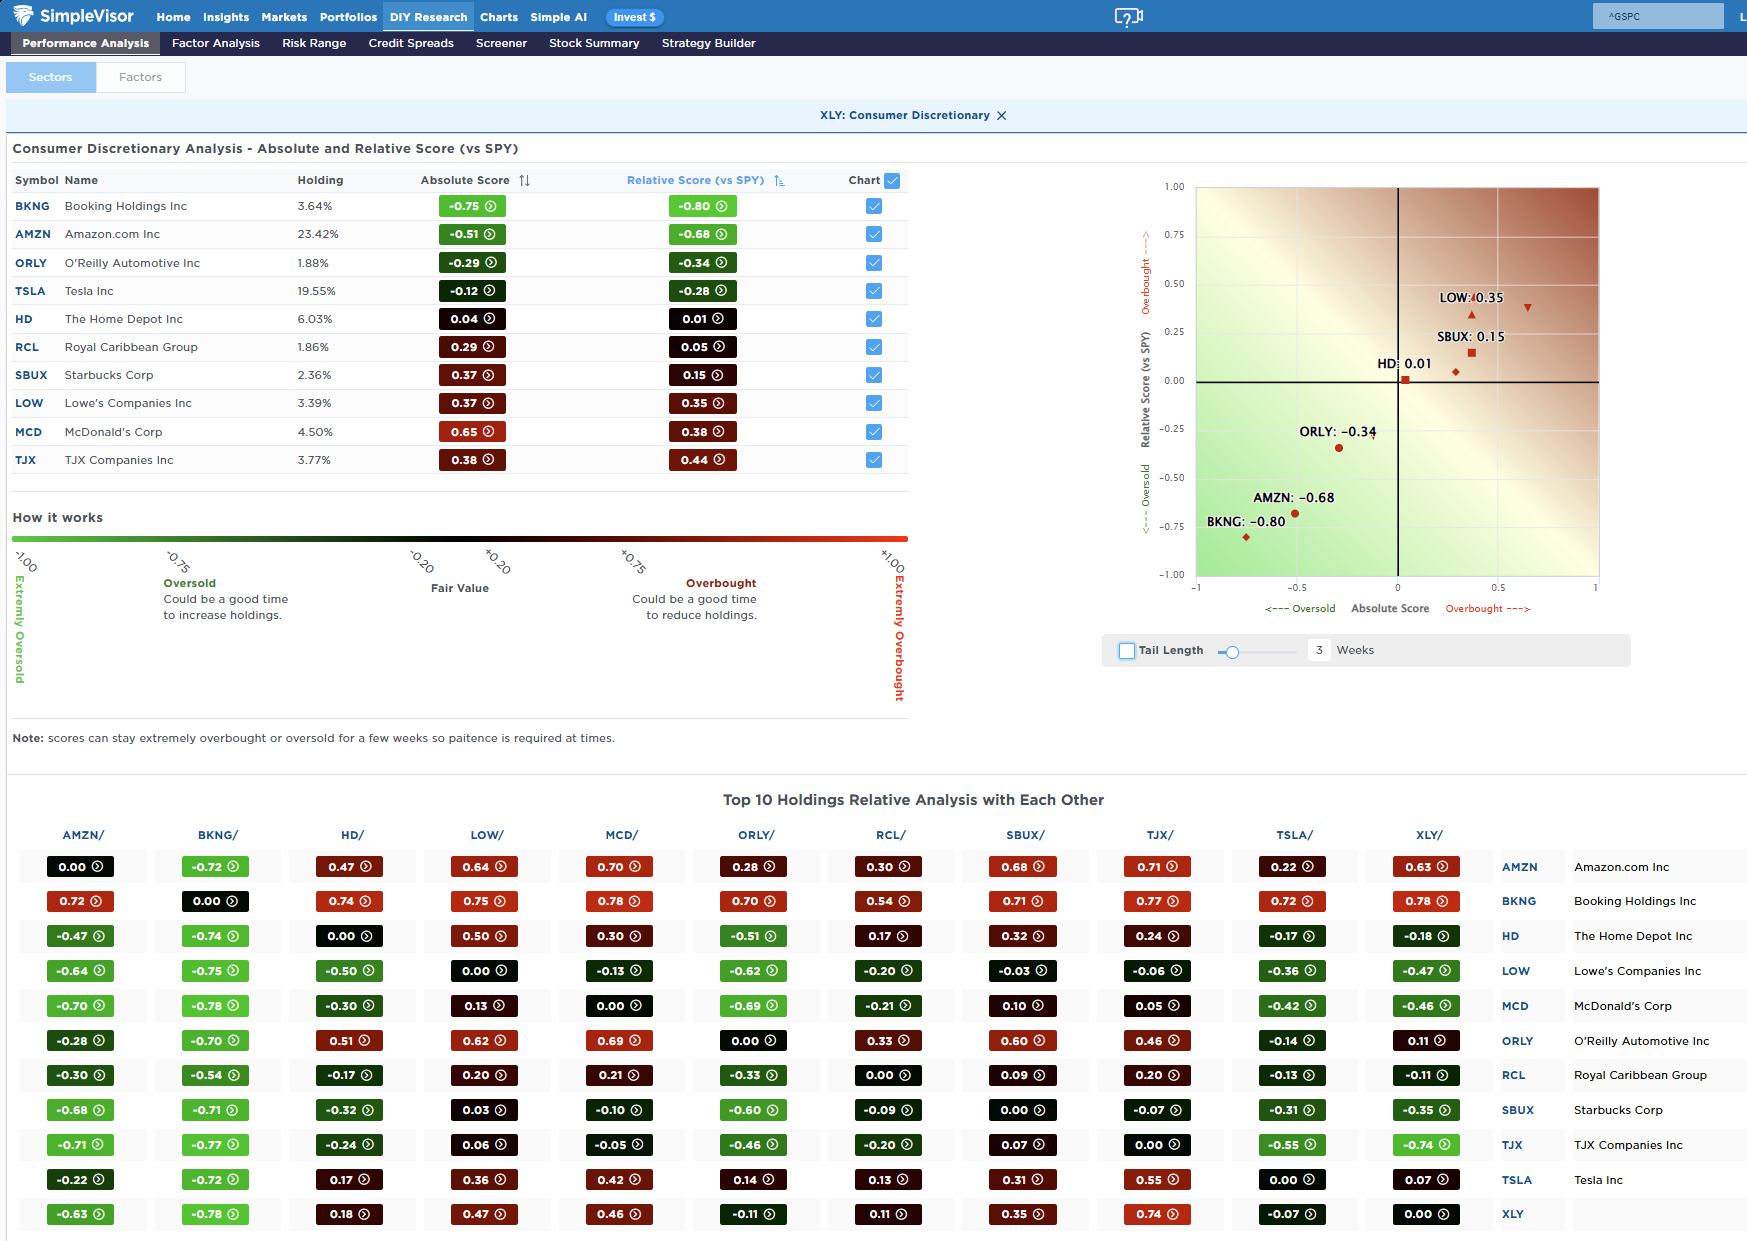
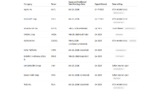
📊 Most Oversold Sector Holdings
While Financials are the most oversold, I wanted to look at Discretionary given the recent selloff in those stocks. The most oversold in the sector are AMZN and BKNG, with TSLA not far behind. Given the weighting of TSLA and AMZN in the S&P 500, any rotation into these companies will lift the entire index.
📊 Sector Model & Risk Ranges
As noted last week, Basic Materials, Industrials, Energy, Transportation, Small-cap, and Gold and Gold Miners are at extreme deviations from their longer-term means. Of course, these extremes can persist for a while; therefore, it is important to maintain exposure while managing risk along the way. These more extreme deviations will eventually correct themselves, so continue to manage risk accordingly.

Have a great week.
Lance Roberts, CIO, RIA Advisors
The post The Business Cycle Narrative & War With Iran appeared first on RIA.
Full story here Are you the author?You Might Also Like
 The South Park Market Of 2026
2026-01-23
I have been a “South Park” fan for as long as I can remember, and while the show isn’t a market guidebook, its brutal satire cuts through nonsense better than many Wall Street commentaries. Just like on the show, characters make absurd decisions and face absurd consequences, which is familiar to investors today. For example, …
 Akademiker Pension Serves The US A Warning
2026-01-22
A Danish pension fund, Akademiker Pension, which manages roughly $25 billion in retirement assets for teachers, announced that it plans to sell all of its U.S. Treasury holdings by the end of January.
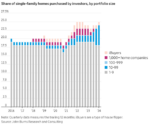 Fannie And Freddie To The Rescue
2026-01-12
President Trump is using Fannie Mae and Freddie Mac to help make housing more affordable. According to a TruthSocial post, the President claims Fannie and Freddie have a combined $200 billion in cash. Accordingly: I am instructing my Representatives (Fannie and Freddie) to buy $200 billion dollars In mortgage bonds. The hope is that increased …
 Black Friday Sales Results
2025-12-03
Based solely on Black Friday sales data, the holiday shopping season may be decent despite poor consumer sentiment. According to Adobe Analytics, which draws data from over one trillion retail site visits, Black Friday online sales hit a record $11.8 billion, up 9.1% from last year. Per MasterCard’s SpendingPulse, retail sales, including online and in-store …
 Ray Dalio Says Sell: But Not Yet
2025-11-25
Ray Dalio is considered by many investment professionals to be a market maven. This is because of the wild success of his hedge fund, Bridgewater, with assets under management of $136 billion, as well as several best-selling economics/finance books he has written. In recent times, Ray Dalio has repeatedly emphasized that markets are in a …
Tags: Featured,newsletter