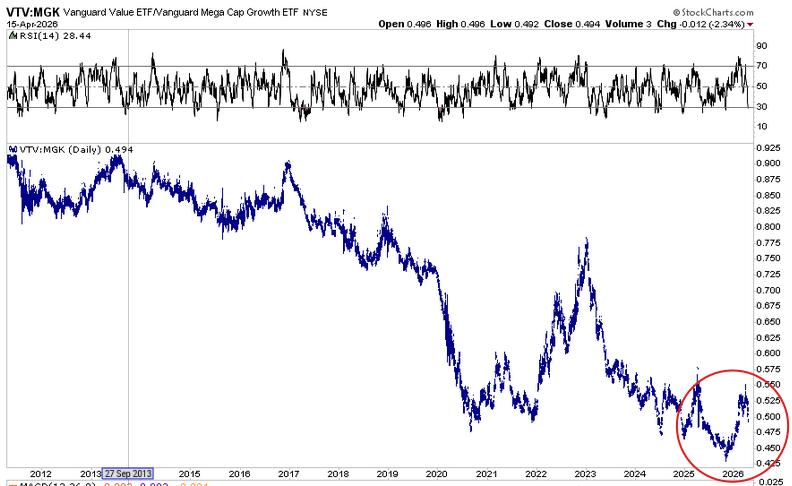
“Value is back in vogue”, the media claim. Investors are rushing out of the high-flying mega-cap tech stocks and into the boring staples, utilities, and healthcare stocks. Given the huge outperformance of value stocks versus growth stocks, it appears investors are going all in on the value rotation. What some of these investors don’t know is that they are not necessarily buying value but could, in fact, be selling it.
Before turning your investment perspective upside down, let’s define how most investors think about value and growth stocks. Commonly, investors refer to value stocks as those whose shares trade at a low price relative to their earnings and earnings potential. Growth stocks are those whose earnings are expected to grow faster than the market average.
For some reason, investors often assume that growth and value are mutually exclusive. They are not, as we will explain.
Valuation Heat Maps
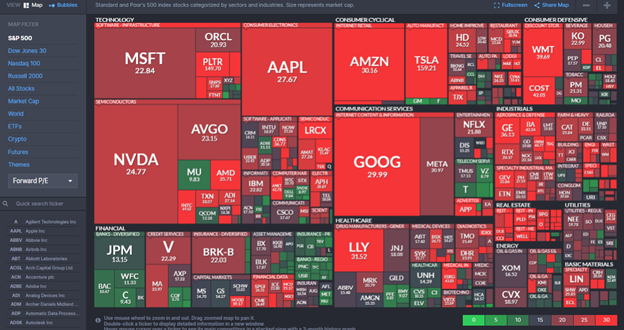
The FinViz website offers a great perspective on valuations across the S&P 500. Their heat map below shows the P/E ratio for every S&P 500 stock. The “E” is based on the trailing twelve months of earnings. The box sizes are commensurate with each market cap. This layout provides a unique way to view and compare valuations by stock, sector, and market cap.
As the map shows, many companies, large and small, across most sectors, have expensive P/E ratios of 30 or higher. Conversely, there are very few green boxes with more reasonable P/E ratios.

The P/E ratios shown above are a good indicator of a stock's current price relative to its earnings over the last 12 months. There is a benefit to tracking trailing earnings-based valuations; however, we must keep in mind that investors are buying tomorrow’s earnings, not yesterday's. Thus, the forward P/E ratio should be considered alongside the more traditional trailing P/E.
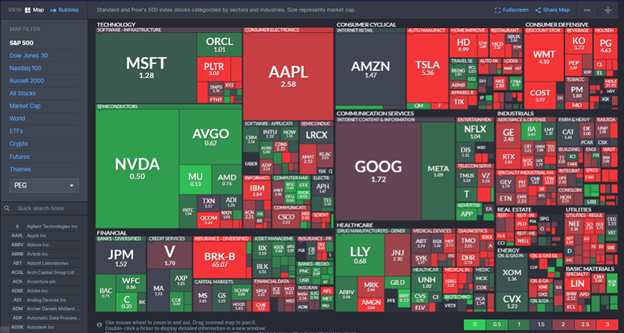
The heat map below shows forward P/Es. The “E” in these calculations is based on forward one-year earnings estimates. The graphic still shows many red boxes, but fewer are bright red, and more are neutral or green. Forward P/E ratios are not as stretched as trailing P/E ratios.

Sage Advice
Before moving on to a third type of P/E analysis, it's worth recalling Benjamin Graham's logic. Graham was an economist and professional investor, best known for his book Security Analysis and The Intelligent Investor. He is commonly referred to as the father of value investing. His conservative, fundamentals-based approach has guided many successful investors, including Warren Buffett. In fact, Buffett once said:
Ben Graham was the second most influential person in my life, after my father.
Given the importance of valuations, let’s consider a few quotes from Benjamin Graham to help us proceed with how we think about quantifying value stocks.
The investor should not base his decisions on anticipated changes in the future, but on what is demonstrably true now.
The quote argues that valuation analysis should be based on prior earnings or forward earnings that are very predictable. Such analysis is fit for well-established, mature companies with steady growth rates. But it doesn’t offer actionable advice for companies that haven't reached maturity, or lack earnings, or are experiencing rapid growth. To this, he says:
Analysis of the future should be limited to what can be reasonably foreseen.
This quote argues that it's ok to look into the future, but do so conservatively. The risk in overestimating future earnings, in his words, is:
To pay a substantial premium for growth that has not yet been realized is to pay twice for the same thing
With Graham's sage advice and caution, we look deeper into the future with the PEG ratio.
PEG Ratios
In the prior section, we wrote “investors are buying tomorrow’s earnings, not yesterday's.” We then presented valuations based on one-year forward earnings estimates. Compared to trailing PE ratios, forward ratios better reflect the future earnings investors are paying for. However, one year is far too short a projection for many growth companies.
To project P/E valuation analysis further into the future, investors use the PEG ratio. The PEG ratio divides the forward P/E ratio by the expected growth rate. Generally, a stock with a PEG ratio of 1.0 or lower is considered cheap or a value stock.
Most often, three- to five-year expected annualized growth rates are used for the “G” in the PEG ratio. However, investors can reformulate forward-looking valuations using growth estimates over any number of years.
The graphic below shows that the heat map using PEG ratios tells a very different story from the two heat maps we showed earlier. Some traditional value stocks and sectors, like consumer defensive (staples) and utility stocks, are predominantly bright red or greater than 1.0. At the same time, some of the fastest-growing companies that were deemed expensive in the first two maps are near or below 1.0.
To better appreciate the PEG ratio, we analyze Nvidia and compare it with Walmart.

Nvidia Vs. Walmart
NVIDIA is considered a growth stock, while Walmart is generally thought of as a value stock. Currently, they both have similar trailing P/E ratios in the low 40s. Using this metric, both are deemed very expensive, as they are nearly double the market P/E. Let's review Nvidia’s growth potential and its three P/E valuations to better appreciate its true valuation.
Nvidia has the following three P/E ratios:
- Trailing P/E: 41.07
- One Year Forward P/E: 25.03
- PEG ratio: 0.54
Nvidia’s trailing P/E indicates the stock is very expensive, but once future growth is incorporated into the analysis, the valuation perception changes. At 25.03, its forward P/E is in line with the broader market. Furthermore, using 3-5-year forward earnings forecasts, its PEG ratio indicates the stock is very cheap. Currently, the “G” in the PEG ratio assumes a forward annualized growth rate of 46.29%.
If we take a more conservative stance on their potential earnings growth and assume a 25% annualized rate, the PEG ratio is 1.0, which is still considered cheap. At a 20% growth rate, its PEG ratio is in line with the S&P 500 (1.25). Lastly, if Nvidia's earnings grow by 10% annually, the rate of earnings growth expected for Walmart, its PEG ratio would be 4.35.
Forecasting future earnings is a tough task, but as a worst-case scenario, it's fair to assume Nvidia’s growth will average above 20% or more over the next few years. Thus, its PEG ratio is cheap at the current forecast and reasonable in our worst-case scenario. Walmart, on the other hand, could double its forecasted 10% earnings growth and still have a moderately expensive PEG ratio of slightly over 2.0.
The point is that the trailing P/E for Walmart and Nvidia are similar. But, once one-year or three-to-five-year earnings growth forecasts are incorporated into the analysis, Nvidia becomes a value stock while Walmart remains very expensive. Or more simply, what investors deem as value (Walmart) is far from value, while the largest growth stock (Nvidia) is truly a value stock.

Summary
Correctly forecasting earnings is impossible. There are many unknown factors, directly related to the company's management and beyond its control, that make any forecast error-prone. In the case of Nvidia, its earnings are dependent on the economy, like most stocks, but highly tied to AI development and data center buildouts, which could turn out to be highly variable. Further, while they have a strong economic moat today, it could erode quickly, resulting in slower earnings growth. However, as we showed, even after substantially discounting earnings forecasts, Nvidia is a value stock.
Walmart’s earnings are less variable and generally correlated with economic activity. Thus, while we can be more comfortable with its forecasts, the odds of its earnings growing at a rate to justify its PEG ratio are extremely unlikely. So, while investors assume Walmart is in the value camp, it is anything but a value stock at current prices and valuation metrics.
The funny thing is that in this value rotation, many investors are unknowingly shifting from value stocks to expensive ones.
The post The Value Rotation Illusion appeared first on RIA.
Full story here Are you the author?You Might Also Like
2025-12-03
Starting in the aftermath of the 2008 financial crisis, a profound change to the Fed’s liquidity-providing role in the capital markets was underway. We can sum up the Fed regime change with a popular quip: The Fed has shifted from lender of last resort to the lender of only resort! In our articles QE Is …
 HSBC Casts Doubt On OpenAI’s Future
2025-12-01
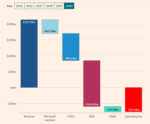
Per the Financial Times (LINK), HSBC has serious doubts about OpenAI’s financial wherewithal. The following bullet points outline HSBC’s assumptions, which highlight the challenging financial path OpenAI faces. The graphic below from the article shows that HSBC expects OpenAI to run a massive operating loss in the year 2030. Accordingly, they have serious concerns about …
Tags: Featured,newsletter