Lance Roberts
My articles My offerMy siteAbout meMy videosMy books
Follow on:TwitterSeeking AlphaFacebookAmazon
Inside This Week's Bull Bear Report
- CFNAI Index Suggests Economy Is Slowing
- How We Are Trading It
- Research Report - CAPE-5, A Better Measure
- Youtube - Before The Bell
- Market Statistics
- Stock Screens
- Portfolio Trades This Week
February Weakness And The Outlook For March
Last week, we discussed that continued bullish exuberance and high levels of complacency can quickly turn into volatility. Over the previous week, the market fell sharply following news of a potential viral outbreak in China and more concerns about tariffs from the Trump Administration. While those were the headlines that gained the market's attention, the reality was that the market was overbought and on a sell signal, setting the market up for pullback. The correction was not unexpected, as discussed three weeks ago:
"The bullish bias is evident, as witnessed by the recent surge in retail money flows into leveraged ETFs and speculative options trading. However, as is always the case, whenever investors are crowded on “one side of the boat,” it is often a decent contrarian signal to be a bit more cautious. Furthermore, while there is currently no evidence of a catalyst for a correction, it is worth noting that we are entering into the seasonally weak part of February."

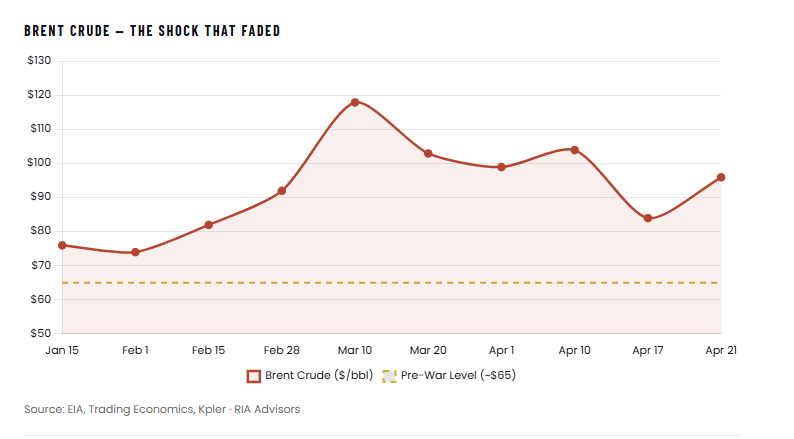
In other words, while the media scrambled to align reasons with the sell-off, the correction was very much in line with seasonal tendencies. Crucially, that sell-off has pushed investor sentiment to levels typically equating to much deeper corrections. From a contrarian view, that extreme negative sentiment, now combined with oversold conditions, provides a good base for a rally in March.
"Sentiment is approaching two standard deviations below its average level. Such levels are more coincident with market bottoms than the beginning of a corrective cycle. I have labeled some events along the way. The lesson is that headlines drive sentiment, and when sentiment becomes too negative, as may be the case today, such allows for rallies to form."
Here Comes March
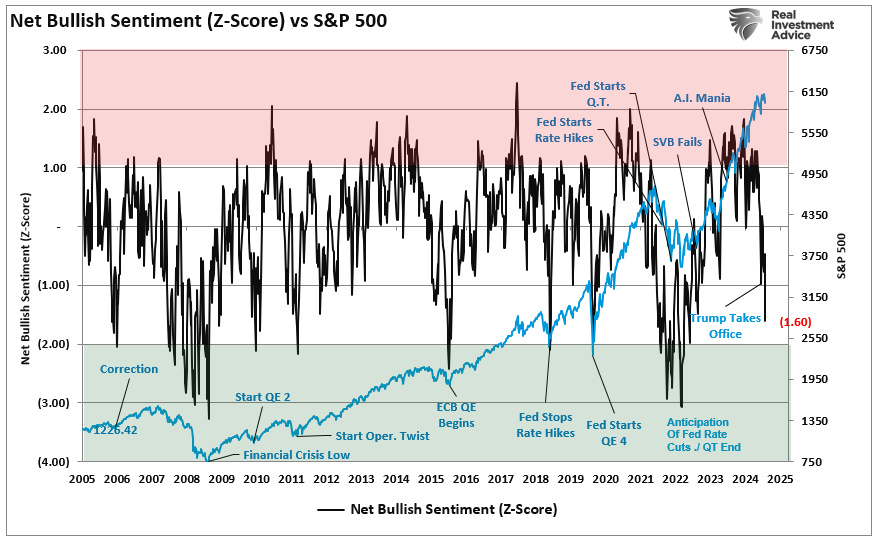
Furthermore, March has a seasonal bias to the upside as we enter the end of the quarter and the last stretch of the seasonally strong period of the year. January, March, and April have the most substantial early-year returns, with March and April having the highest win rates.
Does this mean the next major bull market rally is set to begin? No. But it does suggest that there are such high levels of negative sentiment that selling today will likely be a mistake. Loss avoidance is one of the psychological factors that leads investors to long-term underperformance. With market sentiment very negative and becoming decently oversold, be patient and wait for a tradeable rally to rebalance portfolio positions as needed. For traders, a decent tradable opportunity is likely in the near term.
However, while there is a potential for a decent tradeable rally over the next month or so, we still expect increased volatility this year. We want to reiterate using rallies to rebalance risk and manage allocations as needed.
The latest readings from the CFNAI index are one reason we remain cautious about our outlook.
Need Help With Your Investing Strategy?
Are you looking for complete financial, insurance, and estate planning? Need a risk-managed portfolio management strategy to grow and protect your savings? Whatever your needs are, we are here to help.

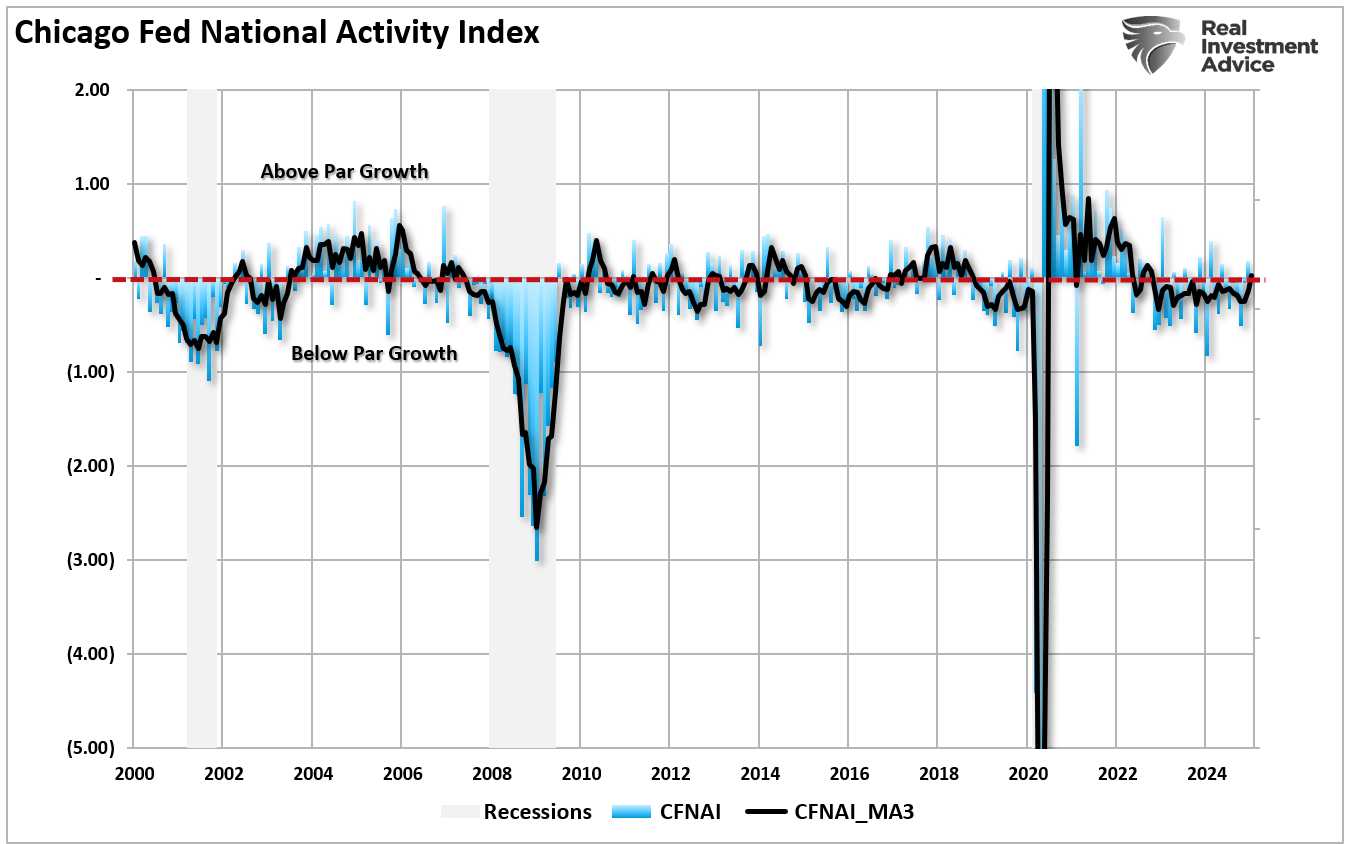
The CFNAI Index Suggests The Economy Is Weakening
Recent economic reports have shown a more serious activity slowdown, which we have discussed many times in recent months. One indicator we watch closely is the Chicago Fed National Activity Index (CFNAI) which is arguably one of the most important and overlooked economic indicators. Each month, economists, the media, and investors pour over various mainstream economic indicators, from GDP to employment and inflation, to determine what markets will likely do next.
While economic numbers like GDP or the monthly non-farm payroll report typically garner the headlines, the most crucial statistic, in my opinion, is the CFNAI index. Investors and the press mostly ignore it, but the CFNAI is a composite index of 85 sub-components and provides a broad overview of overall economic activity in the U.S.
Since the beginning of this year, the markets have struggled as they digest news of tariffs, concerns over Artificial Intelligence, and sticky inflation. Even with that pickup in volatility, as discussed this past week, analysts are very optimistic about earnings growth throughout this year and into 2026. Those expectations are predicated upon continued robust economic growth. To wit:
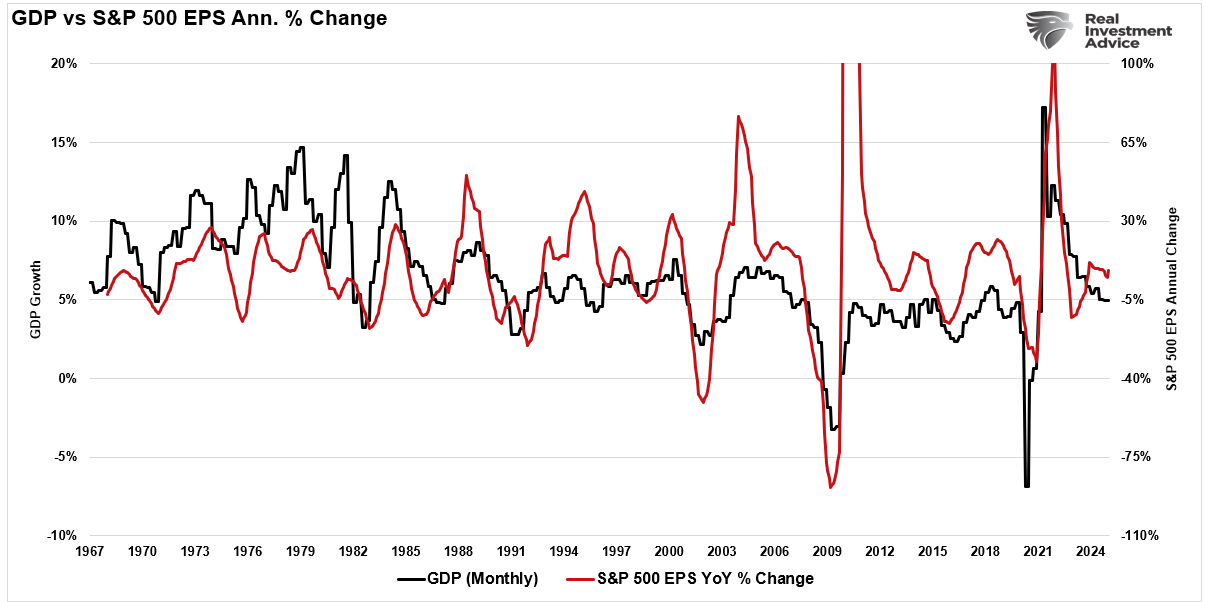
"The chart below shows earnings’ long-term growth. Notably, analysts expect a record deviation above earnings’ long-term exponential growth trend of $195/share and above the 6% peak-to-peak historical growth rate."
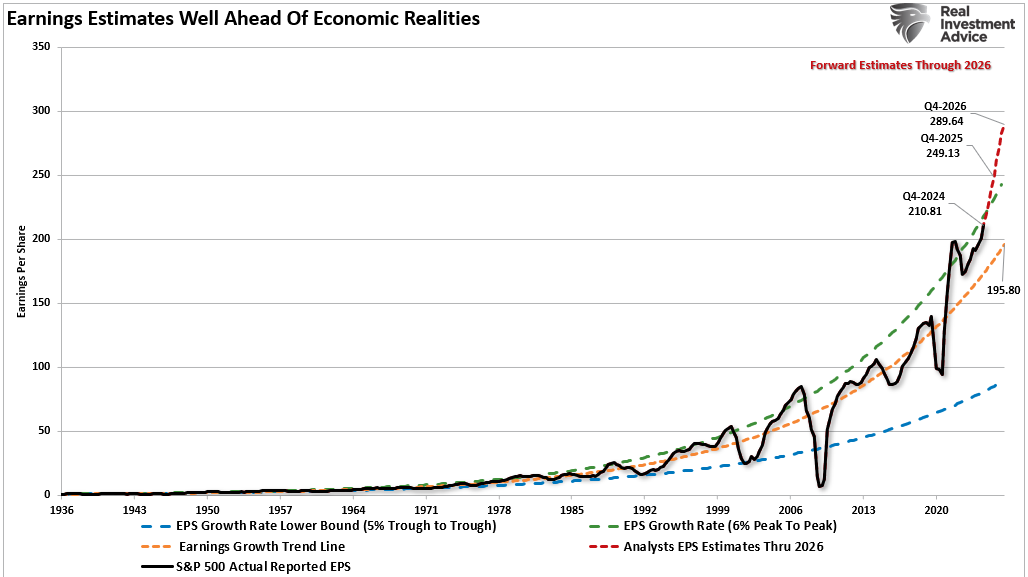
"The peak-to-peak growth trend is crucial because it is the historical growth rate of nominal GDP. Given that corporate revenue, from which earnings are derived, comes from economic activity, the correlation is logical. There are times when earnings can grow much faster than the economy, such as when the economy emerges from a recession. However, over time, earnings growth returns to the long-term relationship."
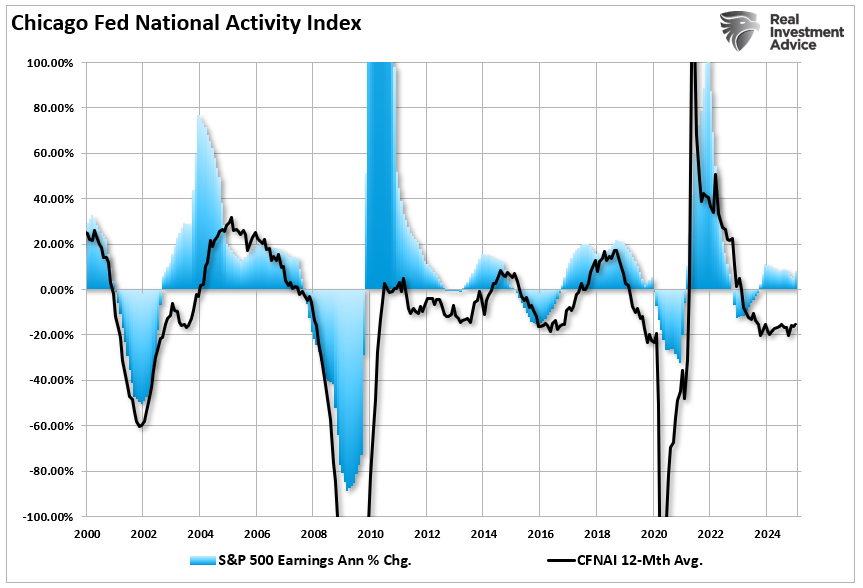
However, if recent CFNAI index readings are any indication, investors may want to temper their expectations heading into this year. While most economic data series, like GDP, are backward-looking statistics, the CFNAI index is a forward-looking metric that indicates how the economy will likely look in the coming months. With a continued reading below zero, such does not suggest economic "robustness" in the months ahead.
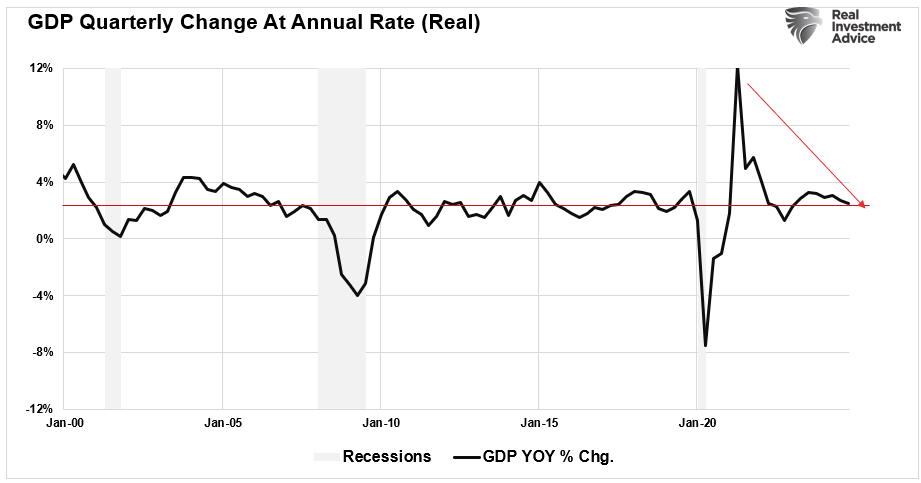
Furthermore, the CFNAI index also supports the continued retracement of actual economic growth rates towards 2%, which has been the average since the turn of the century.
So, what is the CFNAI index telling us that the BEA economic reports are not?
CFNAI Index: Breaking Down The “Most Important Number”
Understanding the message the index is designed to deliver is critical. A negative reading DOES NOT equate to a recession. From the Chicago Fed website:
“The Chicago Fed National Activity Index (CFNAI Index) is a monthly index designed to gauge overall economic activity and related inflationary pressure. A zero value for the index indicates that the national economy is expanding at its historical trend rate of growth; negative values indicate below-average growth; and positive values indicate above-average growth.“
The overall index is broken down into four major sub-categories, which cover:
- Production & Income
- Employment, Unemployment & Hours
- Personal Consumption & Housing
- Sales, Orders & Inventories
I have constructed a four-panel chart better to understand the critical sub-components and their predictive capability. For illustrative purposes, I compare the CFNAI Index sub-components to the four most common economic reports: Industrial Production, Employment, Housing Starts, and Personal Consumption Expenditures. Notably, the CFNAI data is extremely volatile, so I have smoothed the data using a six-month average. Then, to align that data with the CFNAI index, I used an annual percentage change for the four mainstream economic components.
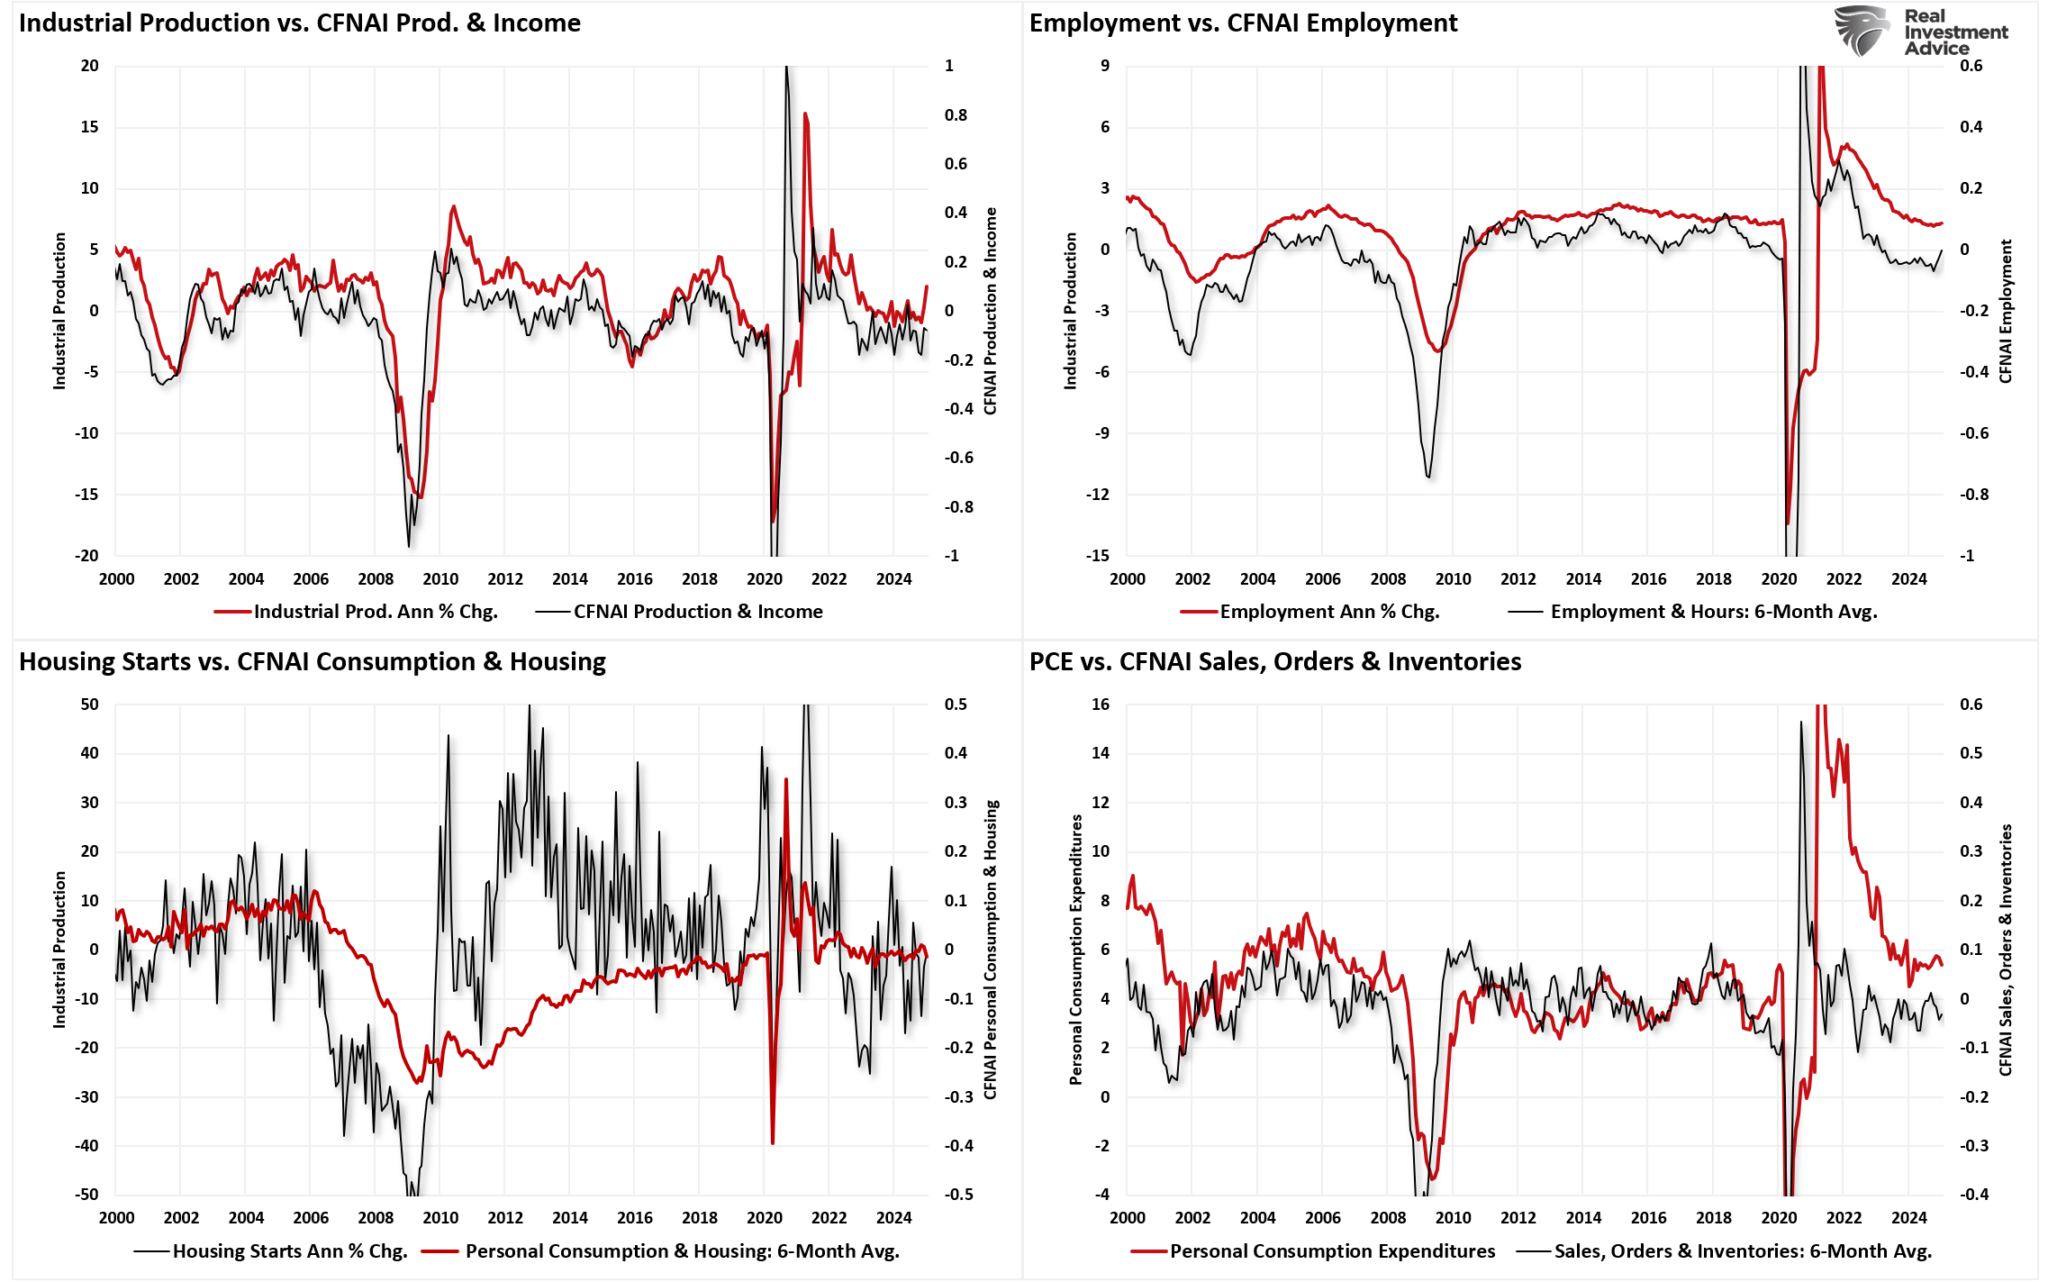
The correlation between the CFNAI index sub-components and the underlying major economic reports is high. This is why, even though this indicator gets very little attention, it represents the broader economy. The CFNAI index does not confirm the mainstream view of an “economic resurgence” that will drive earnings growth in 2026.
The EOCI Index Comparison
Furthermore, the CFNAI is also essential to our RIA Economic Output Composite Index (EOCI), which is an even broader composition of data points, including Federal Reserve regional activity indices, the Chicago PMI, ISM, the National Federation of Independent Business Surveys, and the Leading Economic Index. The EOCI also confirms that while economic data has improved following the economic shutdown, the “hopes” of a massive resurgence in economic activity are unlikely. Lastly, given that these indicators are only slightly into expansion territory, any impact from tariffs, deficit reductions, or increased unemployment will push these indicators back into contraction.

Notably, the EOCI and the Leading Economic Index remained in typically recessionary territory for an extended period, yet the National Bureau of Economic Research never called a recession. While readings have reverted to normal, the current state of broad economic data supports an economic growth rate of 2%-ish but not much more than that. Such a low economic growth rate does not support elevated levels of employment, increased wages, or consumption. Such is critical to the outlook for earnings.
"Again, this is because earnings are a function of economic activity. Therefore, for earnings to match current estimates, expectations for economic growth must improve sharply. However, such seems unlikely given the impact of tariffs and reductions in government spending and employment. Therefore, it is far more likely that we will eventually see a sharp decrease in forward estimates."
The risk to investors is that if estimates are too elevated, any reduction in those estimates will weigh on asset prices as markets reprice for economic realities.
It’s In The Diffusion
The Chicago Fed also provides a breakdown of the change in the underlying 85 components in a “diffusion” index. As opposed to just the index itself, the “diffusion” of the components gives us a better understanding of the broader changes inside the index itself.
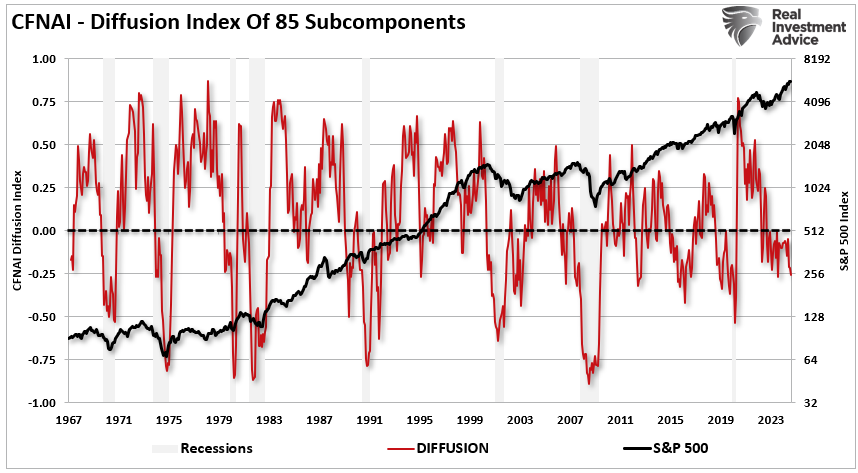
There are two points of consideration:
- When the diffusion index dips below zero, it coincides with weak economic growth and outright recessions.
- The S&P 500 has a history of corrections and outright bear markets, corresponding with negative readings in the diffusion index.
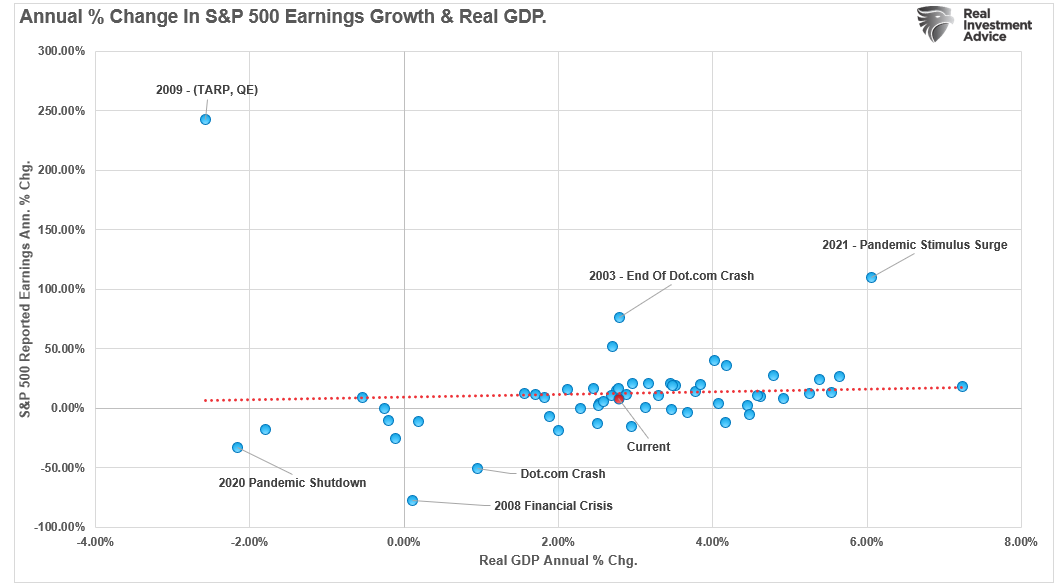
The second point should not be surprising, as the stock market reflects economic growth. Both the EOCI index above and the CFNAI below correlate to the annual rate of change in the S&P 500. However, what IS surprising is that since 2023, the market has surged higher despite a continued slate of economic weakness in actual activity. Such is because of the massive infusion of capital into the economy through fiscal and monetary measures. The break of the long-term correlation is remarkable and suggests that markets are likely to revert to underlying economic activity rather than the opposite.

That exact correlation also shows up in the annual growth rate of earnings. Given that earnings are a function of economic activity, as discussed above, the current deviation between earnings growth and the economy is likely unsustainable. Given that the Fed is maintaining a higher interest rate environment, inflation remains sticky, and the current Administration is taking disinflationary actions through immigration and deficit reduction policies, it is unlikely that the economy will rise to support current earnings growth rates.
Investors should also be concerned about the current level of consumer confidence readings.
Not So Confident
The chart below is our consumer confidence composite index. It combines the University of Michigan and the Conference Board’s sentiment readings into one index. Unsurprisingly, when consumers are confident, the stock market tends to rise. As Ben Bernanke noted, rising asset prices boost consumer confidence, supporting economic growth. While consumer confidence has risen from the 2022 lows, confidence readings are starting to show signs of stress as consumers run out of excess savings.
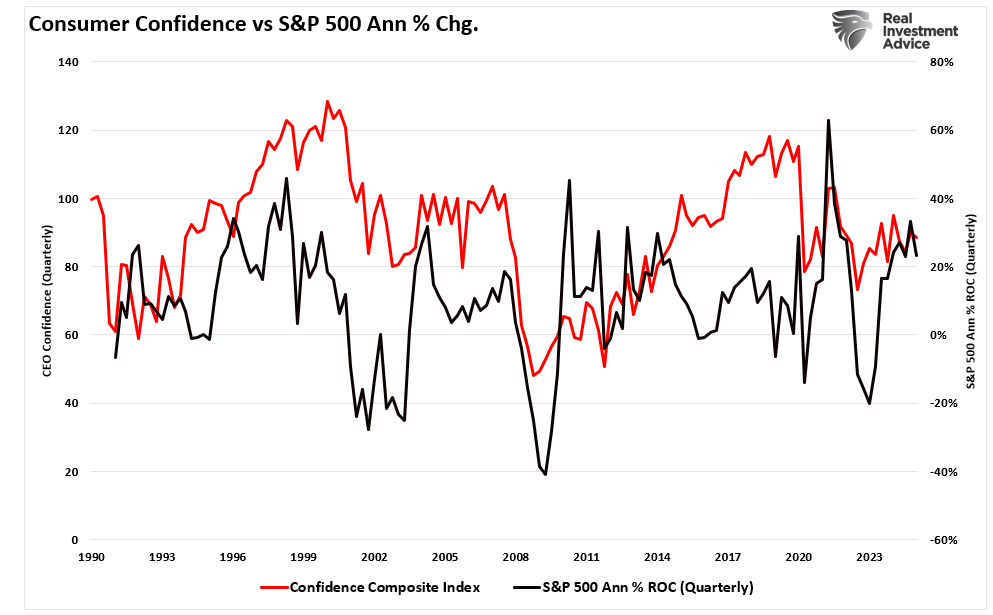
Crucially, consumer confidence feeds CEO confidence.
“Is it the consumer cranking out work hours, raising a family, and trying to make ends meet? Or the CEO of a company that has the best view of the economic landscape. Sales, prices, managing inventory, dealing with collections, paying bills, tells them what they need to know about the actual economy?”
In other words, when consumer confidence is high and demand for products or services is elevated, CEOs are willing to expend capital for expansion, employment, or increased wages. When consumer confidence reverses, CEO confidence will also reverse, leading to employment reductions, wage cuts, and reduced spending, which impacts economic growth. This is why, given that the market reflects confidence, investors should pay attention to what consumers and CEOs are saying and doing.
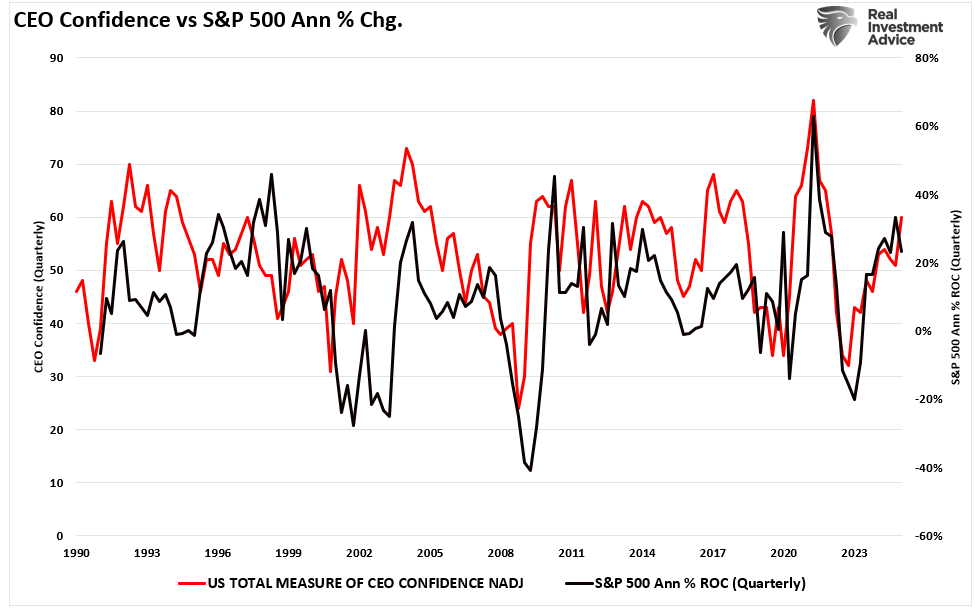
Despite the recent uptick in CEO confidence since October, which corresponded with strong equity market performance, confidence is hovering near peak expansionary levels.
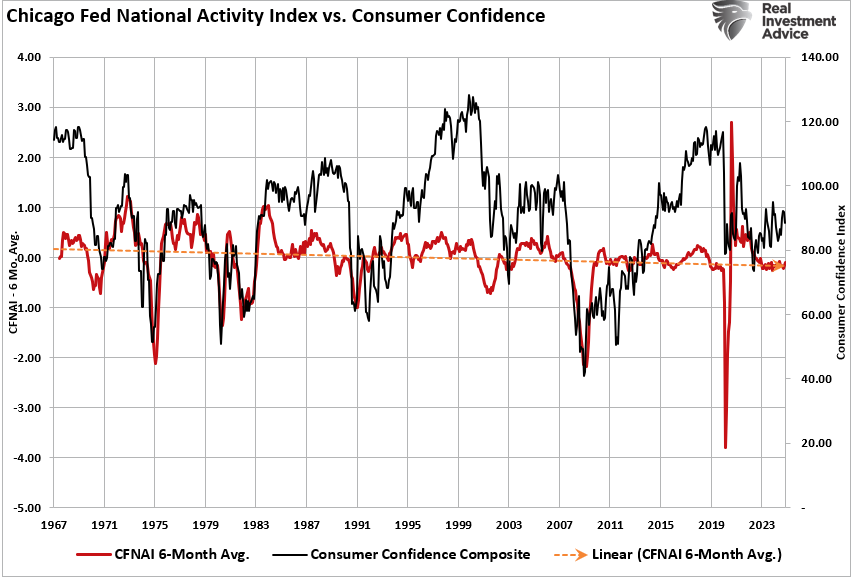
The CFNAI also tells the same story: significant consumer confidence divergences eventually “catch down” to the underlying index, not vice versa.
Conclusion
If history is any guide, this chart suggests we will begin seeing weaker employment numbers and rising layoffs in the months ahead.
As noted, the data tells an important story for investors. Notably, the historical data of the CFNAI and its relationship to the stock market have included all Federal Reserve activity.
The CFNAI and EOCI incorporate the impact of monetary policy on the economy in both lagging and leading indicators. This is why investors should hedge risk to some degree in portfolios, as the data still suggests weaker than anticipated economic growth. The current trend of the various economic data points on a broad scale does not show indications of "economic resurgence" to support elevated earnings expectations. Instead, the data suggests an increased risk of disappointment in expectations.
Economically speaking, such weak levels of economic growth do not support more robust employment or higher wages. Instead, we should expect that 2025 could be a year in which corporate earnings and profits disappoint investors as economic weakness reasserts itself.
How We Are Trading It
Wall Street analysts’ overly optimistic assumptions are almost always likely to overshoot reality. As discussed, earnings tend to grow very close to economic activity, with overshoots and undershoots caused by macro-driven events like monetary and fiscal interventions or recessionary outcomes. This time is unlikely to be any different.
Given the current market exuberance, historical overvaluation concerns, and the reliance on buybacks to sustain prices, investors should consider hedging strategies to protect their portfolios.
- Don’t forget fixed income to lower market-related volatility.
- Don’t be afraid to increase cash levels when uncertain where to invest.
- Focus on fundamentally strong companies with strong dividend histories.
- Monitor corporate buybacks and economic indicators.
As we head into 2025, investors should expect market volatility to increase. Such is particularly true if buybacks decline due to economic weakness or policy changes. Likewise, tracking macroeconomic indicators such as employment data, inflation trends, and GDP growth can provide early warning signals of a market shift.
We continue to suggest taking small actions within portfolios. Such actions can help investors better navigate the risks associated with an unexpected rise in market volatility.
Or, you can shut your eyes and hope for the best.
Feel free to reach out if you want to navigate these uncertain waters with expert guidance. Our team specializes in helping clients make informed decisions in today’s volatile markets.
Have a great week.
Research Report

Subscribe To “Before The Bell” For Daily Trading Updates
We have set up a separate channel JUST for our short daily market updates. Please subscribe to THIS CHANNEL to receive daily notifications before the market opens.
Click Here And Then Click The SUBSCRIBE Button
Subscribe To Our YouTube Channel To Get Notified Of All Our Videos
Bull Bear Report Market Statistics & Screens

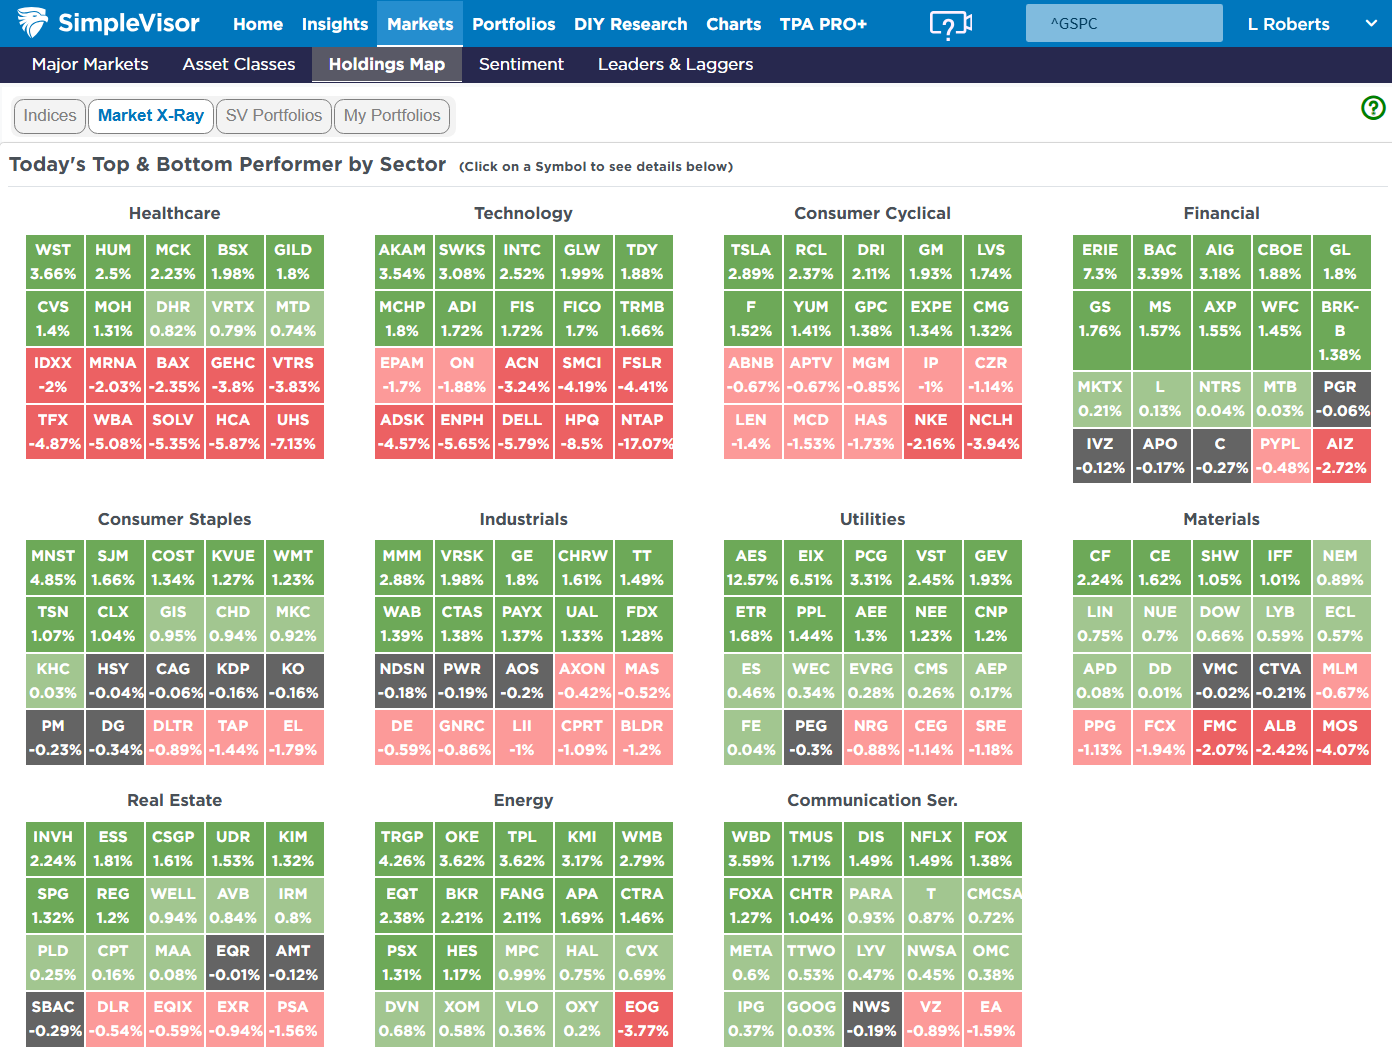
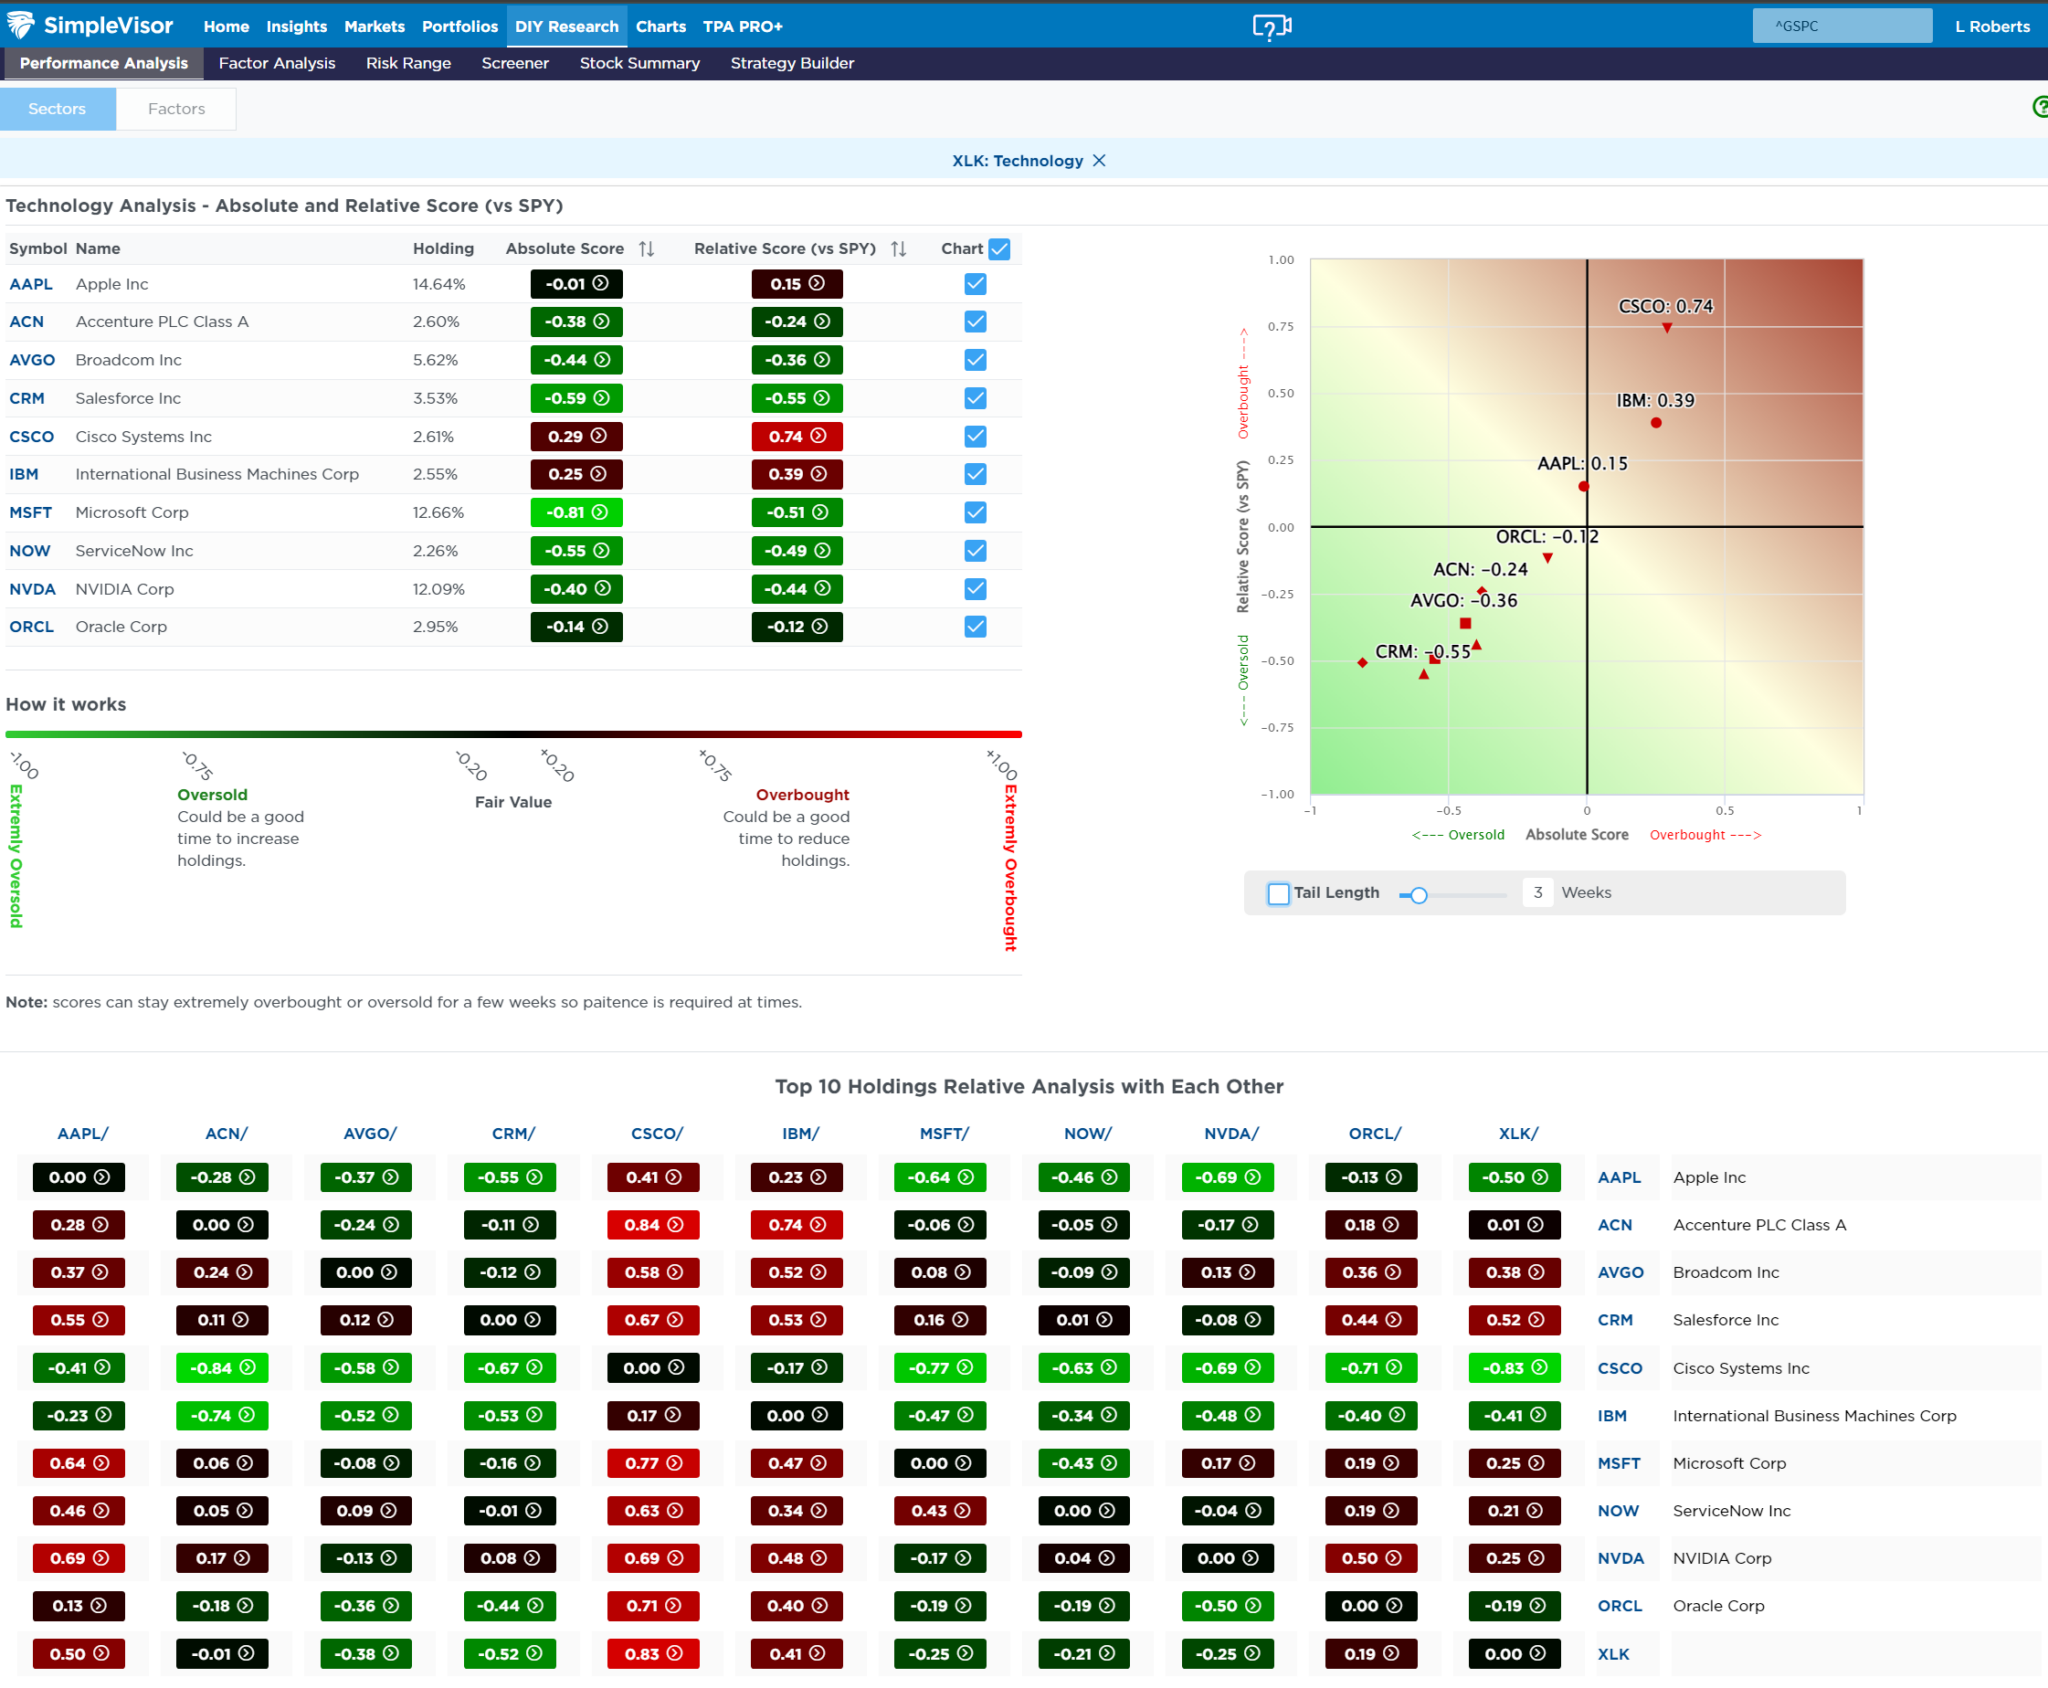
SimpleVisor Top & Bottom Performers By Sector
S&P 500 Weekly Tear Sheet

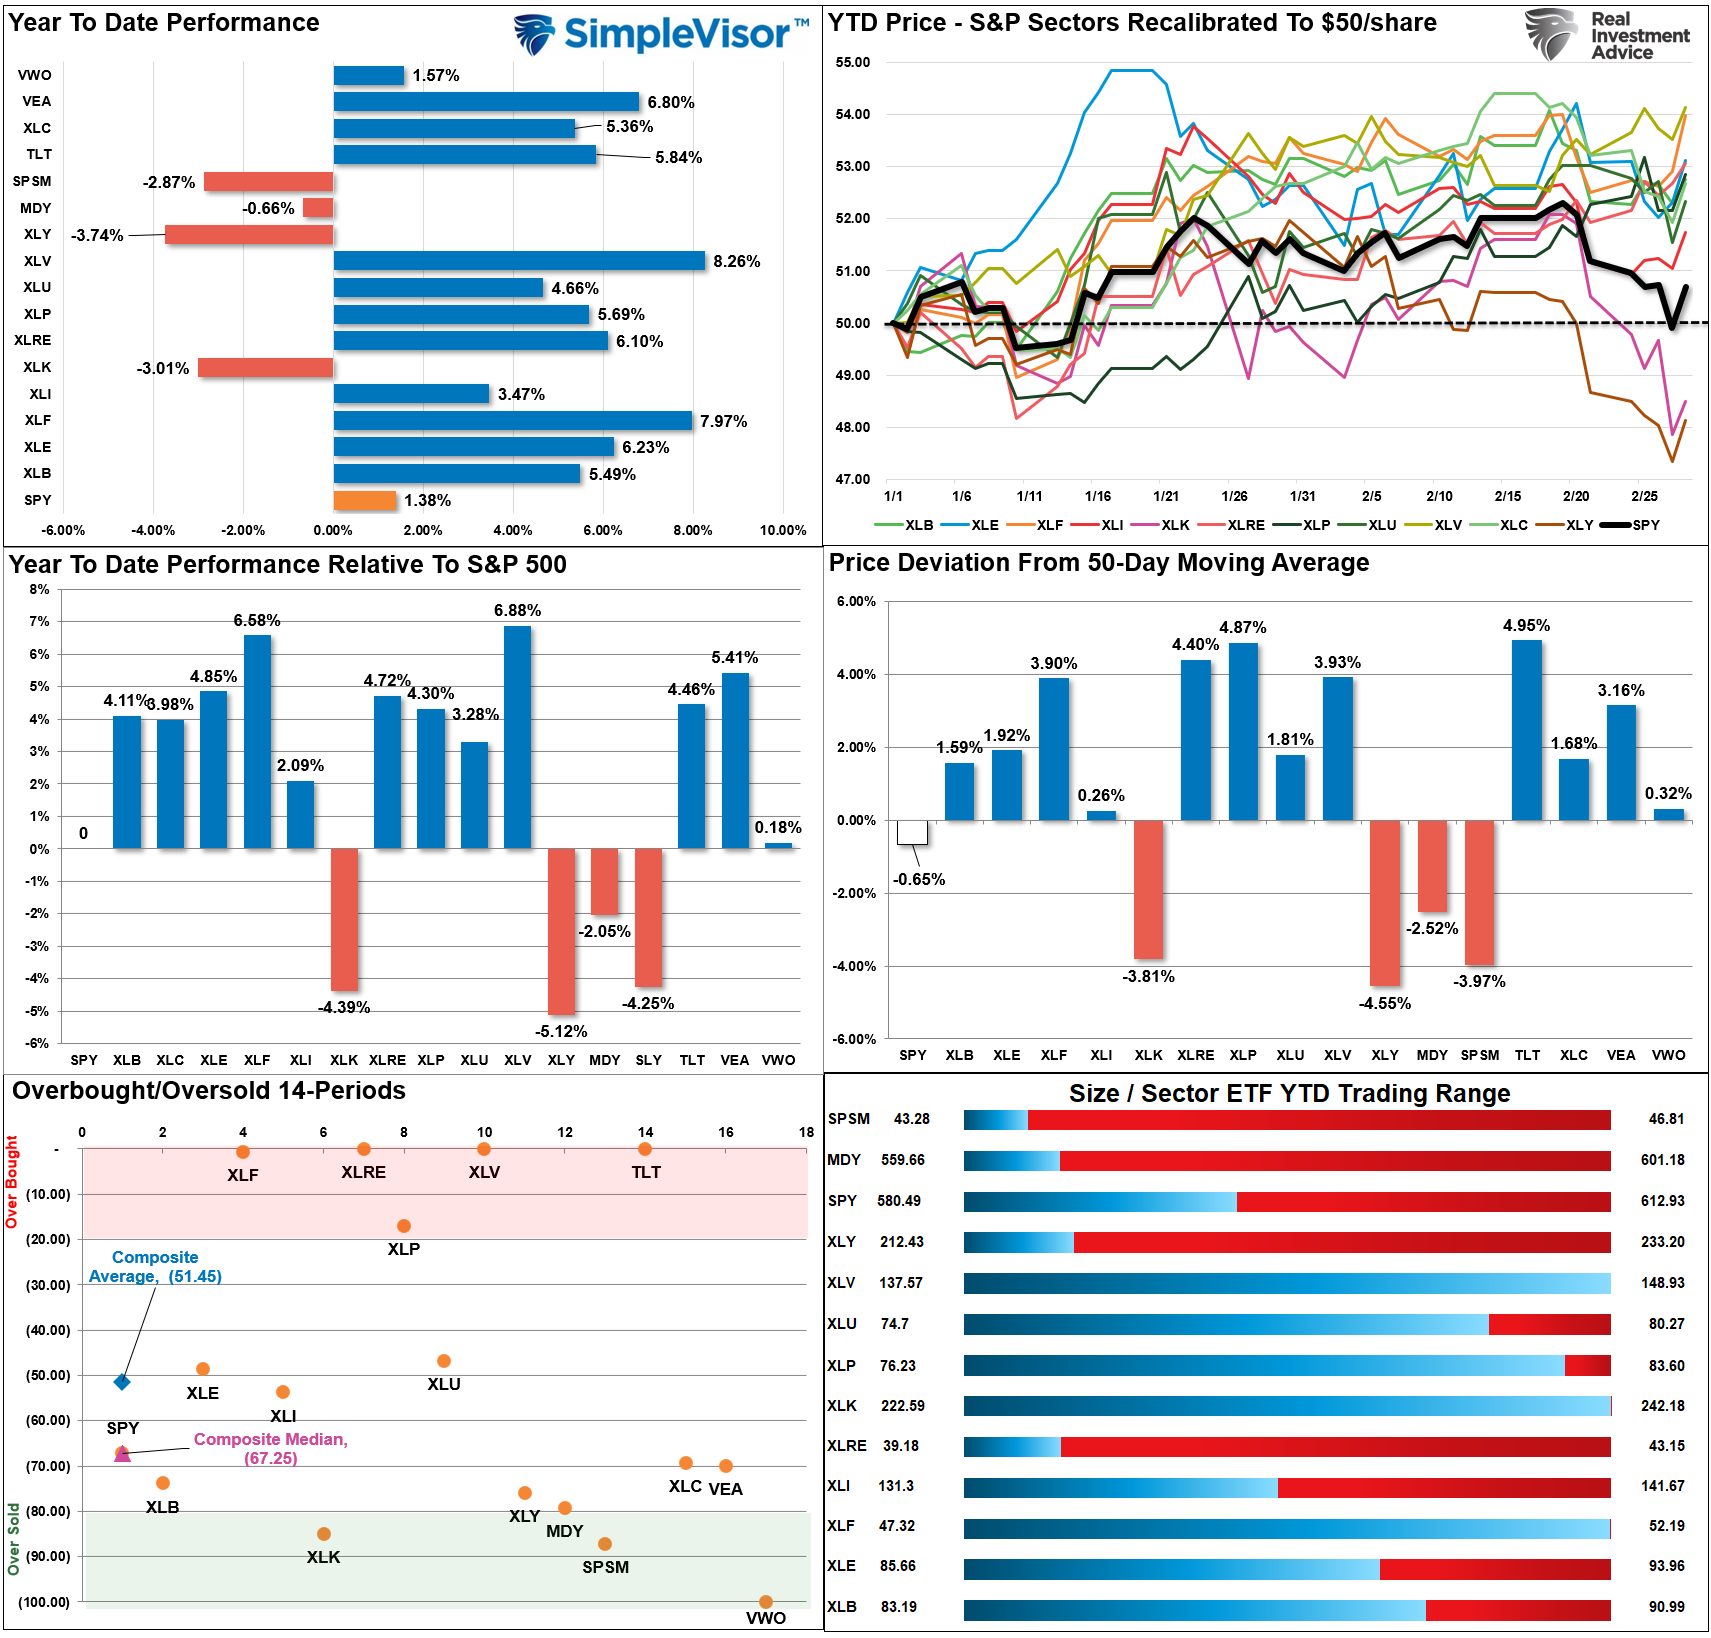
Relative Performance Analysis
Last week, we noted the collision of options expiration, overbought markets, and news of a potential new viral outbreak in China sent markets lower.
"Notably, bonds are outperforming stocks for the year, with small, mid-cap, and discretionary stocks sporting a negative return. With the flight into safety over the last week, interest rate-sensitive markets are overbought, and growth markets are oversold.We could see a bit of counter-rotation early next week, but that will depend on how the absorbs the risk of another viral outbreak."
While the outbreak news was quickly dismissed, stocks struggled this week, with bonds, real estate, healthcare, financials, and staples outperforming. Those sectors are now very overbought, and profits should be harvested. Conversely, technology is oversold enough to likely see the rally that started on Friday continue this week.
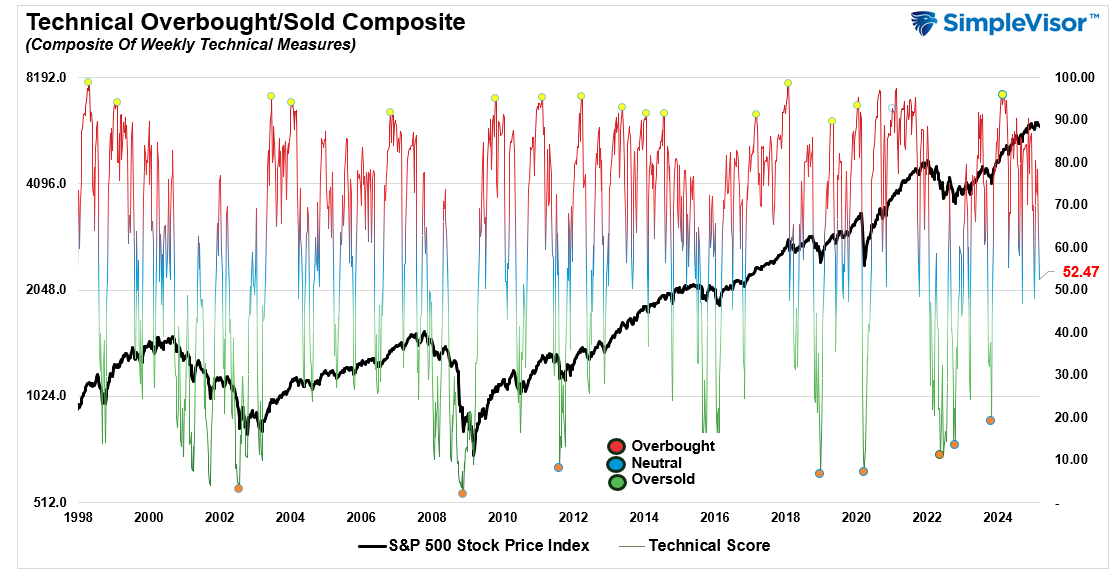
Technical Composite
The technical overbought/sold gauge comprises several price indicators (R.S.I., Williams %R, etc.), measured using “weekly” closing price data. Readings above “80” are considered overbought, and below “20” are oversold. The market peaks when those readings are 80 or above, suggesting prudent profit-taking and risk management. The best buying opportunities exist when those readings are 20 or below.
The current reading is 52.47 out of a possible 100.
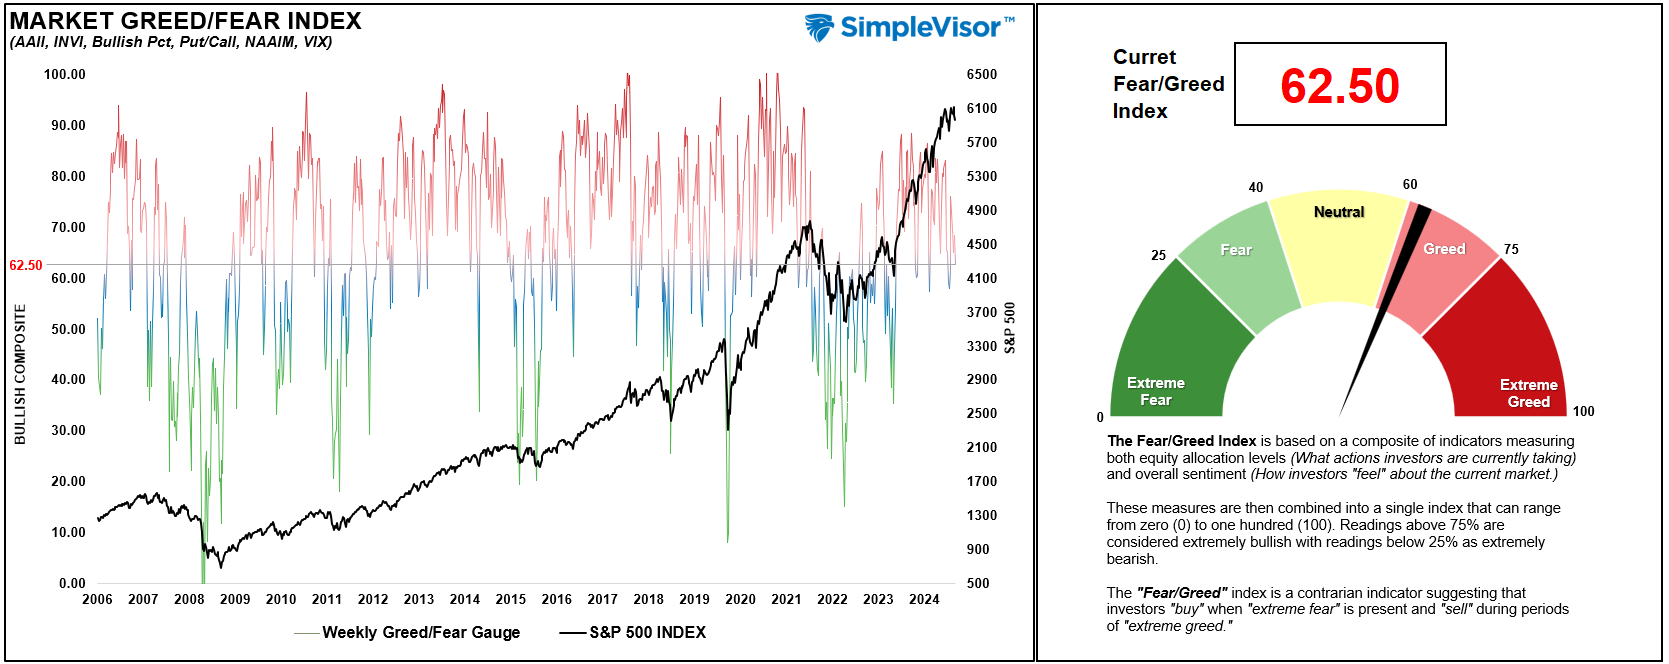
Portfolio Positioning “Fear / Greed” Gauge
The “Fear/Greed” gauge is how individual and professional investors are “positioning” themselves in the market based on their equity exposure. From a contrarian position, the higher the allocation to equities, the more likely the market is closer to a correction than not. The gauge uses weekly closing data.
NOTE: The Fear/Greed Index measures risk from 0 to 100. It is a rarity that it reaches levels above 90. The current reading is 62.50 out of a possible 100.
Relative Sector Analysis
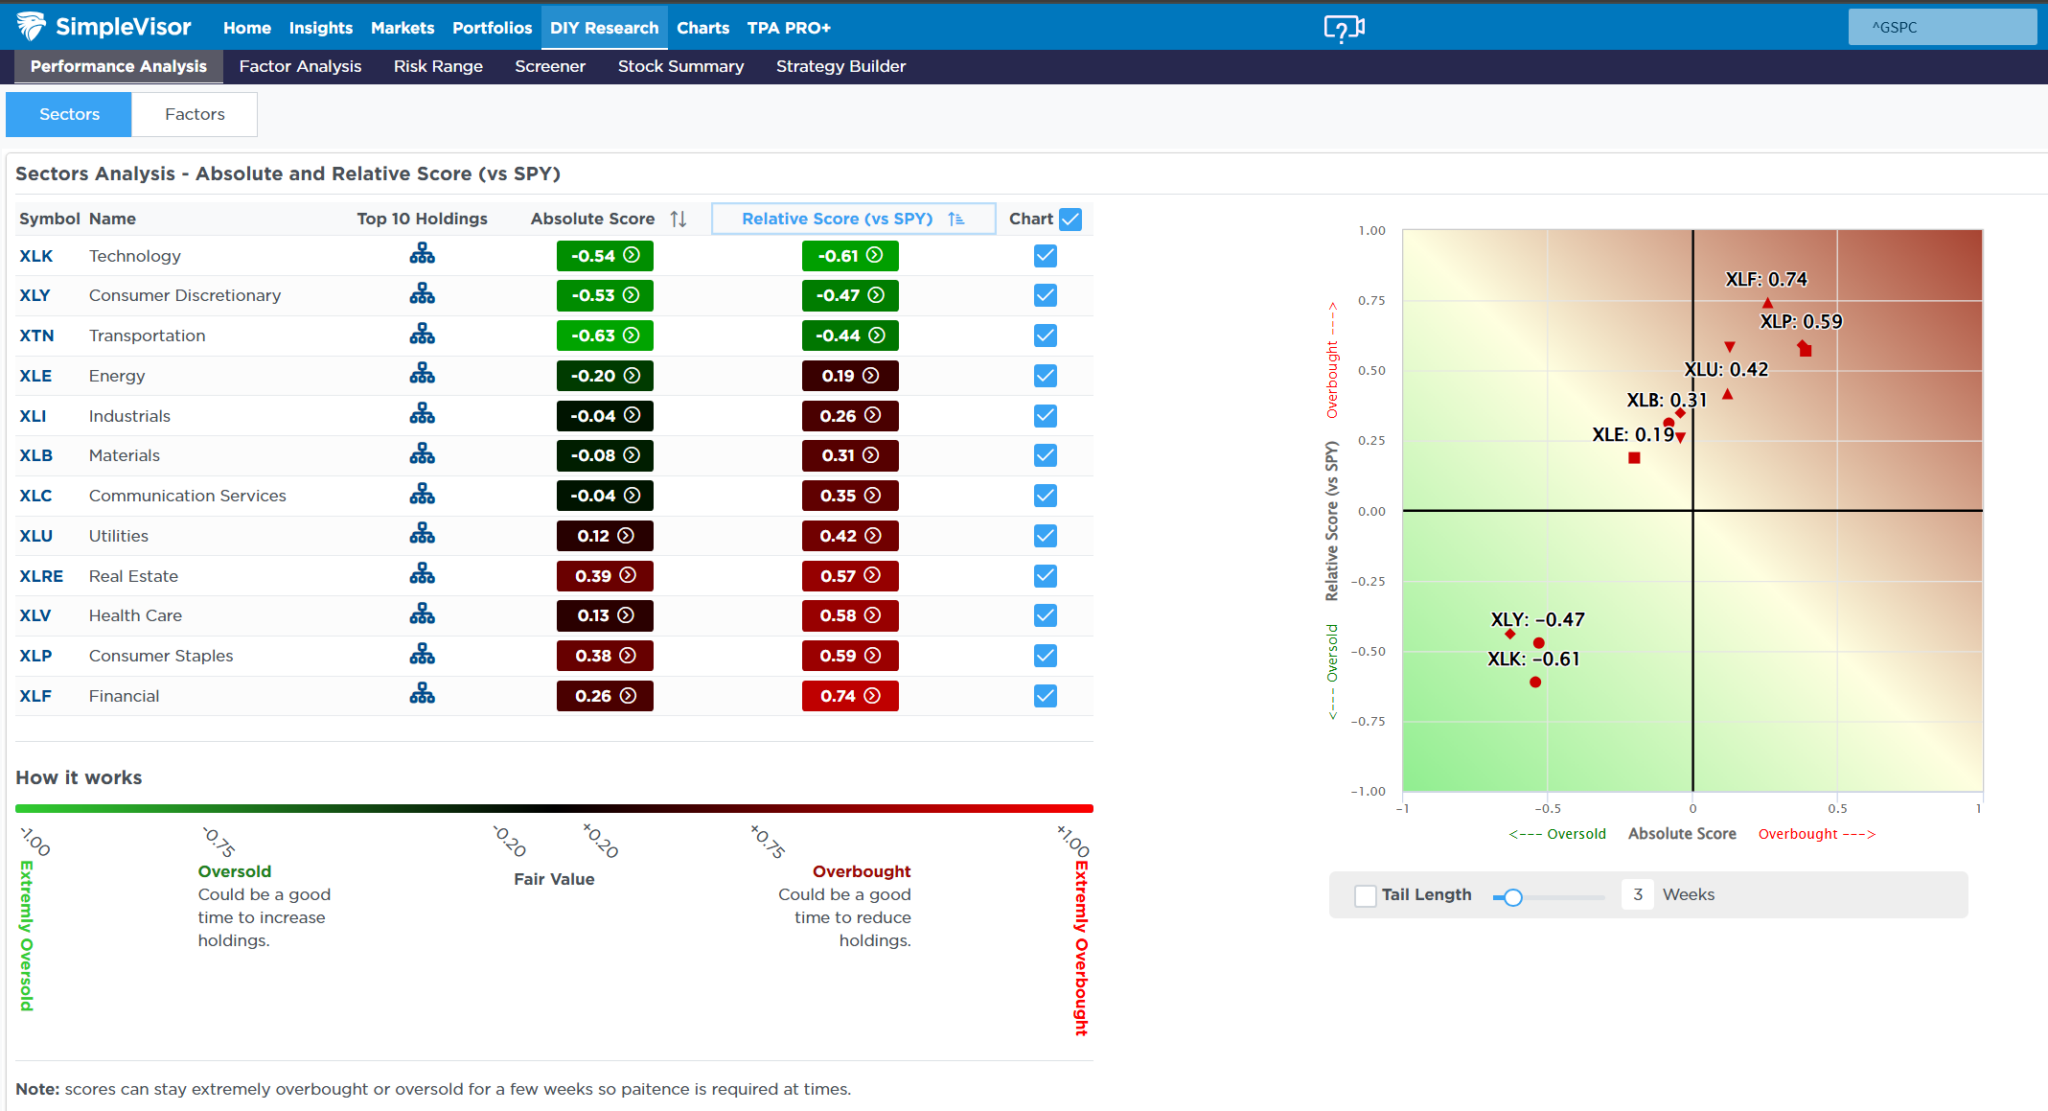
Most Oversold Sector Analysis
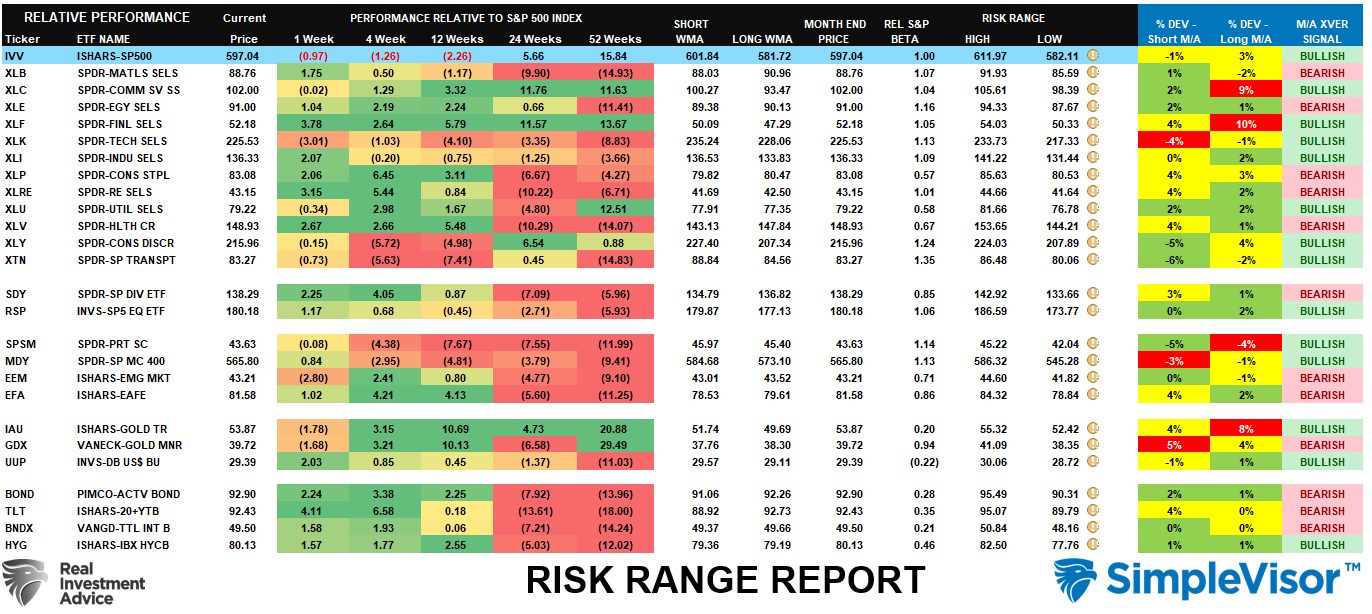
Sector Model Analysis & Risk Ranges
How To Read This Table
- The table compares the relative performance of each sector and market to the S&P 500 index.
- “MA XVER” (Moving Average Crossover) is determined by the short-term weekly moving average crossing positively or negatively with the long-term weekly moving average.
- The risk range is a function of the month-end closing price and the “beta” of the sector or market. (Ranges reset on the 1st of each month)
- The table shows the price deviation above and below the weekly moving averages.
The risk/range report has reset for the beginning of the month. However, I want to restate the following from last week:
"One of the early warning indicators the risk-range report provides is the moving average crossover (last column) of intermediate and long-term measures. A few months ago, only bonds and international traded on bearish crossovers. Since then, we have sharply increased the number of bearish crossovers in various sectors and markets. Such suggests an ongoing deterioration in price action in the markets, which has yet to spill over into the S&P 500 completely. While this does not mean that investors should immediately become bearish, it does suggest that risks are building for a more substantial market correction at some point if these sub-markets do not start to improve soon."
Weekly SimpleVisor Stock Screens
We provide three stock screens each week from SimpleVisor.
This week, we are searching for the Top 20:
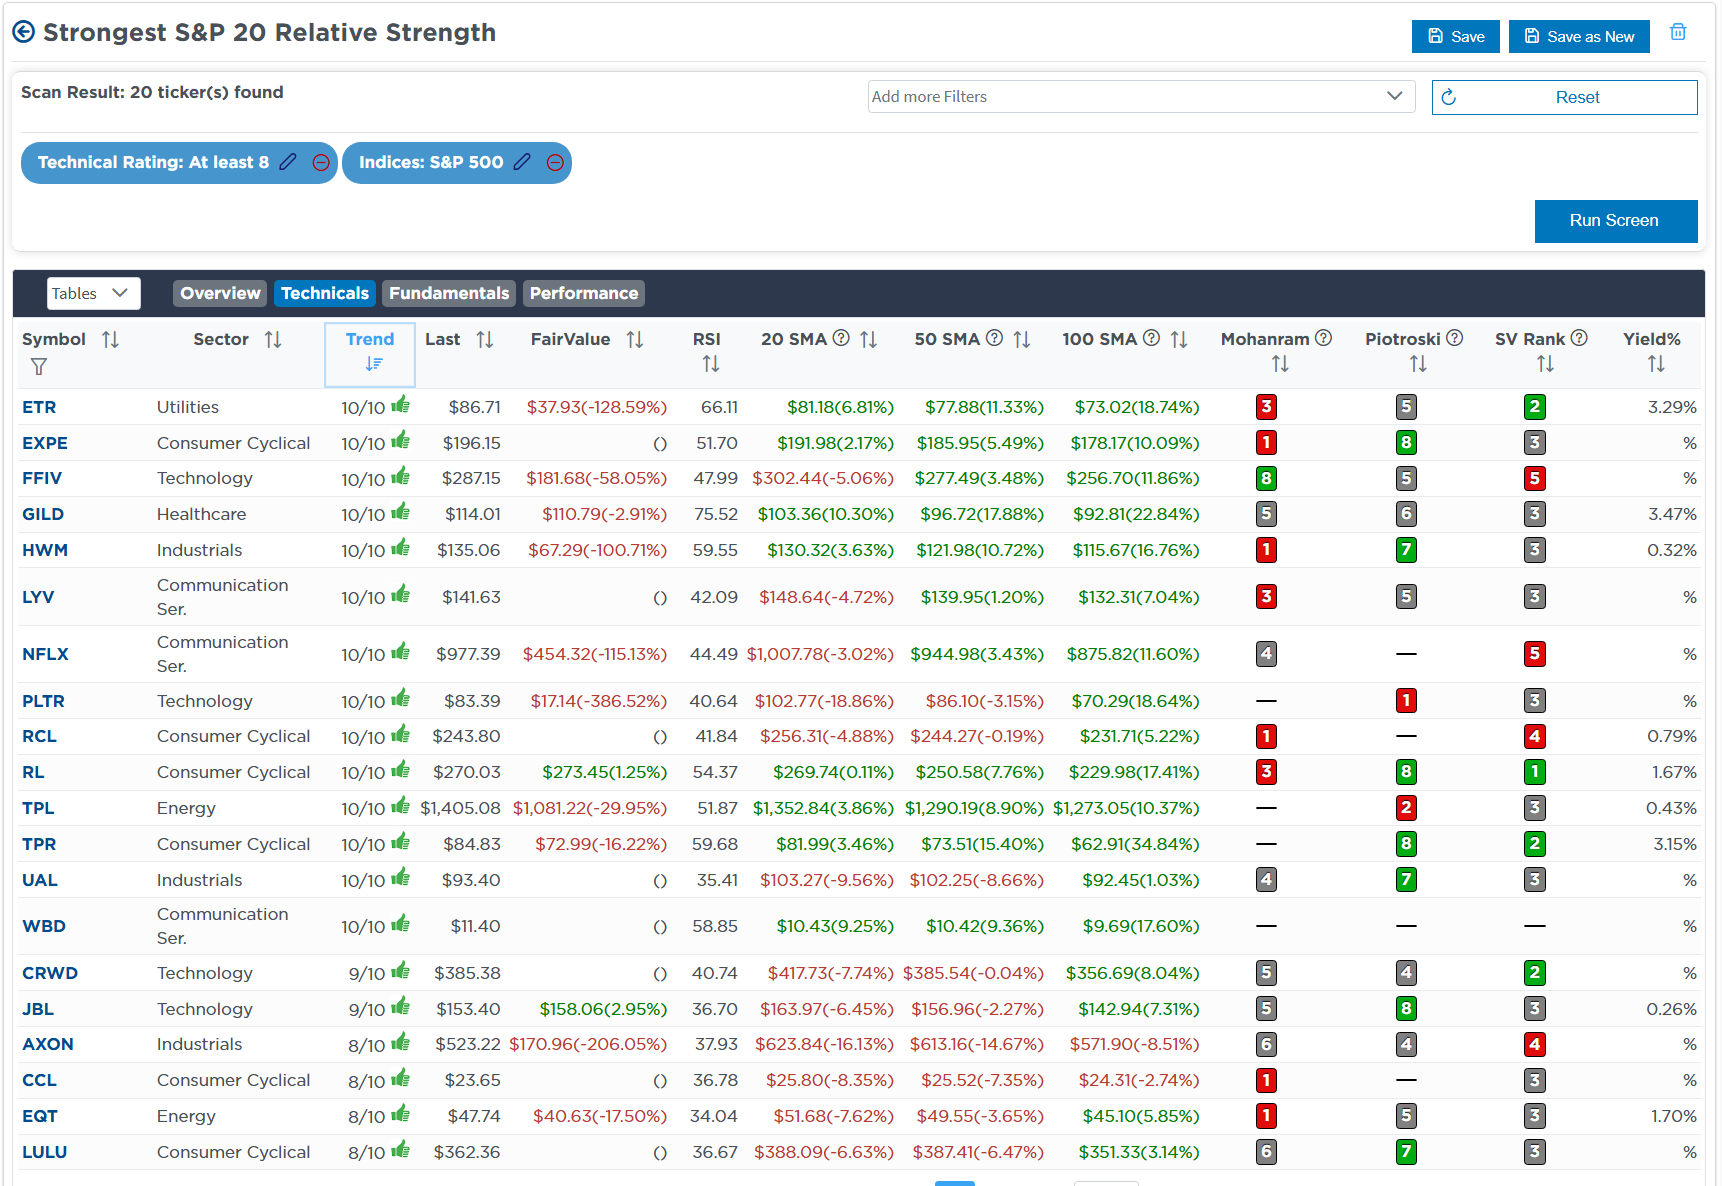
- Relative Strength Stocks
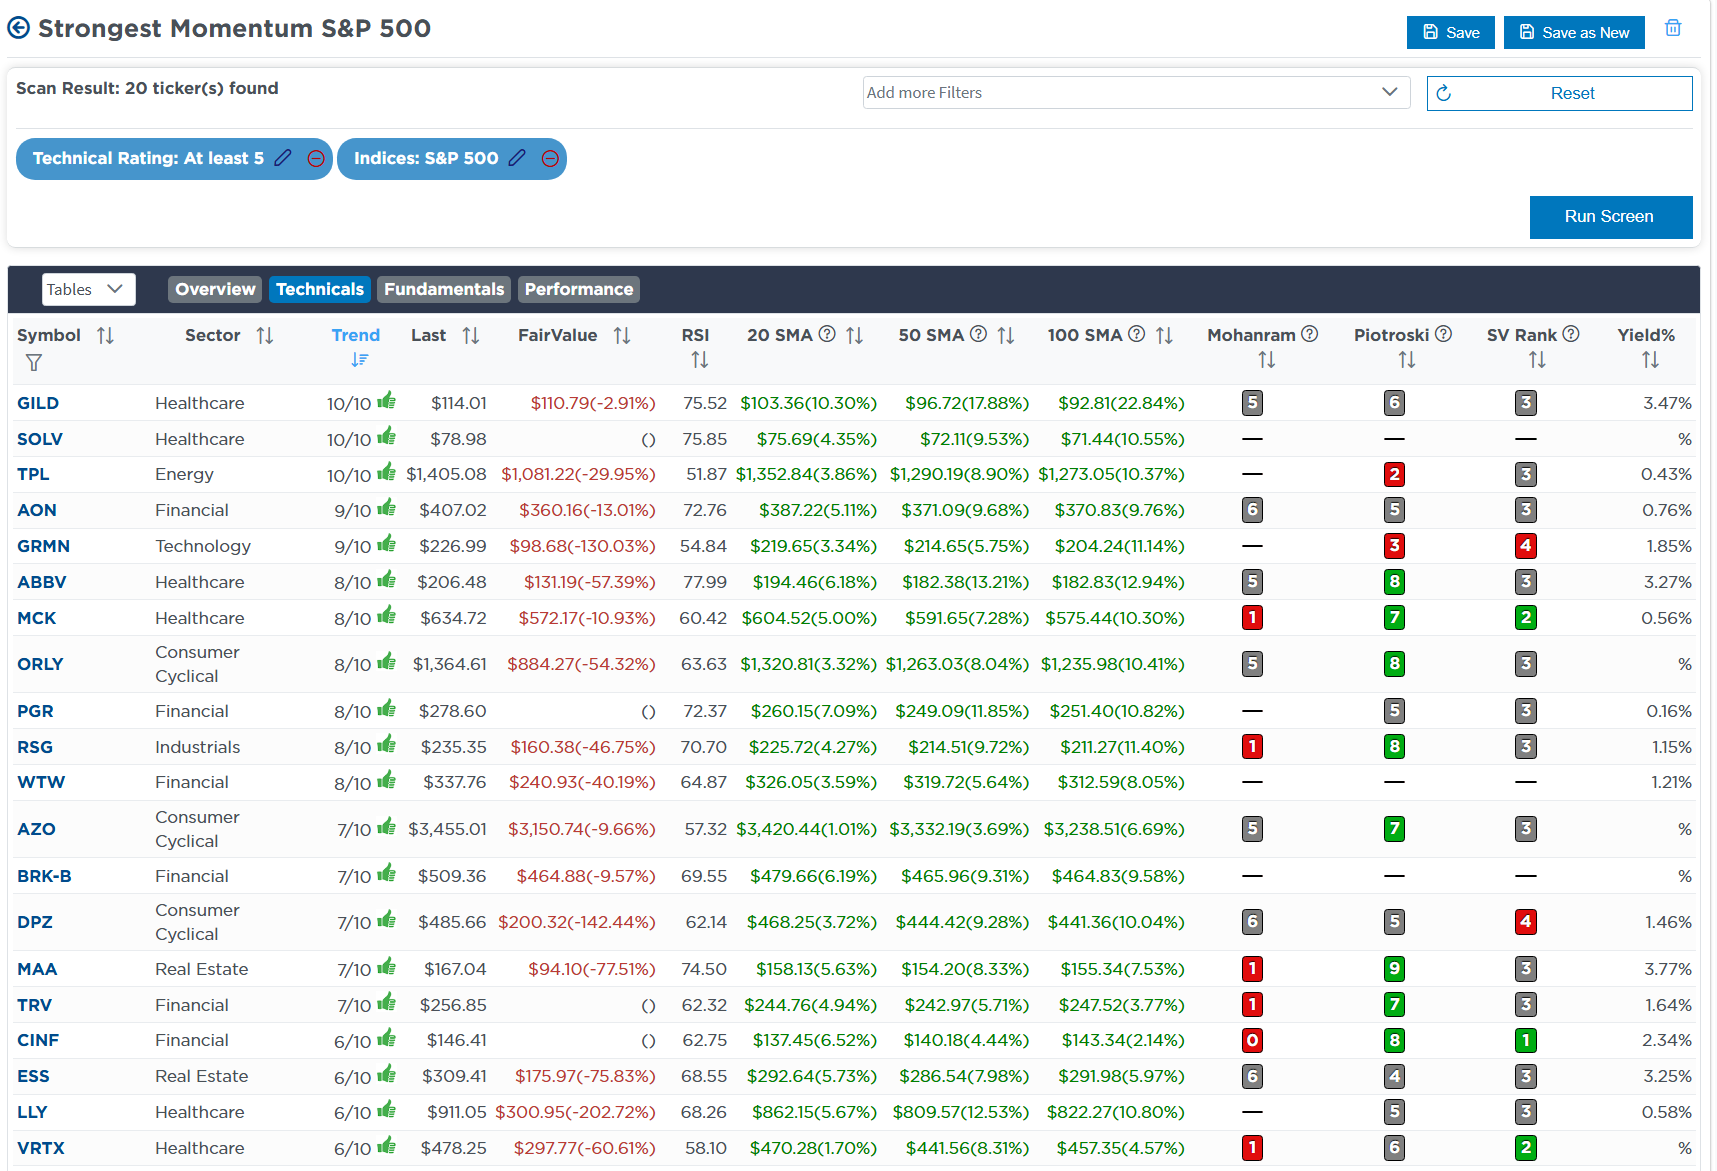
- Momentum Stocks
- Fundamental & Technical Strength W/ Dividends
(Click Images To Enlarge)
RSI Screen
Momentum Screen
Technically Strong With Buy Rating
SimpleVisor Portfolio Changes
We post all of our portfolio changes as they occur at SimpleVisor:
Feb 26th
"This morning, we are doing a tax loss harvest and swapping in the portfolio. We are selling all of AMD (AMD), which has been underperforming, and swapping it into Arista Networks (ANET). This swap provides two purposes to the portfolio. First, it diversifies the portfolio into hardware on the technology side, to which we had no exposure. Secondly, it reduces our exposure to semiconductors ahead of the Nvidia (NVDA) earnings report tonight.
If NVDA reports well, that report should benefit ANET, which is very oversold, and AMD. However, a poor report would likely impair AMD more than ANET. While we still like AMD, the swap reduces the portfolio risk overall."
Equity Model
- Sell 100% of AMD
- Initiate a 1% of the portfolio position in Arista Networks (ANET)
Lance Roberts, C.I.O., RIA Advisors
The post CFNAI Index Suggests Economy Is Slowing appeared first on RIA.
Full story here Are you the author?Tags: Featured,newsletter