Inside This Week's Bull Bear Report
- Election Over. What's Next For The Market
- How We Are Trading It
- Research Report -Election Take On The Market
- Youtube - Before The Bell
- Market Statistics
- Stock Screens
- Portfolio Trades This Week
S&P 6000...Already?
Last week, we discussed the expected derisking heading into an uncertain election.
"There is an important lesson in this week's action. Over the last several weeks, we have warned about the weakening of momentum and relative strength and the triggering of the MACD 'sell signal.' However, many followers commented that the market kept rising despite my warnings and "this time was different." The lesson is that while technical analysis is NOT perfect, the signals derived from the analysis are often a good process to follow. As always, "timing" is the most difficult challenge. The indicators told us that the market would likely "derisk" before the election, which is now evident."
With the election over and the Federal Reserve cutting the overnight lending rate by another 25bps, many of the headwinds the market was hedging for are now behind us. As a result, the market surged higher, hitting our year-end target of 6000 on Friday. Furthermore, since election day, the "RE-risking" rally reversed the short-term sell signal, supporting higher prices. As we stated over the last few weeks, despite the many media-driven narratives, the underpinnings of the market remained bullish, suggesting the recent pullback to the 50-DMA was a buying opportunity.

Of course, much speculation exists about what will occur under a Trump presidency. Here is our short take.
The potential economic and market impacts are based on continuing pro-business policies and tax reform, likely involving making the Tax Cuts and Jobs Act permanent, which removes uncertainty about future tax rates. This should support growth and incentivize domestic investment. The regulatory environment would remain business-friendly, with potential rollbacks in areas like environmental restrictions and financial oversight to foster economic expansion.
Trump will likely maintain an aggressive stance on trade, particularly toward China. This could mean higher or expanded tariffs, which may negatively impact global trade flows and supply chains but benefit select U.S. industries like steel and manufacturing. Those tariffs could lead to heightened market volatility, at least initially. The resulting trade tensions and a "tit-for-tat" policy response could pose problems. However, certain sectors, such as energy, defense, and traditional manufacturing, could benefit from Trump's policies, while technology and companies heavily reliant on international markets might be impacted in the short term.
Immigration policies will tighten further under Trump, potentially affecting labor markets and sectors dependent on foreign workers, such as agriculture and technology. The risks of restricting the labor pool are unknown. Still, they could have mixed economic effects, potentially raising wages for some domestic workers but increasing costs for industries reliant on lower-wage labor.
Given that outlook, it is undoubtedly worthwhile continuing to manage risk. While the backdrop is near-term bullish for stocks, it doesn't mean there will not be corrections along the way.
Need Help With Your Investing Strategy?
Are you looking for complete financial, insurance, and estate planning? Need a risk-managed portfolio management strategy to grow and protect your savings? Whatever your needs are, we are here to help.

Election Over. What's Next For The Market
Over the last few weeks, much discussion has been held about the 2020 presidential election. Thankfully, that is now behind us, and we can begin to look forward to how the market is expected to perform under a new Administration.
The recent selloff in the market heading into the election was not unexpected. Over the past 10-election Novembers, the market has fallen 50% of the time. This year, the probability of a "derisking" event heading into a highly divisive election with an uncertain outcome was elevated.
But here is the important point for investors as we look forward: Historically, the market has not cared who the president is. Over time, as discussed last week, the market responds to earnings growth, a function of economic growth. To wit:
"The reason is that the annual rate of change in earnings is the best indicator for understanding where the market will be. As shown, there is a decent correlation between the annual rate of change in earnings versus the annual rate of change in the market. Therefore, if the earnings growth rate continues to slow, which should be expected with a slowing economic growth rate, the market’s growth rate should also slow."

Given that earnings are currently expected to grow rather strongly into 2025, the market should be expected to follow suit.

Of course, investors should be cautious of current earnings expectations, which are at the top of the long-term growth trend channel. Historically, such levels have denoted a peak in the earnings growth cycle, which would coincide with an economic slowdown or recession. However, barring a sudden and unexpected exogenous shock to the financial system, markets should track earnings growth.
Given the uncertainty of the impact of new policies and agendas on the economy, I don't want to discount market risk in the short term completely. However, as YahooFinance pointed out this week:
"The S&P 500 has been up an average of 10.68% in the year following elections dating back to 1960. That's right in line with the standard average return for the S&P 500 over time. It's one of many signs that while the election could very well bring some turbulence to markets over the next few days, particularly if there isn't a clear winner, it rarely halts the long-term trend."

With the risk of a contested election removed, the previously unknown risk is now known, and markets are factoring that outcome into earnings and economic and financial estimates. Most notably, elections are no different from any other market risk, and the critical question is what the impact will be on future earnings.
The President Has Much Less Impact Than We Think
Here is what we know about how markets have performed under both parties through historical election cycles. Throughout past elections, markets have performed well except for Bush and Nixon. George Bush walked into a historic market bubble in the Dot.com sector from the previous 20 years, and the outcome would have been no different if Al Gore had won. Richard Nixon was also unlucky in his timing to be President, as the Iran oil embargo led to a massive surge in inflationary pressures and collapsed the "Nifty 50" market bubble.
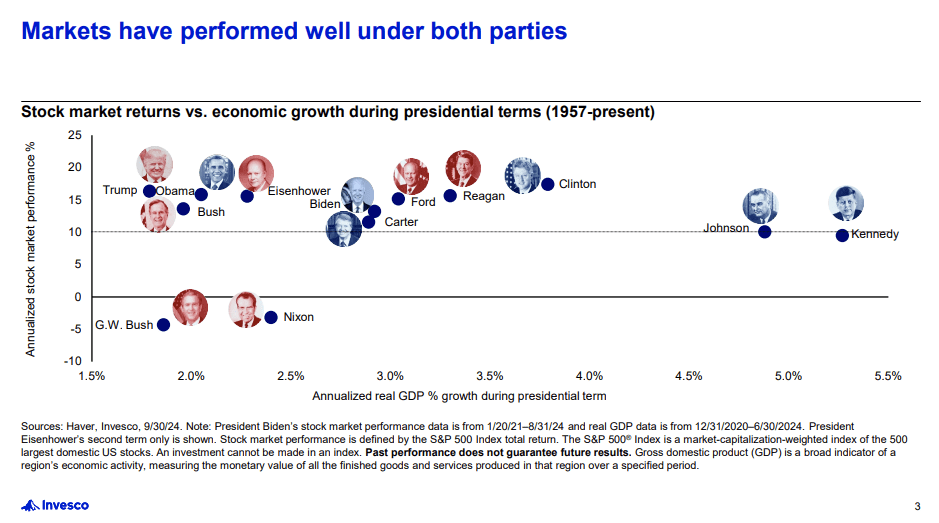
While this election was considered "the most important in our lives," such rhetoric has mattered little to the financial markets.
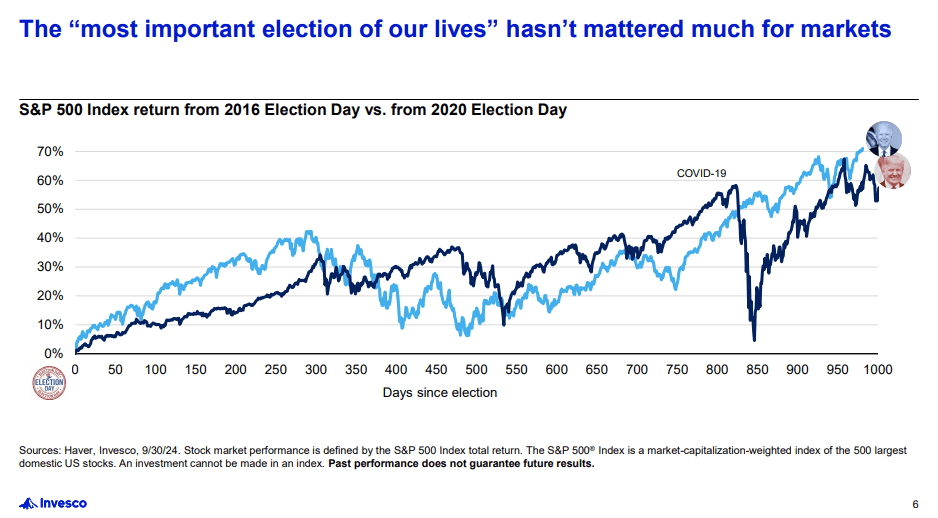
Most importantly, no party has ever "radically re-engineered" the economy. Maybe this time will be different, but we will find out over time and respond accordingly.
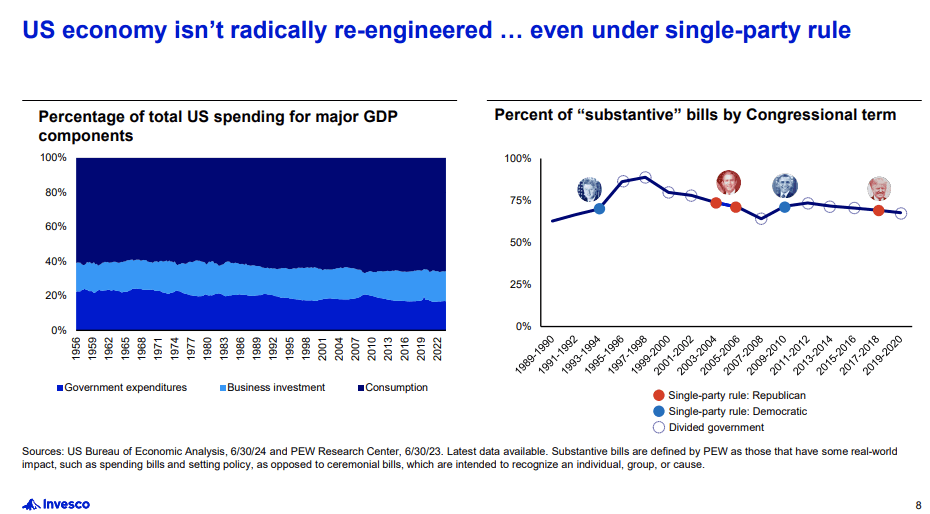
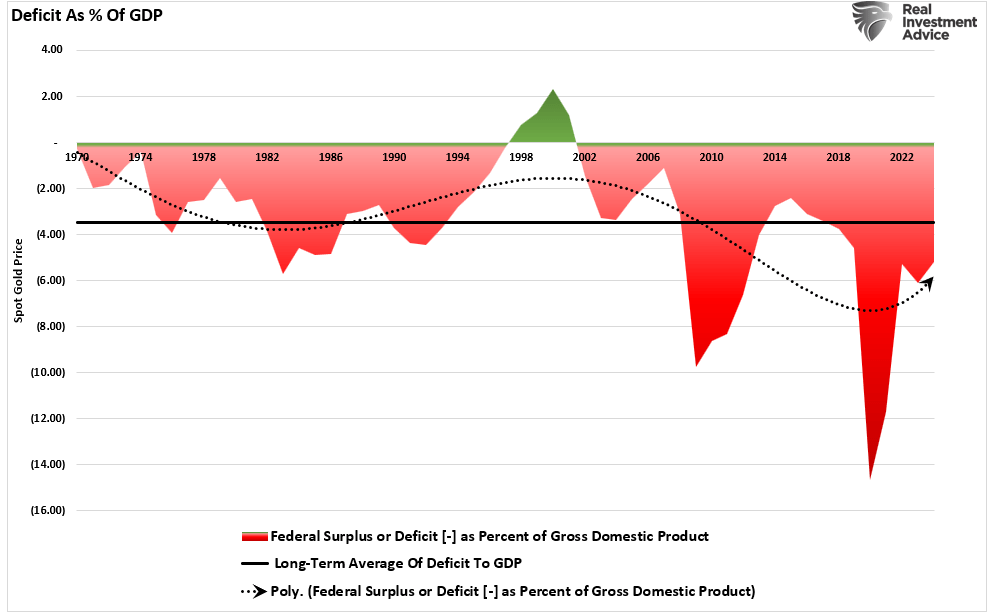
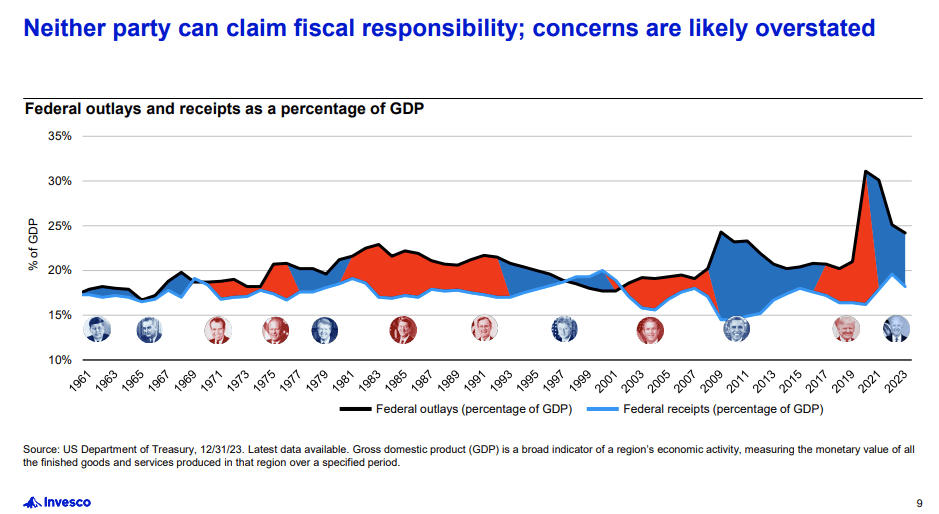
Furthermore, the deficit, a repeated concern of bond bears, deficit hawks, and those selling gold, is declining. However, neither party can claim fiscal responsibility. The concerns over the deficit and the debt remain overstated.
Furthermore, Federal Receipts and Outlays are returning to the historical trends.
With the election over, investors must focus on what drives markets over the longer term: economic and earnings growth. Given that the economy has grown on average at roughly 6% since 1900, the financial markets have also grown outside of financial shocks and economic depressions.

The point is that before you make a rash decision to stay out of the market because you "don't like the President," just remember:
"The market probably doesn't care."
Looking Forward Into Year-End
With the election behind us, all eyes will focus on the end of the year. As discussed on Wednesday, market returns are fairly standard across elections and tend to rise into year-end. This is because share repurchases, year-end performance chasing, and momentum will support higher prices into the end of the year. With the market rallying to new all-time highs following Trump's presidential victory, the demand for equities will likely remain strong for several more weeks.
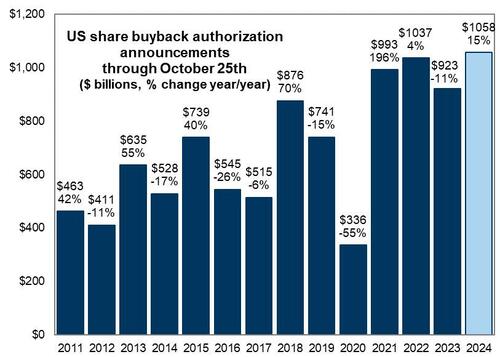
However, the market tends to fade through the inauguration because it reverses the previously overbought and extended conditions.
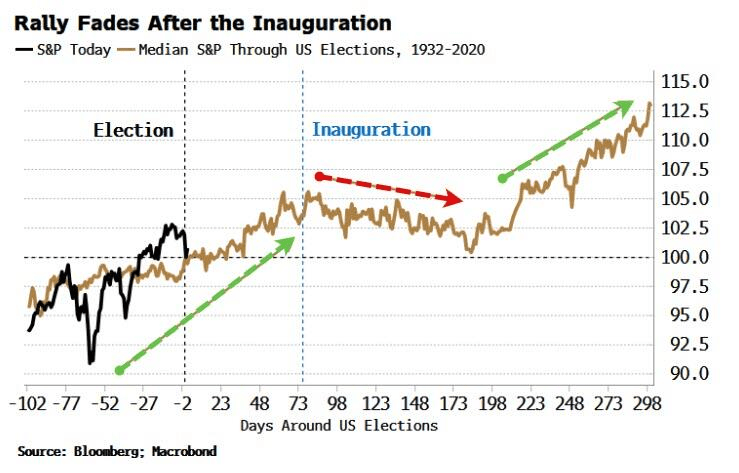
On a weekly view, the market is extremely overbought and extended. With the index at the top end of its long-term trend channel, investors should brace for lower returns next year and increased volatility. Such could be due to the impact of policies, slower economic growth, or geopolitical events. We never know what causes it, but over the last 15 years, deviations from the long-term moving average of this magnitude regularly experience mean reversion.

However, that is a story we will deal with next year. Our year-end target for the S&P 500 remains 6000, which was hit on Friday. That doesn't mean there will not be some pullbacks and consolidations along the way, particularly in early December, as mutual funds process their annual distributions and perform tax loss selling. Historically, the markets tend to experience some weakness heading into the Christmas holiday, which precedes the "Santa Claus Rally" into year-end.
How We Are Trading It
As another doom-and-gloom narrative falls by the wayside this week with the election of President Trump, the world didn't erupt into a civil war, and the market didn't crash.
While market downturns and economic slowdowns generate sensational headlines, history shows that stocks generally recover and continue to grow over time. Pessimistic forecasts often ignore vital economic factors, like innovation, productivity gains, and monetary policy responses, which can offset negative trends.
Reacting impulsively to bearish projections can hurt your portfolio. Selling in a panic or abandoning a long-term strategy locks in losses and risks missing subsequent rebounds. Data indicates that staying invested, even through downturns, leads to better outcomes than trying to time the market.
Remember: the stock market reflects both challenges and opportunities. Instead of focusing on worst-case scenarios, take constructive actions:
- Build a diversified portfolio and adjust based on evidence, not fear.
- Keep perspective,
- Focus on your financial goals and;
- Communicate with your financial advisor to remain steady amid uncertainty.
As long-term investors, we should focus on broader economic fundamentals rather than short-term political shifts. Remaining calm, balanced, and well-diversified will help investors weather whatever outcomes unfold in the future.
With the election behind us, we can now use small pullbacks and consolidations to add exposure as needed to bring portfolios to target weights. Pullbacks will likely be shallow, but being ready to deploy capital will be beneficial. Once we pass the inauguration, we can assess what policies will likely be enacted and adjust portfolios accordingly.
While there is no reason to be bearish, this does not mean you should abandon risk management.
Feel free to reach out if you want to navigate these uncertain waters with expert guidance. Our team specializes in helping clients make informed decisions in today's volatile markets.

Have a great week.
Research Report
Subscribe To "Before The Bell" For Daily Trading Updates
We have set up a separate channel JUST for our short daily market updates. Please subscribe to THIS CHANNEL to receive daily notifications before the market opens.
Click Here And Then Click The SUBSCRIBE Button
Subscribe To Our YouTube Channel To Get Notified Of All Our Videos
Bull Bear Report Market Statistics & Screens

SimpleVisor Top & Bottom Performers By Sector

S&P 500 Weekly Tear Sheet
Relative Performance Analysis
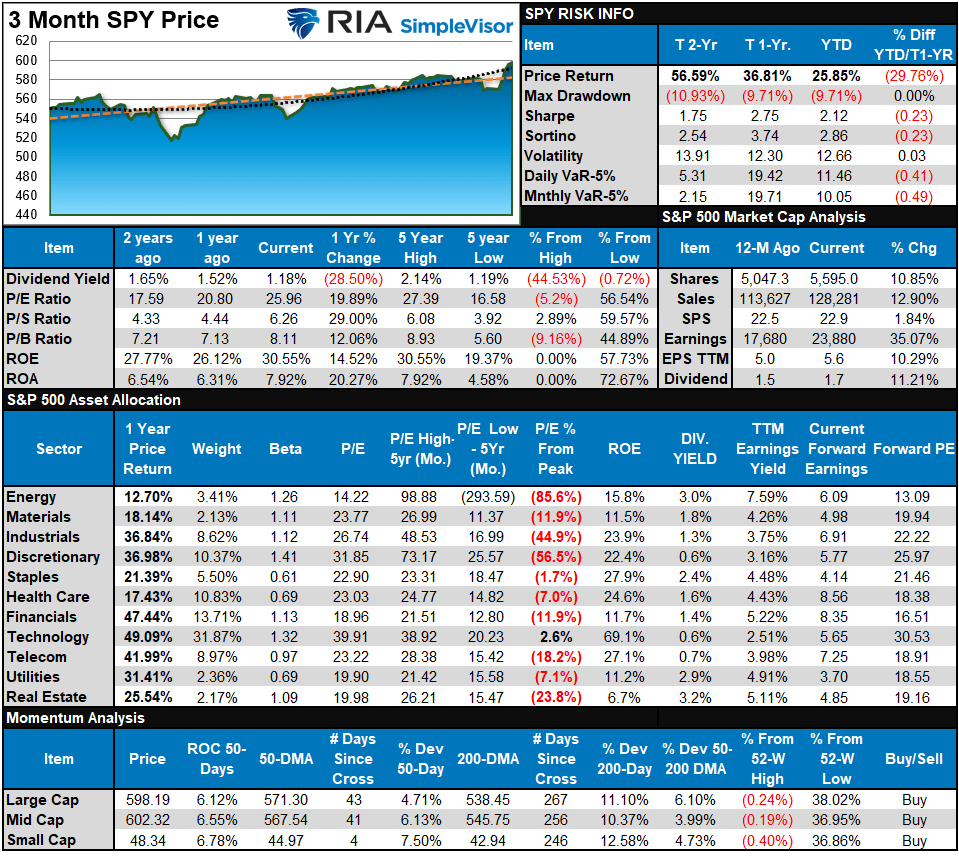
Last week, we noted that "...over the past two weeks, that correction has taken place, and now most markets and sectors are oversold heading into the election. We were looking for this setup to support a rally into year-end. Once we get through the election and the FOMC meeting next week, the market should start to find its footing as buybacks and performance chasing take precedence into year-end."
Such occurred as the previous "de-risking" of portfolios reversed to "re-risking," leading to a massive market surge. With the markets short-term overbought, a bit of a breather is likely over the next week or two as we head into Thanksgiving. Taking profits and rebalancing positions remains a suggested course of action, but maintain exposure heading into year-end.

Technical Composite
The technical overbought/sold gauge comprises several price indicators (R.S.I., Williams %R, etc.), measured using "weekly" closing price data. Readings above "80" are considered overbought, and below "20" are oversold. The market peaks when those readings are 80 or above, suggesting prudent profit-taking and risk management. The best buying opportunities exist when those readings are 20 or below.
The current reading is 90.34 out of a possible 100.

Portfolio Positioning "Fear / Greed" Gauge
The "Fear/Greed" gauge is how individual and professional investors are "positioning" themselves in the market based on their equity exposure. From a contrarian position, the higher the allocation to equities, the more likely the market is closer to a correction than not. The gauge uses weekly closing data.
NOTE: The Fear/Greed Index measures risk from 0 to 100. It is a rarity that it reaches levels above 90. The current reading is 74.07 out of a possible 100.

Relative Sector Analysis

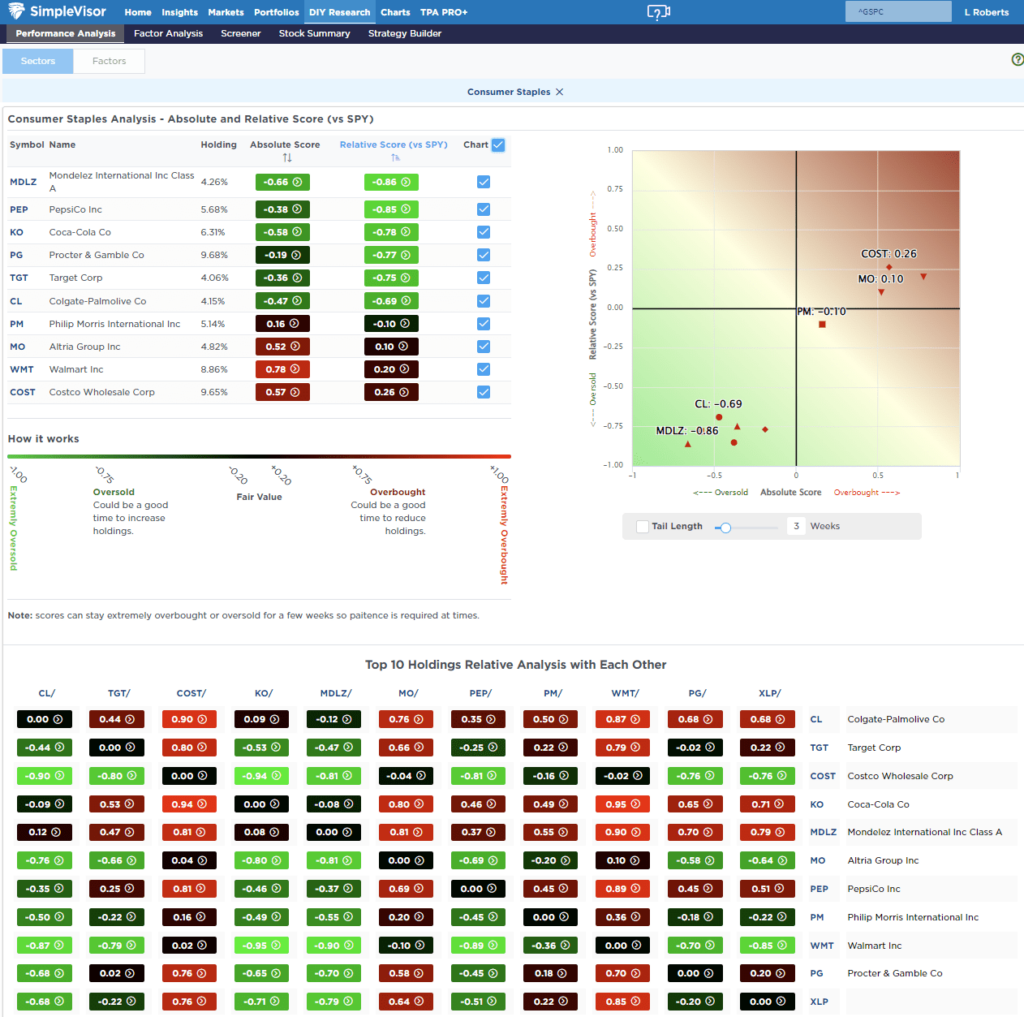
Most Oversold Sector Analysis
Sector Model Analysis & Risk Ranges
How To Read This Table
- The table compares the relative performance of each sector and market to the S&P 500 index.
- "MA XVER" (Moving Average Crossover) is determined by the short-term weekly moving average crossing positively or negatively with the long-term weekly moving average.
- The risk range is a function of the month-end closing price and the "beta" of the sector or market. (Ranges reset on the 1st of each month)
- The table shows the price deviation above and below the weekly moving averages.
As the Relative Performance Analysis above notes, the market has quickly moved into more extreme short-term overbought conditions. While the market remains bullish, and exposure should be maintained, the more drastic moves last week need to "pause" momentarily. Take profits and rebalance risks, but maintain allocations overall.

Weekly SimpleVisor Stock Screens
We provide three stock screens each week from SimpleVisor.
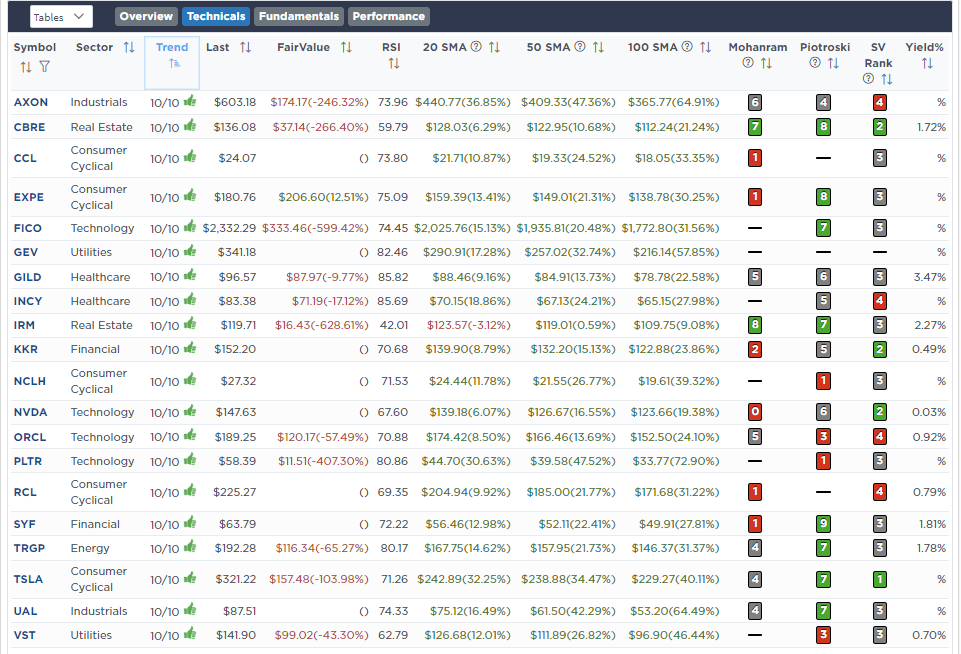
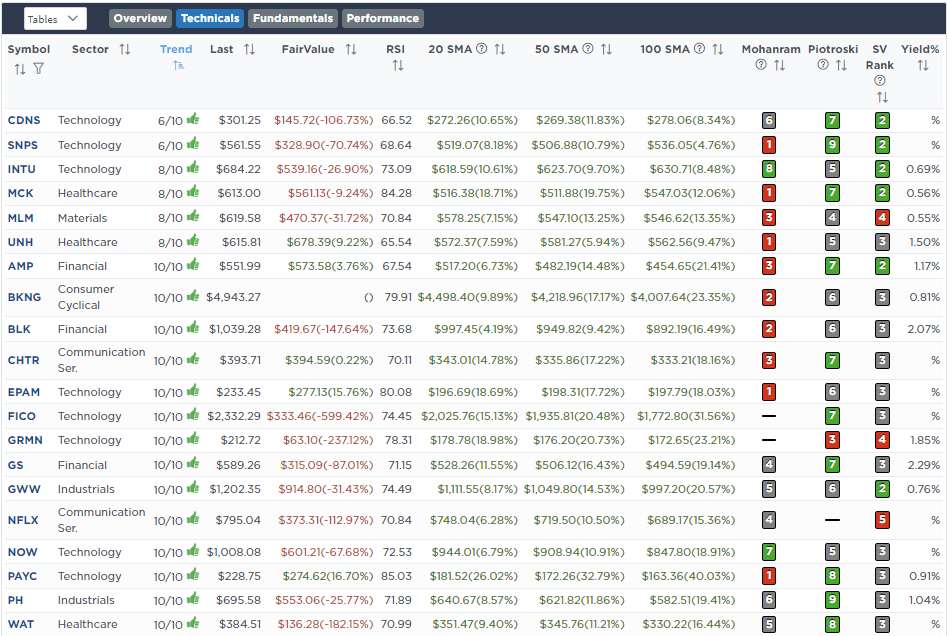
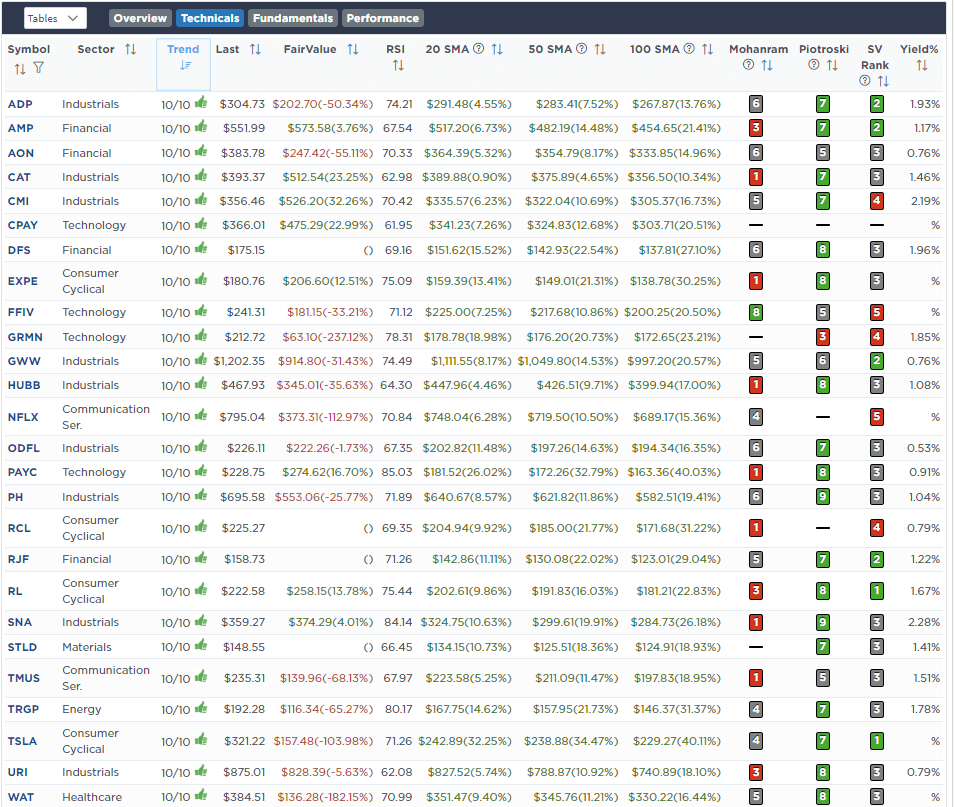
This week, we are searching for the Top 20:
- Relative Strength Stocks
- Momentum Stocks
- Fundamental & Technical Strength W/ Dividends
(Click Images To Enlarge)
RSI Screen
Momentum Screen
Fundamental & Technical Screen
SimpleVisor Portfolio Changes
We post all of our portfolio changes as they occur at SimpleVisor:
Nov 7th
With the election behind us, we are rebalancing the Equity and ETF models and adding some Small/Mid-cap exposure. We are also bringing the Dividend Equity Model up to total weighting for the rest of the year. In the Dividend Equity Model, the maximum weighting of the top 6 stocks is 6% each. The remaining 20 are weighted at 3.33% each. We also leave 2-3% in cash for future needs.
For all portfolio weightings, CLICK HERE and view each model position for the current market weight. The weights are never exact, but you can round to the nearest half percentage. For example, if Apple (AAPL) is 4.16% of the portfolio, its weight is 4%.
Equity Model
- Add 1% of the Russell 2000 Index ETF (IWM) to the portfolio.
- Sell 100% of Stanley Black & Decker
- Increase Ely Lilly to 3% of the portfolio.
ETF Model
- Add 1% of the Russell 2000 Index ETF (IWM) to the portfolio.
Dividend Equity Model
Please review the model for all current holdings and weighting changes.
- Sell 100% of Stanley Black & Decker (SWK)
- Add 3.33% of International Business Machines (IBM)
Lance Roberts, C.I.O.
Have a great week!
The post Election Over. Now What For The Market. appeared first on RIA.
Full story here Are you the author? Previous post See more for Next postTags: Featured,newsletter


