Official inflation statistics are biased. Substitution effects and quality changes are problems that cannot be resolved objectively, even with the most sophisticated statistical methods. It may be that the Harmonized Index of Consumer Prices (HICP) overestimates inflation. There are also good arguments for a downward bias. It may also be that the errors in measuring consumer price inflation are negligible. However, even if official statistics show unbiased average inflation for all goods included in the index, problems arise.
Official inflation figures are by no means representative of the general rise in prices in the economy. If we look at the goods and services not included in the index, the direction of the distortion seems indisputable. Its scale is also considerable. Official statistics embellish the problem of inflation.
Goods and services provided by the government are a case in point. One might loosely refer to them as “public goods,” even though most of them do not meet the formal criteria of nonrivalrousness and nonexcludability, and some people might not even think of them as goods at all. “Public goods” here simply means that they are financed by taxpayers. Such goods and services are not included in conventional inflation measures.
In Europe, for example, the HICP is used. It only reflects price trends for private consumer goods. All government spending on infrastructure, education, health, defense, and many other areas is not taken into account. Admittedly, there are subcategories such as “education” and “health” in the HICP. However, they only cover additional private spending. Government spending on these goods and services is neglected. This explains why, for example, education and health only account for 0.9 percent and 4.9 percent of the overall index for the eurozone on average. This may sound laughably small for Americans, but Europeans also spend considerably more on education and health overall than it appears. Most of this spending, however, is publicly financed and therefore plays no part in official inflation statistics.
When it comes to measuring potential inflation in the prices for public goods, a problem arises. Public goods are not traded on markets like other goods. There is no market price for education at a public university. There is no market price for most medical services. So, how can we measure the rise in prices of public goods?
While households do not pay directly for public goods, they do pay indirectly through taxes. It can therefore be said that the total tax burden represents the price of all public goods supplied by the state. If we assume that total government tax revenues represent the price of all public goods, we also save ourselves the tedious task of assessing the weighting of individual public goods.
The chart below shows how tax revenues have evolved in relation to the HICP in the eurozone. The nineteen countries that were part of the eurozone in 2022 are taken into account. It can be seen that tax revenues have risen significantly faster than consumer prices. To be precise, tax revenues rose more than twice as fast up to 2021. The HICP rose by a total of 47 percent between 1998 and 2021, corresponding to an average annual inflation rate of 1.7 percent. Total tax revenues for eurozone countries have risen by a total of 99 percent, corresponding to an overproportionate increase in public goods prices of 3.0 percent per annum on average.
According to this calculation, public-goods price inflation is therefore, on average, 1.3 percentage points higher than consumer price inflation. Against this backdrop, the quality of public goods and services is held constant, even if it’s not uncommon to hear complaints about declining quality: poor educational results, dilapidated infrastructure, lack of medical care, and longer waiting times in administrations and public services. The list goes on. If these losses in quality were taken into account, the gap between the inflation rate for public goods and officially measured consumer price inflation would be even greater.
Figure 1: Inflation in the nineteen countries of the eurozone, 1998–2022
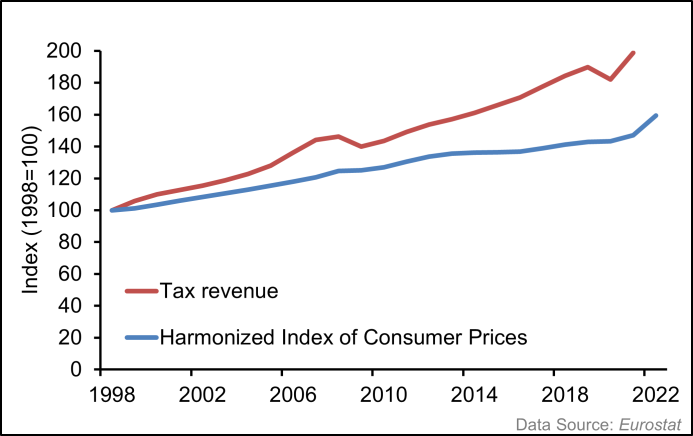
Source: Data from “Inflation in the Euro Area,” Eurostat, last modified September 29, 2023.
Moreover, the weight of public goods in total household spending is enormous. In the nineteen countries of the eurozone, tax revenues represent more than 40 percent of total income measured by gross domestic product. Tax-financed public goods are by far the biggest item in the average household’s “shopping basket.” The prices of these goods are rising disproportionately, but they are not taken into account in official statistics.
Full story here Are you the author?Tags: Featured,newsletter