Prices pressures are abating, albeit gradually, while economic momentum is faltering. The data in the coming weeks will help shape expectations for rate decisions for September. As the market pushed back against the Federal Reserve's forward guidance that anticipated two hikes in the second half, the US dollar fell against the G10 currencies, but found support beginning around the middle of the July as the market was reluctant to return to pricing in a cut this year and doubts rose about the extent that the European Central Bank and the Bank of England would raise rates.
The dollar's recovery is likely to extend into August, perhaps, encouraged by the risk of the first increase in the US year-over-year headline CPI since June 2022, when it peaked slightly over 9%. The US economy is looking more resilient than Europe and its 2.4% annualized growth in Q2 appears to put it at the top of the G7. We suspect the risk of a September Fed rate hike is greater than the market, which has less than a 20% chance discounted.
Although there remain worrisome economic signs, including rising debt-stress levels, the inverted yield curve, and the pace of decline among the leading economic indicators, several cyclical indicators are improving, such as several housing indicators and auto sales. Job growth is slowing, and peak tightness looks to be behind us, but it remains robust. At 3.6% in June, and expected to be unchanged in July, the unemployment rate remains well below the median Federal Reserve forecast of 4.1%. Still, the consensus view is a dramatic slowdown in H2, driven to a large extent by a pullback in the consumer, and if this does not materialize quickly, the risk of a September hike will likely rise. Such a scenario is also consistent with a stronger dollar.
The tightening of lending criteria in the US began prior to the March bank stress. Commercial and industrial loan growth has softened marginally, but the reliance on the capital markets, arguably reduces the blow. In Europe, dependency on bank lending makes the tightening of credit standards and the decline in loan demand more potent. Business and consumer confidence in Europe is also weaker than in the US. Moreover, the eurozone data has mostly been disappointing while US data has been more mixed.
For the first time in nearly eight years, Japan's headline CPI in June was above the US (3.3% vs. 3.0%). Of course, the weightings of the respective baskets are quite different. Japan's CPI gives housing less weighting (21.5% vs. 33.3%), and transportation (9.1% vs. 16.9%), but food and beverages get a higher weight (26.0% vs. 15.1%) and recreation (9.1% vs. 6.7%). Japanese subsidies electricity and gas are set to expire at the end of September. Still, Japanese inflation appears to be peaking and demand factors do not appear robust.
China has become more opaque. Access to data has become more limited. While there have long been questions about the veracity of Chinese data, other data points allowed a triangulation of government estimates. This has become more difficult. Still, there is a sense that although the 5% growth target this year is achievable, there is widespread perceptions of dissatisfaction. Chinese officials want to boost consumer spending, and although details are sparse, household goods and electric vehicles are the focus. Also in vague terms, the Politburo endorsed efforts to boost the private sector.
The base effect points to a negative July CPI print (August 8), but prices are likely to stabilize as Q3 proceeds. Housing is the largest drag on GDP and the official 18% decline in new house sales in June likely understates the case. Exports are also falling and the 13% year-over-year decline in June was the worst since the early days of the pandemic. Beijing still appears reluctant to enact the kind of structural reforms that would boost confidence among international investors that a corner has been turned. Nevertheless, many global fund managers appear underweight China and there is scope for some catch-up gains.
The combination of Russia's withdrawal from the agreement to allow the shipping of Ukraine grain, and its subsequent bombing of food depots, the historically hot summer in various parts of the world (El Nino), and some protectionism to help insulate domestic producers (India export ban non-basmati white rice) drove up grain prices in July. In June, the United Nation's World Food Price Index had fallen to its lowest level in more than two years. Meanwhile, as the OPEC+ cuts in output began biting, the price of crude oil rose 11-12% in July. The rally in foodstuffs and energy helped drive the CRB commodity index almost 8% higher in July, the most since May 2022. If sustained, inflation worries may resurface.
The BRICS meeting begins August 22, a week after the 52nd anniversary of the US decision to end the remaining formal links between the dollar and gold (Bretton Woods), ushering in the current era of floating exchange rates. The meeting has captured the imaginations of many with some suggestion that a gold-backed currency could be launched that would ostensibly rival the dollar. There have been other suggestions that a new trade settlement token, also backed by gold, could be considered. We doubt that anything along these lines will be adopted. It seems quite clear that China and India, for example, prefer to work toward further internationalizing their national currencies.
Moreover, as more countries apply to join the BRICS and its New Development Bank, we suspect that framing it as a rival bloc to the G7 will less helpful. When China first launched the Asian Infrastructure Investment Bank in 2016, many, including US officials, saw it as rivaling the World Bank. However, many US allies have joined, including the UK, Canada, Germany, France, and Australia. Rather than supplant the World Bank, it appears as a parallel institution, and whose subscriptions and loans are in US dollars.
Still, technological advancements and national ambitions have given rise to new payment systems that can settle bilateral trade in local currencies. These developments may reduce the dollar's use a means of exchange (One of the three functions of money identified by economists. The other two being store of value and unit of account). However, the dollar's function as a store of value for international savers (central bank reserves, pensions, etc.) remains intact. Here the depth, breadth, and transparency of the US Treasury market is unrivaled. And despite the references to the dollar's "exorbitant privilege," US interest rates are well above European and Japanese rates. The Federal Reserve offers custodial services to foreign official accounts. Since the end of Q1, the foreign holdings of Treasury and Agency bonds in the Fed's custody rose by almost $140 bln.
The MSCI Emerging Markets equity index rose by about 4.6% in July, its best performance since January. July was also the first month it outperformed the MSCI World Index of developed equity market (~2.4%) since January. Emerging market bonds also did well and the premium over US Treasuries (EMBI) fell to its lowest in 15 months. Emerging market currencies were mixed. The JP Morgan Emerging Market Currency Index was practically flat in July after falling each month in Q2. It is off about 1.4% year-to-date.
The MSCI Emerging Market Currency Index, which is slightly less inclusive than the JP Morgan iteration (22 vs. 25 constituents), is weighted by market-capitalization (vs. free-float and trade-weighted), rose by about 1.7% in July to bring the year-to-date gain to 2.6%. Yet these broad metrics miss some nuances. Year-to-date, Latam currencies are the top three performers among emerging markets (Colombia, Mexico, and Brazil), but in July, the only Latam currency to make it into the top four was the Colombian peso. On hand, the Argentine peso and Turkish lira were the weakest performers in July and remain on the bottomed of the rankings year-to-date.
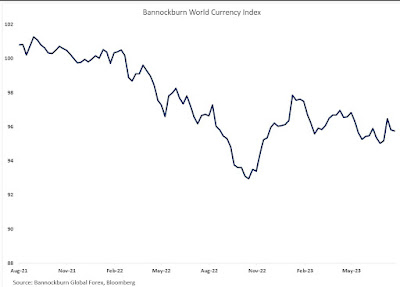
The BWCI appears to be indicating a broadly range-bound dollar. While we remain convinced the US dollar's cyclical peak took place last September/October, it is not clear that the tipping point has been reached in the sense of a strong downtrend. Instead, the BWCI continues to bounce along its trough. On the one hand, the market continues to resist the Fed's forward guidance on rates and arguably under-estimate the risks of additional tightening, and the poor news stream from Europe on the other marks the range. The significant aggregate speculative short dollar position in the futures market may be getting ahead of themselves, especially if the market converges toward the Fed.
Dollar: What has not happened in the US is arguably more important than what has happened. The much-anticipated recession has not materialized. Indeed, Q2 growth of 2.4%, was the fourth consecutive quarter that the economy expanded faster than the pace that Fed officials see as non-inflationary (1.8%). Despite the partisanship, the US did not default as had been threatened by the debt-ceiling brinkmanship. The banking stress that emerged in March has not been a harbinger of a larger financial crisis. An index of regional bank shares rallied 18% in July and is up about 35% from the May lows. An index of large bank shares rose 11% in July and is up by more than 27% from its lows. Three forces help explain these developments. First, median real wages in June were higher than pre-pandemic levels and the pre-pandemic trend. Second, fiscal policy has been more accommodative than expected. The deficit is tracking nearly double (~$1.84 trillion) the shortfall from FY22 (~$950 bln) as both revenues are falling shy of projections and expenditures are greater. Third, the actions by the Federal Reserve and launching the Bank Term Funding Program helped ringfence the stress. In addition, several financial agencies have called on banks to grant some forbearance for commercial real estate borrowers. The Federal Reserve delivered the widely expected quarter-point hike in late July. It did not back off from its June indication that two hikes are likely appropriate. After being critical of the Fed for being slow to stop QE and begin raising rates, the market has been reluctant to follow hawkish guidance. The futures market is pricing in less than 20% chance of hike before the end of the year.
Euro: The eurozone avoided a winter energy crisis, but growth has disappointed this year, while price pressures remain elevated. Despite the European Central Bank's persistent tightening through interest rates and its balance sheet, nominal rates adjusted for current inflation remain negative. This suggests that monetary policy may not be particularly restrictive, but the economic underperformance is real. The manufacturing sector is especially weak, which has hit Germany exceptionally hard. The ECB's June forecast was for 0.9% growth and 5.4% CPI. The risk is that growth undershoots, and among other things, this has a knock-on effect of lifting deficit/GDP figures. On the other hand, inflation is likely to fall sharply in the September-October period after jumping by 1.2% and 1.5%, respectively last year. The ECB's balance sheet is being reduced more than twice as fast as the Fed's. This year, the ECB's balance sheet has fallen by about 10% (and 19% since last year's peak). The Federal Reserve's balance sheet has shrunk by approximately 4.2% this year and around 7.5% from its peak. According to the OECD's measure of purchasing power parity, the euro remains historically under-valued (50%+). This means that euro-denominated assets, goods, earning streams, and labor are cheap for dollar-based investors. It does not mean that the euro will strengthen in the near-term. In fact, we suspect the risk in the coming weeks is for the euro to return toward $1.08 as the high confidence of a September ECB hike eases and the probability of a Fed hike increases.
(As of July 28, indicative closing prices, previous in parentheses)
Spot: $1.0115 ($1.0910) Median Bloomberg One-month forecast: $1.10 ($1.0945) One-month forward: $1.0135 ($1.0925) One-month implied vol: 6.7% (6.6%)
Japanese Yen: For the first time this year, the Bank of Japan adjusted its monetary policy. It modified its Yield-Curve Control stance by making the 0.50% cap a reference point and will conduct fixed rate purchases at 1.0%. Governor Ueda downplayed the efforts, noting that it does not expect the 10-year yield to rise to 1.0% and that the move was not a step toward normalization. The central bank raised this fiscal year's inflation forecast to 2.5%, which still implies an easing in price pressures, while shaving the next fiscal year's forecast to 1.9% from 2.0%. The BOJ's decision followed news that Tokyo's July CPI excluding fresh food and energy, which is a good guide of the national figure, rose to a new cyclical high of 4.0%. Also, officials may be more comfortable that a peak other G7 rates is nearby. The yen's outlook in the period ahead may be driven by two considerations. First, how much does the market test the new upper band of the 10-year JGB? We note that after the December 2022 surprise, the longer-dated JGB yields peaked within a month. Second, how close are US rates to their peak? The US 10-year yield made a marginal new high for the year in early July (~4.09%), is struggling to sustain above 4%.
Spot: JPY141.15 (JPY144.30) Median Bloomberg One-month forecast: JPY139.55 (JPY140.85) One-month forward: JPY140.500 (JPY143.60) One-month implied vol: 9.5% (10.7%)
British Pound: Ideas that strong wage growth and high price pressures would spur the Bank of England into a more aggressive rate course of 100-125 bp of tightening in the second half (four Monetary Policy Committee meetings) drove sterling a nickel higher in the first half of July. It reached $1.3140, the highest level since April 2022. Recall sterling had collapsed to a record-low near $1.0350 at end of last September. Softer than expected June inflation knocked sterling off its perch. June inflation rose 0.1%, which saw the year-over-year rate ease to 8.2% from 8.7%. The UK's two-year yield peaked around 5.55% in early July and fell below 4.85% three-weeks later. To be sure, the UK's core CPI is at a lofty 6.9% (7.1% peak in May), but the swaps market has just about given up on a 50 bp hike on August 3 (less than a 15% chance). The forward guidance is likely to be hawkish and the focus will turn to the July jobs and inflation reports around mid-August. However, officials will see the August data points before it meets next on September 21. Sterling found support in late July near $1.2760-80. However, the corrective forces may not be over. A break of the $1.2600-$1.2700 area could undermine the medium-term technical outlook.
Spot: $1.2850 ($1.2705) Median Bloomberg One-month forecast: $1.2775 ($1.2630) One-month forward: $1.2855 ($1.2710) One-month implied vol: 8.0% (7.8%)
Canadian Dollar: The Bank of Canada hiked the overnight target rate for a second consecutive month in July (to 5.0%). It does not meet until early September and the swaps market has a final hike discounted in Q4. Economic activity in Q2 appears to have slowed to around half of the Q1 3.1% annualized rate. Growth is expected to be halved again in Q3 (~0.6%) and again in Q4 (~0.3%). Headline inflation fell below 3% in June, but the base effect warns that price pressures may firm in Q3. Still, the underlying core rates are gradually moderating. The US dollar briefly traded below CAD1.3100 in mid-July for the first time since last September. This was slightly below the June low, but the exchange rate seems to be rangebound between CAD1.3100 and CAD1.3400. That said, shifting correlations suggest the drivers may be changing. The exchange rate seems less sensitive to the risk environment (for which we use the S&P 500 as a proxy). It has become more correlated with oil prices, and even more so with the CRB (commodity index). The exchange rate correlation with the two-year interest rate differential has also increased. Although the Canadian dollar was laggard in July (0.1%), but its volatility is lowest among the G10 currencies. Benchmark, three-month implied (embedded in option pricing) volatility is slightly below 6%. In comparison, the Antipodean's implied three-month volatility is above 10% and the Scandinavian currencies volatility are 11-13%. Talk of a cabinet reshuffle is getting louder, but key posts, including finance, industry, and defense are unlikely to change hands.
Spot: CAD1.3235 (CAD 1.3240) Median Bloomberg One-month forecast: CAD1.3220 (CAD1.3265) One-month forward: CAD1.3230 (CAD1.3235) One-month implied: vol 5.9% (5.9%)
Australian Dollar: The Australian dollar remained rangebound between $0.6600 and $0.6900 and traversed the range twice in July. The labor market is slowing gradually, and consumption is softening. Disappointing demand from China is also a headwind. Price pressures are moderating. This macro backdrop encouraged the central bank to stand pat in July, but August appears a tougher call. About 60% of the economists in Bloomberg's survey anticipates a hike, but the futures market is less sanguine with less than a 10% probability discounted. With the July composite Purchasing Manager Survey falling to 48.3, the lowest of the year and the softer than expected Q2 CPI, we expect another stand pat decision. However, even if the Reserve Bank of Australia does not hike rates in August, the swaps market is pricing in a hike in Q4 (~80% probability), under a new Reserve Bank Governor (Bullock), who replaces Lowe in September. The key to monetary policy may be the pace of that inflation falls. To achieve the RBA's forecasts, CPI needs to slow by about three-quarters of a percentage point in both Q3 and Q4.
Spot: $0.6650 ($0.6665) Median Bloomberg One-month forecast: $0.6675 ($0.6695) One-month forward $0.6660 ($0.6670) One-month implied vol 10.1% (9.7%)
Mexican Peso: Although the Mexican economy appears to have slowed in Q2, the peso dynamics remain favorable. There are two main considerations. First, with an overnight rate at 11.25%, the interest rate differential (carry) is attractive, and currency volatility is comparatively low. Second, Mexico's external account is strong. Exports and worker remittances are near record levels and direct investment inflows appear robust. Reports suggest that despite the minimum wage hikes in Mexico, labor costs are lower than China. The dollar fell to lows since late 2015 near MXN16.6250 in late July. Our next target remains around MXN16.50 and suspect it can draw closer to MXN16.00. Price pressures continue to recede, but the central bank is likely to remain on hold until Q4. Chile cut rates in late July, and Brazil is expected also begin an easing cycle in early August. There has been a counter-trend dollar bounce almost once a month this year and since the March US bank stress, they have been limited to 1-2%. Such "corrections" may offer opportunities to buy cheaper pesos.
Spot: MXN16.6870 (MXN17.1250) Median Bloomberg One-Month forecast MXN16.9250 (MXN17.3650) One-month forward MXN16.78 (MXN17.23) One-month implied vol 10.9% (9.1%)
Chinese Yuan: The dollar's broadly heavier tone and the People's Bank of China setting weaker dollar reference rates (than projected), helped the yuan stabilize in July. There were news accounts of state-owned banks selling dollars, and although officials appear to have used these banks in the past for intervention purposes, all their activity cannot be fairly ascribed to convert intervention. Often, market participants, driven by profit motivation, do the heavy lifting for policymakers, like when the market drove the US 2-year yield 50 bp higher from September 2021 when the Federal Reserve first signaled that policy was going to tighten until March 2022 when it delivered its first hike. Beijing is taking initiatives to support the real estate market, making overtures to the private sector, and is allowing companies to borrow more offshore. Still, officials seem reluctant to take bold economic steps. Housing and exports appear to be the main drags, and there has been increased attention on the high levels of youth unemployment. China's producer price index has been in negative territory since last October, the consumer price index may post its first year-over-year decline since early 2021. However, as the base effect fades, China's CPI is likely to begin recovering shortly. There is still scope for additional monetary easing, with a cut in reserve requirements possible before the end of Q3.
Spot: CNY7.1485 (CNY7.2535) Median Bloomberg One-month forecast CNY7.1440 (CNY7.1750) One-month forward CNY7.1170 (CNY7.2255) One-month implied vol 5.7% (5.9%)
Tags: Featured,macro,newsletter


