


Jeffrey P. Snider
My articles My offerMy siteAbout meMy videosMy books
Follow on:LinkedINTwitterSeeking Alpha
| Seems like ancient history given all that’s happened since, but on October 13 Treasury Secretary Janet Yellen announced a planned deluge of cash management bills in the wake of the debt ceiling resolution (the first one). The next day, China’s currency, CNY, broke free from its previous and suspiciously narrow range.
Speculating a connection a few days thereafter, I wrote:
|
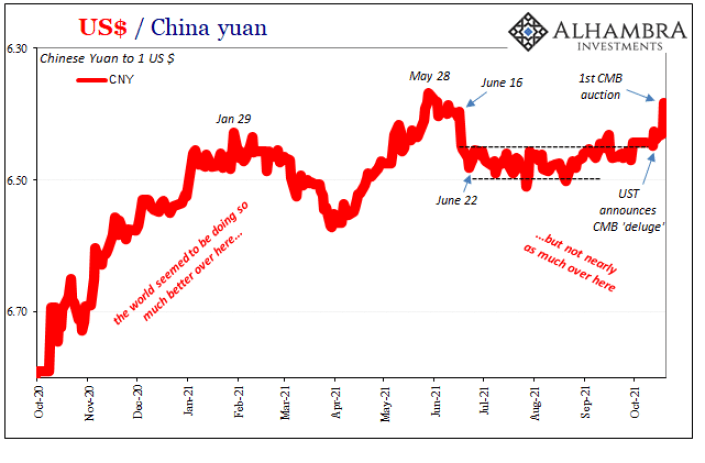 . |
| A welcome development for a truly bill-starved collateral marketplace which was then fed the first of these CMB auctions just yesterday, the 19th.
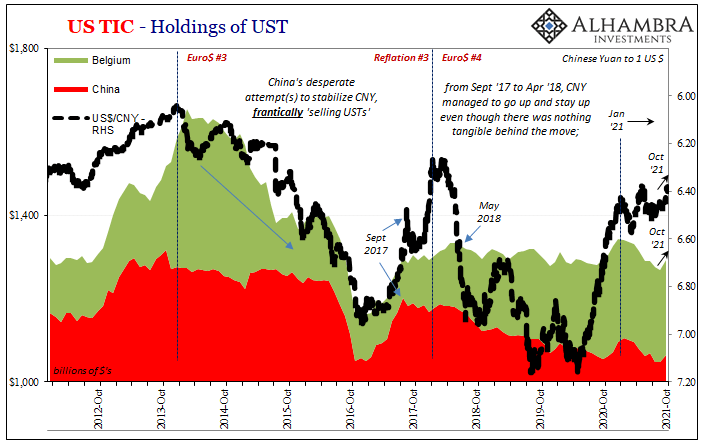
Fits very neatly into CNY’s recent range-busting appetite. It went something like this: a reprieve in eurodollar markets for Chinese borrowers by way of less scarce (meaning costly) collateral, more positive inflows pushing CNY upward and outside its prior range. More supply, more fluidity, less restrictive and expensive dollar funding in secured markets (both repo and derivatives formats) perhaps benefiting China’s dollar-heavy borrowers. Up to that time, we’d plenty of evidence which had indicated before October 13 the growing problem of collateral scarcity as one issue in the growing and disruptive dollar funding tightness. Regarding China specifically, in lieu of less restrictive funding conditions the Chinese since January have again been “selling their UST’s” attempting to make up the shortfall in the primitive way they (and others) had repeatedly throughout the last decade plus. So, it stood to reason that if collateral scarcity had contributed much to dollar tightness which forced China’s Treasury “sales”, then some reprieve in collateral availability during October might relieve some of the tightness circumventing any need for more Chinese Treasury selling. Yep. That’s just what happened. According to the latest TIC figures, holdings of UST’s in both mainland China along with Belgium both rose during this same CMB-filled month in question: |
 . |
| But if this “worked” in China, why doesn’t it seem to have helped out anywhere else? Reflationary on collateral, maybe, but that’s not what happened by markets’ accounts. For the Chinese, October may have been a welcome letup in eurodollar problems especially related to what’s powerful confirmation as to the importance of explicitly collateral availability, around the rest of the eurodollar system it was business-as-usual in the 2021 sense of the term.
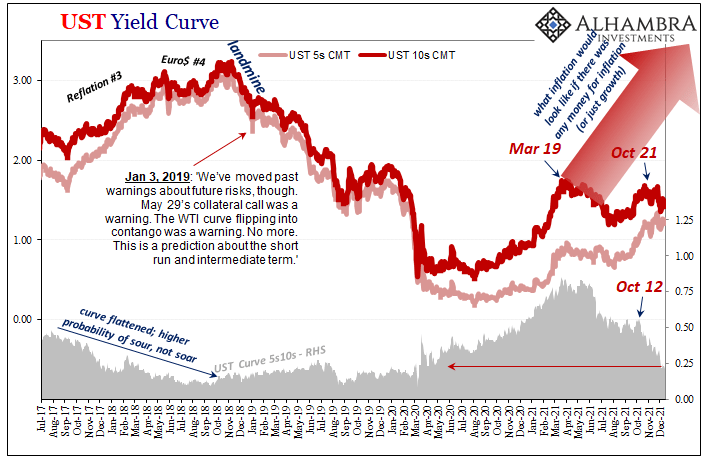
After all, while CNY may have reversed upward and out of its range the rest of the global marketplace began its current descent into the deflationary; curves have been more emphatically flattening, one gone so far as inverting, the dollar exchange rate in general going higher, all dating back to the same overall period in October. |
 . |
| Good for China, bad for everyone else. It may be the zero-sum game it sounds like in such an environment.
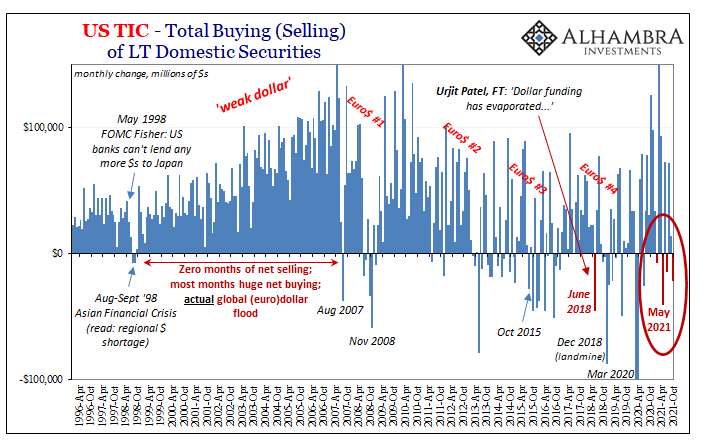
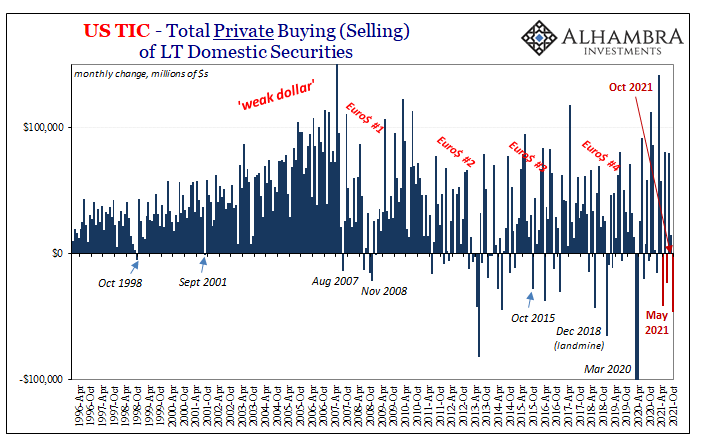
The majority of the TIC data displays this other downward direction in those key metrics. The Chinese weren’t selling their Treasuries, indeed nor were many other foreign officials in October. On the other hand, private holders sold them out by the bucketload. Total net sales of LT US$ assets outright declined during that month, down by a substantial $22.1 billion; of which, private holders net sold $46.5 billion (the global official sector purchased, on net, $24.4 billion; thus China). |
 . |
|
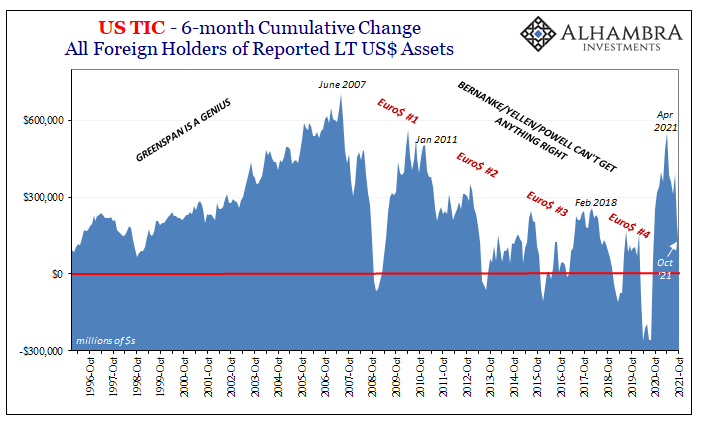
What his data means is and has been unambiguous from the very beginning (the history behind this correlation is worth your time):
During reflationary periods or better, such as the pre-crisis “weak” dollar era, an overabundance of eurodollar funding leads both private and official foreign institutions to purchase lots of US$ assets. An overwhelming amount (which is where Ben Bernanke’s absurd global savings glut was forced into his brain). When eurodollar funding begins to dry up, foreigners will purchase fewer. And when eurodollar funding “evaporates”, to borrow a June 2018 term, foreigners have to outright sell to make up for this specific deficiency. To put it as succinctly as I can, a negative number in TIC, especially private TIC, means nothing good for the global monetary system. We not only find one in October 2021, this latest update with a minus makes it three out of the last six months dating back to May (there’s that month again), now up to four total on the year. |
 . |
| This was supposed to have been the year of inflation, too much money. The back half, in particular, has seen markets indicate more strongly the opposite (even when nominal yields in bonds retraced modestly, almost certainly for seasonal reasons) now backed up by the most useful proxy data we have at our disposal.
Instead, as the US CPI continues to climb upward, the building deflationary mess worldwide gains currency (pun intended). Therefore, as a start, those two things must be unrelated (no surprise given what’s having the most impact on consumer prices). Beyond strictly US boundaries, this is TIC data, after all, while Chinese officials may have benefited from Yellen’s technical adjustment, the natural question to ask is, why didn’t those benefits accrue far more widely around the world? And the answer may be technical issues in/with China we’ll never actually know about. |
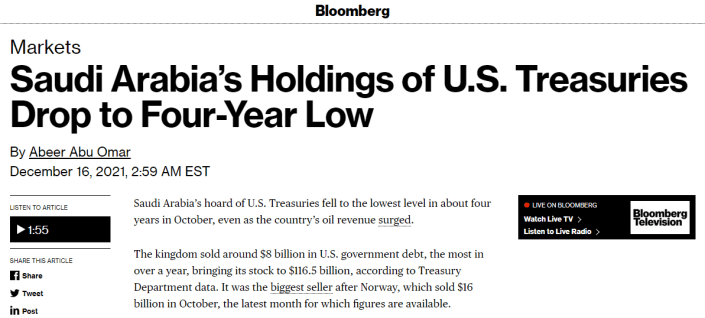 . |
| What’s pretty clear is that they were not widely shared. A flood of what should have been reflationary collateral didn’t actually reflate but a narrow niche.Even the oil producers like Saudi Arabia and Norway weren’t immune from the eurodollar’s ambush despite oil prices pushing upward to new highs. |
 . |
| Oil production countries have been among the brightest spots during this year’s funding retreat, which appears to suggest the eurodollar system overall isn’t too sanguine on even their prospects – which would be consistent with the post-Euro$ #3 judgement by dollar availability.
The Chinese experience has proved to be the outlier, and it may continue to be still given CNY’s continuing behavior, though not an unexpected one. The TIC data, as usual, provides delayed background confirmation of what’s already been observed in market trading, therefore inferred of funding retreat/tightness. In this case, for both China as well as practically everyone else. Starting from the latter first, these mounting minus months of net headline selling are clear signs of overall deflationary money pressures around most of the world. If the order had been reversed, the TIC data in hand before market changes, from the data we’d have expected further curve flattening and maybe inevitably something like the eurodollar futures curve inversion. More tied to the mountain of evidence for the growing Taper Rejection, and directly against the cultish belief in the Fed’s persistent rigging the bond market. The dollar data and the deflationary curves are one in the same regardless of central bank QE or its tapering. Now, as to China…
|
 . |
Full story here Are you the author?
Tags: Bonds,currencies,economy,Featured,Federal Reserve/Monetary Policy,Markets,newsletter


